Introduction
The Ganga river basin, Garhwal Himalaya, India, bas an area of 30 000 km2. It contains more than 1020 large and small glaciers (Reference Vohra and R.Vohra, 1993). It is estimated that 3.4% of the Ganga basin is presently covered by active glaciers (Reference Vohra, J. S. and ModdieVohra, 1981). Earlier studies of the major-ion chemistry of waters in the basin were focused on identifying the source water (Reference Sarin, Krishnaswamy, Dilli, Somayajulu and MooreSarin and others, 1989, 1992). It was estimated that the chemical-denudation rate (CDR) of the Bhagirathi and Alaknanda river basins was 110 and 137 t km-2 a-1, respectively, suggesting intense chemical weathering in the Ganga headwater catchments. The two rivers join together at Devprayag to form the river Ganga.
In this work, we studied the major-ion chemistry of Dokriani glacier meltwater, with a view to assessing the contribution of active glaciers to the higher CDRs derived for the Ganga headwater rivers. Of particular importance is the monsoon which bursts over the eastern part of the Himalaya in the first week of June and contributes a large proportion of the annual runoff in a few months (Reference SharmaSharma, 1993). The monsoon is deflected by mountains and moves westward, extending throughout the region by the end of July, where it persists till mid-September (Reference Mani, J. S. and ModdieMani, 1981).
The runoff from the glacierized valleys of the Ganga river basin is first fed by snowmelt as the transient snowline recedes, and this results in discharge peaks by the end of June. However, the dense cloud cover of the southwest monsoon between July and August over the Garhwal Himalaya cuts off the radiation, and melt from the glacier ice is subdued (Reference CollinsCollins and Hasnain, 1995). The potential of solute acquisition by meltwaters in the subglacial environment is several times higher than in other glacial environments, due to (i) the slow transit time of water within the subglacial system (Reference Tranter and RaiswellTranter and Raiswell, 1991; Reference Tranter, Brown, Raiswell, Sharp and GurnellTranter and others, 1993; Reference Brown, Sharp, Tranter, Gurnell and NienowBrown and others, 1994, 1996; Reference CollinsCollins, 1995), (ii) the availability of large amounts of freshly comminuted rock flour, (iii) the availability of reactive minerals, such as carbonates and sulphide in the rock flour, and (iv) the relatively rapid oxidation of sulphide in the fresh rock flour, providing additional protons for chemical weathering (Reference Tranter, Brown, Raiswell, Sharp and GurnellTranter and others, 1993; Reference Brown, Sharp and TranterBrown and others, 1996).
In this paper, we present detailed chemical results from daily meltwater samples collected during May–October 1994 from the Dokriani glacier in the Ganga basin. The results are analyzed with a view to evaluating the role of monsoonal rainfall and supraglacial weathering of moraine in controlling runoff chemistry.
Study Area
The Dokriani glacier is a small glacier, located in the Uttarkashi district of Uttar Pradesh. The glacier lies 25 km east of Bhukki. It extends from latitude 31° 49′ to 35° 20′ N and from longitude 78° 47′ to 78° 05′ E (Fig. 1). The total length of the glacier is 5 km. The stream emerging at the glacial portal is Din Gad, which joins with the Bhagirathi at Bhukki. The total area of the glacier catchment is 9.58 km2, of which 5.76 km2 is glacierized. Three-quarters of the glacier ablation area is covered by thick debris. The accumulation area of the glacier is about 2.5 km2, consisting of two cirque glaciers, one originating on Draupadi ka Danda and the other on Janoli. The equilibrium line is at ~4960 m.
Methodology
Field studies were carried out for a period of 6 months from 8 May to 31 October 1994, covering the entire ablation period. Samples were collected at a gauging station established 600 m downstream from the glarier snout. Two samples were collected each day, corresponding with diurnal low flow (0800 h) and high flow (1700 h). Samples were immediately filtered through a Millipore 0.45 μm membrane filter paper by using a pneumatic pump and filtration apparatus. Bicarbonate was determined in the field by using an Orion 201 auto-titrator. Fifty millilitres of the sample was titrated against 0.004N HCl until an end-point of pH 4.5 was reached (APHA, 1985). Filtered samples were later brought to the laboratory at Delhi and were analyzed for the major cations (Ca2+, Mg2+, Na+ and K+) and allions (SO4 2- and Cl-). Analysis of cations was carried out by flame atomic absorption spectroscopy with a GBC (906) atomic absorption spectrophotometer. Calcium and magnesium were analyzed in absorption mode, and sodium and potassium were analyzed in emission mode. Sulphate analysis was carried out by a turbidimetric method, using a GBC (911) UV/VIS spectrophotometer. The absorbance of BaSO4 suspension was measured at 420 nm (APHA, 1985). The minimum detection limit by this method is 1 mg L-1. Chloride was determined by the mercury (II) thiocyanate method (Reference Florence and FarrarFlorence and Farrar, 1971). The absorbance of chloromercurate ions was measured at 460 nm with a UV/VIS spectrophotometer. Three replicates were run for cation analysis, and the instrument was recalibrated alter every 15 samples. An overall precision, expressed as per cent relative standard deviation (RSD) was obtained for entire samples. Analytical precisions for Ca2+, Mg2+, Na+ and K+ were 1.5, 1.1, 2.0 and 1.2, respectively. Overall data reproducibility for anions was ± 5%. Discharge was calculated by establishing a rating curve for the gauging site.
Map of the Dokriani glacier catchment

Results and Discussion
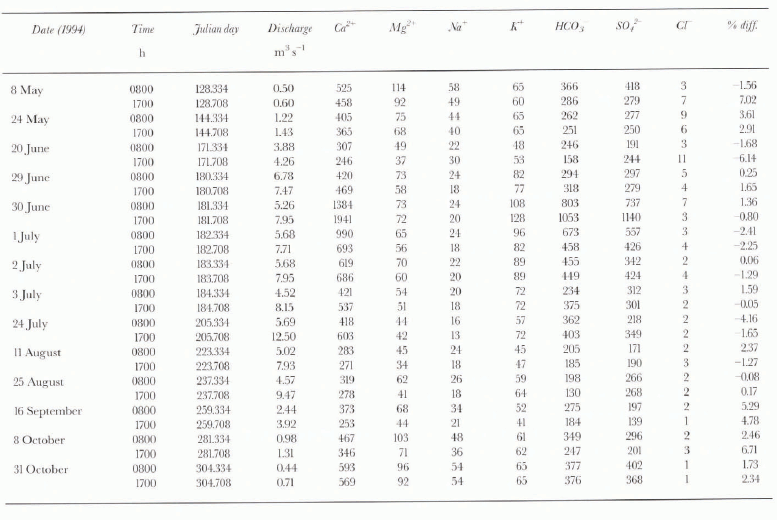
The chemical composition of Dokriani glacier meltwater for low flows (0800 h) and high flows (1700 h) for selected flow regimes during the 1994 ablation period is shown in Table 1, which also shows the percentage charge balance error. The charge balance between cations and anions is < 10%, confirming the reliability of the analytical results. The total cations (TZ+) and anions (TZ-) are related by the equation, TZ+ = 0.98TZ- + 27.6 with a correlation coefficient of 0.95 for 360 samples. The range of ionic concentrations during the pre-monsoon, monsoon and post-monsoon seasons of the 1994 ablation period is given in Table 2. The major anions, sulphate and bicarbonate, have ranges of 85–1140 and 128–1053 μeq L-1, respectively. Ca2+ was the major cation, with a concentration of 234–1941 μeq L-1, and accounts for 66–90% of the total cations. K+ and Mg2+ comprise 6–20% and 3–15% of the total cations, respectively. Table 3 shows the cationic composition of Dokriani glacier meltwater in comparison with other glaciers.

Sources of Dissolved Ions
The chemical composition of glacial meltwaters has demonstrated high rates of chemical weathering in subglacial environments (Reference Reynolds and JohnsonReynolds and Johnson, 1972; Reference CollinsCollins, 1979; Reference RaiswellRaiswell, 1984; Reference Sharp, Brown, Tranter, Willis and HubbardSharp and others, 1995; Reference Brown, Sharp and TranterBrown and others, 1996). The two major anions, HCO3 - and SO4 2-, in glacial meltwaters are mainly derived from the dissolution of atmospheric carbon dioxide and carbonates, and the oxidation of sulphides (Reference Souchez, Lemmens, A. M. and ClarkSouchez and Lemmens, 1987). Dissociation of CO2 and sulphide oxidation are the two main reactions that provide the bulk of the protons to weather carbonates, silicates and aluminosolicate in the drainage basin. The anionic content of glacial meltwater therefore reflects the acid sources used in the chemical weathering of bedrock minerals. The relative proportions of various ions in solution depend on their relative abundance in the bedrock and their solubility (Reference RaiswellRaiswell, 1984; Reference Tranter, Brown, Raiswell, Sharp and GurnellTranter and others, 1993). Sources of dissolved ions in the Dokriani glacier meltwaters can be evaluated by studying the relationship among the ions. A parametric correlation analysis for all measured ions during the 6 month observation period is given in Table 4. HCO3 - and SO4 2- are highly correlated with calcium (r 2 = 0.94 and 0.92, respectively) and with potassium (r = 0.71 and 0.74). The proportion of HCO3 - and SO4 2- in the meltwaters reflects the relative dominance of the two major sources of protons during the subglacial chemical erosion. According to Reference Brown, Sharp and TranterBrown and others (1996), the ratio of HCO3 - to (HCO3 - + SO4 2-), referred to as the C-ratio, has a value of 1.0 when carbonation reactions involving atmospheric CO2, dominate (as in Equations (1) and (2)), and a value of 0.5 when coupled reactions involving the weathering of carbonates by protons derived from sulphide oxidation dominate (as in Equation (3)).


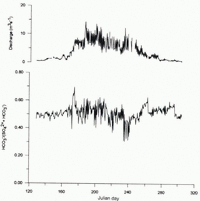
The C-ratio of the Dokriani glacier meltwater during May and June is 0.5 (Fig. 2), suggesting the dominance of carbonate dissolution and the oxidation of sulphides (Reference Brown, Sharp, Tranter, Gurnell and NienowBrown and others, 1994). From late June to early July (Julian days 174–187), high discharges were derived largely from ice-and snowmelt, which rapidly passed through the hydro-logical system. The enhanced C-ratio (0.55 and 0.7) during this period indicates that protons are additionally derived from the dissolution and dissociation of atmospheric CO2 (Reference Brown, Sharp and TranterBrown and others, 1996). During July and August (Julian days 195–243), cloud cover over the Himalaya, linked to the onset of the southwest monsoon, cuts off radiation and causes snowfall in (he accumulation zone and rainfall in the ablation region (Reference CollinsCollins and Hasnain, 1995). Meltwater discharges during this cloudy, monsoonal period were likely to be sustained by drainage of a subglacial reservoir built over the previous months. Hence, runoff contains a very high proportion of stored subglacial water. The C-ratio during this period varies between 0.31 and 0.63, suggesting the dominance of carbonate dissolution and sulphide oxidation in controlling the meltwater composition. The cloudburst on 24 August (Julian day 236) resulted in high discharge (17.45 m3 s-1) and the lowest C-ratio (0.31), as shown in Figure 2, suggesting that rainfall running through supraglacial moraine may also have a strong control on the chemical characteristics of melt water.


Ratio of HCO3 - to (HCO3 - + SO4 2-) in bulk melt-waters draining the Dokriani glacier, May–October 1994.

Figure 3 shows the relationship of SO4 2- and HCO3 - to total cations for the rising limb, the crest segment and the falling limb of all hydrographs from May through October. Both sulphate and bicarbonate show good correlation with TZ+ on the rising limb, with sulphate showing better correlation, whereas bicarbonate was better correlated to TZ+ on the falling limb. The crest segment is characterised by comparatively low correlation of TZ+ with bicarbonate and sulphate individually, but the relationship improves to r 2 = 0.82 when bicarbonate and sulphate are combined. These data show that pyrite oxidation and carbonate dissolution are dominant solute suppliers to waters on the ascending limb of the hydrograph, and that carbonation reactions became more important on the falling limb of the hydrograph.
Role of Monsoonal Rainfall and Weathering of Supraglacial Moraine
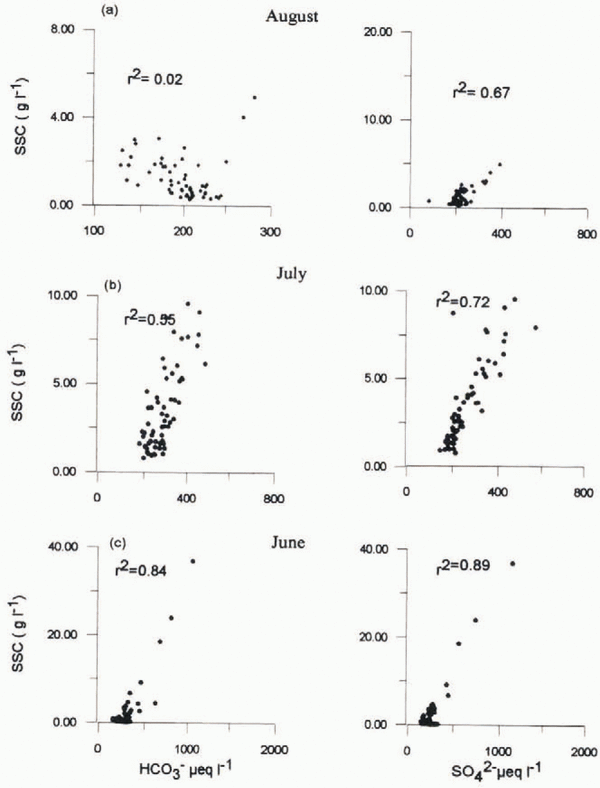
A total of 1269 mm of rainfall fell on the Dokriam glacier during the May–October 1994 observation period, mostly during the months of July and August. This rainfall pushed large quantities of debris into the glacier sole through crevasses (Reference Hasnain and ChauhanHasnain and Chauhan, 1993). During June, HCO3 - and SO4 2- show a good positive correlation with suspended-sediment concentrations (r 2 = 0.84 and 0.89, respectively), as shown in Figure 4. This probably indicates the dominance of water from a solute-rich source, water either discharged through sediments at the glacier bed or that has been kept in storage for a long period, as a major transporter of suspended sediment. Successive diurnal melting of snow and ice rapidly leaches most of the sulphate from the snow and ice (Reference Davies, H. G. and Orville-ThomasDavies and others, 1987). Later in the ablation season, the leached snow and ice gives rise to sulphate-depleted supraglacial meltwater (Reference Tranter and RaiswellTranter and Raiswell, 1991). The release of sulphate by the oxidation of sulphides in suspended sediment is a slow process and therefore is only likely to contribute significant sulphate concentrations to waters which have spent long periods at the glacier bed in contact with sediments (Reference Brown, Sharp, Tranter, Gurnell and NienowBrown and others, 1994). However, contrary to these observations, Dokriani glacier meltwaters show higher sulphate concentrations during July and August and show good positive correlation between SO4 2- and suspended-sediment concentration (r 2 = 0.72 and 0.67, respectively), as shown in Figure 4. One possible explanation is as follows: Continuous low-intensity rainfall may have initialed pyrite oxidation within the supraglacial moraines. Thereafter, occasional high-intensity showers may leach the sulphate from the debris and cause its domination during the seasonal high-flow period of July and August, when suspended-sediment concentrations arc high. The percentage contribution of suspended sediments from the supraglacial sources in the bulk flow is not known. The post-monsoon dry period of September exhibits a weak correlation between SO4 2- and suspended-sediment concentration (r 2 = 0.09), and thus substantiates the observation of Reference Tranter, Brown, Raiswell, Sharp and GurnellTranter and others (1993) that reactive sulphides will be largely absent from rock flour transported from the subglacial system.
Relationship of SO4 2- and HCO3 - to total cations for rising limb, crest segment and falling limb, May–October 1994.

Relationship between SO4 2- and HCO3 - with suspended-sediment concentration (SSC) for June–August 1994.

Solute Fluxes and Chemical-Denudation Rates
Solute fluxes in glacial meltwaters usually increase with discharge. The largest solute fluxes are transported by the most dilute melt water as solute concentration is usually inversely related to discharge (Reference Sharp, Brown, Tranter, Willis and HubbardSharp and others, 1995). Figure 5 shows the relationship between the fluxes of SO4 2- and HCO3 - with the glacial discharge. The flux of SO4 2- as a proportion of the flux of SO4 2- + HCO3 - increases from 40–45% at 2 m3 s-1 to 40–63% at 10 m3 s-1. This reinforces our contention that the weathering of supraglacial moraines initiated by monsoonal rainfall enhances the sulphate concentration at high discharges. This is contrary to the results obtained by Reference Sharp, Brown, Tranter, Willis and HubbardSharp and others (1995) in the catchment of Haul Glacier d’Arolla in Switzerland.
The cationic denudation rates from some of the important glaciers in the European Alps and North America are given in Table 5. The cationic denudation rate of Dokriani glacier is 4160 meq m-2 a-1, about four times higher than the highest recorded at Gornergletscher, Swiss Alps (Reference MetcalfMetcalf, 1986). The CDR of the Dokriani glacier was 321 t km-2 a-1. Monthly values of chemical denudation during the 1994 observation period are given in Table 6. The high CDR substantiates our observation that the high relief, southwest monsoonal rainfall and supraglacial moraines are very significant in controlling the chemistry of Garhwal Himalaya glacial meltwaters.
Relationship between the fluxes of SO4 2- and HCO3 with meltwater discharge during May–October 1994.

Conclusions
A detailed hydrochemical study of Dokriani glacier meltwater has been carried out with a view to evaluating the controls on the major-ion chemistry of the glacierized Himalayan basin. The important conclusions are:
-
1. The dominance of Ca2+, HCO3- and SO4 2- in meltwaters throughout the ablation period suggests that the meltwater chemistry is dominated by coupled reactions involving sulphide oxidation and carbonate dissolution.
-
2. High sulphate concentrations and the good relationship between SO4 2- and suspended-sediment concentrations during July and August suggests that the monsoonal rainfall enhances the supraglacial moraine weathering, providing high SO4 2- content in the meltwater during periods of high discharge. This is substantiated by observed higher sulphate fluxes during high discharges.
-
3. The CDR of the Dokriani glacier catchment is 321.6 t km-2 a-1, suggesting very high rates of chemical weathering in the southern Himalayan glaciers.


Acknowledgements
We thank the Department of Science and Technology, Government of India, for providing financial assistance for the Dokriani glacier studies.