


I. INTRODUCTION
III-N semiconductors are becoming a top material choice for future telecommunication amplifiers. Applications in which high power and frequency performance are to be achieved together with a high linearity and reliability of systems require efficient transistor cooling. Indeed, understanding and measuring a self-heating effect is becoming increasingly important as devices are becoming smaller and power densities higher.
AlGaN/GaN HEMT operation up to 600°C without irreversible damage has been documented [Reference Shin and Trew1, Reference Daumiller, Kirchner, Kamp, Ebeling and Kohn2]. However, it was shown that elevated temperature instantaneously decreases channel electron mobility [Reference Shin and Trew1–Reference Kohn4], decreases maximal drain current [Reference Daumiller, Kirchner, Kamp, Ebeling and Kohn2], increases gate leakage [Reference Daumiller, Kirchner, Kamp, Ebeling and Kohn2], and degrades transistor RF performance [Reference Shin and Trew1]. The role of AlGaN/GaN HEMT effective cooling from the side of the substrate (on which the device is grown) has been described in [Reference Gaska, Osinsky, Yang and Shur5]. Particular attention has recently been devoted to the investigation of thermal coupling at the III-nitride/substrate interface [Reference Zhao6–Reference Eckhause, Süzer, Kurdak, Yun and Morkoc9]. A difference in the acoustic impedance of materials forming the interface gives the level of thermal coupling and determines thermal boundary resistance (TBR) [Reference Turin and Balandin8, Reference Eckhause, Süzer, Kurdak, Yun and Morkoc9]. However, it was also pointed out that dislocations at the interface, such as dangling bonds at the AlN/Si junction [Reference Liu, Ponce, Dadgar and Krost10], might give rise to an additional increase in TBR [Reference Zhao6]. Substantial device “overheating” [Reference Filippov and Balandin7] and performance degradation due to TBR was reported [Reference Turin and Balandin8]. The value of TBR was measured to be 7–8 × 10⁻⁸ m2K/W for the AlN/Si interface at room temperature [Reference Zhao6] and 1 × 10⁻⁴ m2K/W for GaN/sapphire at 4.2 K [Reference Eckhause, Süzer, Kurdak, Yun and Morkoc9] (representing 1–5 × 10⁻⁷ m2K/W at 300 K [Reference Turin and Balandin8]).
Alternatively, the HEMT temperature can be reduced by heat removal from the top. It was shown that heat removal either through the epoxy fill [Reference Sun11] or through properly designed bumps [Reference Das12] of the flip-chip mounted multifinger AlGaN/GaN/sapphire HEMTs can effectively decrease the device thermal impedance without using expensive SiC substrate.
Steady-state temperature in the AlGaN/GaN HEMT has previously been investigated using optical methods such as micro-Raman [Reference Kuball13], micro-photoluminescence [Reference Shigekawa, Onodera and Shiojima14], IR microscopy [Reference Kuzmík, Pogany, Gornik, Javorka and Kordoš15], and liquid crystal thermography [Reference Park, Shin and Lee16] or using the electrical direct current (DC) characterization method [Reference Kuzmík, Javorka, Alam, Marso, Heuken and Kordoš17]. Numerical models were used in the same reports to validate experiments, assuming k to be dependent on [Reference Kuball13, Reference Brown, Borges, Piner, Vescan, Singhal and Therrien18, Reference Park, Shin and Lee16] or independent (linear model) [Reference Shigekawa, Onodera and Shiojima14] of temperature. More recently, a transient interferometric mapping (TIM) technique [Reference Pogany19] has been demonstrated as a valuable tool for tracing the dissipated energy in AlGaN/GaN HEMTs [Reference Kuzmík, Pogany, Gornik, Javorka and Kordoš15] in the transient state. The TIM technique has also been applied for extracting power density distributions, mapping current filaments in silicon devices under electrostatic discharge stress [Reference Pogany, Bychikhin, Litzenberger, Groos and Stecher20].
Within the Top Amplifier Research Groups in a European Team (TARGET) project we developed an electrical method for the determination of temperature in a transient self-heating state of HEMTs (i.e. as in a pulsed regime) [Reference Kuzmik21]. We present the results of AlGaN/GaN HEMTs grown on silicon. Experiments are correlated with the results of the two-dimensional (2D) thermal model and the value of TBR at the interface with silicon substrate is estimated by model fitting. Optical experiments and thermo-optical modeling further independently validate the determined transistor temperature and TBR values.
In the next study we investigated the transient temperature rise in multifinger AlGaN/GaN/sapphire HEMTs subjected to 10 µs voltage pulses [Reference Kuzmik22]. In particular we investigated the role of the airbridge structure in device thermal management. Airbridge technology is used in high-power HEMTs to connect parallel source contacts in a multifinger layout. Finally we studied TBR and its effect on thermal management in the transfer length method (TLM) GaN HEMT test structures grown alternatively on three kinds of commonly used substrate materials: Si, SiC, and sapphire [Reference Kuzmik, Bychikhin, Pogany, Gaquière, Pichonat and Morvan23]. The temperature drop at the III-nitride/Si interface is investigated by using a micro-Raman spectroscopy technique under DC conditions. TBR at the III-nitride/SiC and III-nitride/sapphire interfaces is characterized in transient mode by TIM.
II. METHODS AND STRUCTURES
A) Electrical characterization method
The transient electrical method of temperature determination in the process of self-heating was developed from the DC steady-state characterization method [Reference Kuzmík, Javorka, Alam, Marso, Heuken and Kordoš17]. The DC steady-state method was based on the effect of the HEMT drain current drop ΔI sat(V D) as the drain voltage is increased. This effect was described analytically by [Reference Kuzmík, Javorka, Alam, Marso, Heuken and Kordoš17]

where g m is transconductance, and ΔR S, ΔV T, and Δv sat are temperature-driven changes in the source resistance, threshold voltage, and electron saturation velocity, respectively. V D represents drain voltage and R sub represents leakage through the buffer layer. Calibrating the steady-state dependencies of transistor parameters on temperature (ΔR S and ΔV T = f(T), Δv sat was neglected), it is possible to determine the HEMT channel temperature as a function of dissipated power V D×I sat.
To investigate self-heating in the transient state, we applied a transmission line pulser (TLP) to bias the HEMT drain contact (the source and the gate were grounded during the pulse). In the TLP technique a coaxial cable (TL) with a 50 Ω characteristic impedance was charged by a voltage source and later discharged by closing a relay, providing rectangular voltage pulses. Different values of the charging voltage were used while a pulse duration of 480 ns was fixed as given by the cable length. The current and voltage waveforms on the drain were recorded using a digital oscilloscope.
To describe a temperature-induced time-dependent current drop ΔI sat(t), we used methodology of the DC method, taking into account several differences. First of all, as the voltage is kept constant during the pulse, the same is assumed for the buffer leakage current and the last term in (1) can be omitted. Secondly, it is necessary to take into account that the calibration of HEMT parameters (ΔR S = f(T), ΔV T = f(T)) is always performed in the steady state, while the method is transient. The change of HEMT source resistance ΔR S = f(T) may be related to the decreased electron mobility with temperature. Similarly to the DC case we neglect Δv sat, introducing approx. 10% error in the temperature determination [Reference Kuzmík, Javorka, Alam, Marso, Heuken and Kordoš17]. Consequently, ΔI sat(t) can be expressed as

To obtain ΔR S = f(T) dependence, the device was gradually heated using an external heater up to 250°C. R S was measured at low drain current so that the low dissipated power (~50 mW/mm) minimized the self-heating. Using a polynomial fit of the calibration curves R S = f(T) and g m(T) = g m(300 K)/[1 + g m(300 K) × ΔR S(T)] together with the measured ΔI sat(t), an iterative solution of (2) was performed to obtain channel temperature transient characteristics.
B) Micro-Raman measurements
Micro-Raman measurements were performed using a Labram micro-Raman system [Reference Pichonat24]. The temperature dependence of semiconductor phonon frequencies and Stokes/anti-Stokes peak intensity [Reference Balkanski, Wallis and Haro25] was used for calibration, in which an externally heated sample was probed by a laser beam of the Raman system. The temperature increase due to the self-heating effect in the AlGaN/GaN/Si HEMT test structure was investigated afterwards by comparing the phonon frequencies. For the 514.5 nm line of an argon ion laser beam, the GaN layer is transparent. However, for the given wavelength the beam is strongly absorbed in the Si substrate (which is not the case for SiC and sapphire substrates) with an absorption coefficient of 0.76 × 104 cm−1 [Reference Hull26]. Consequently, by applying the probe beam from the device topside, we can investigate temperature discontinuity ΔT at the III-nitride/Si interface by obtaining the information both from GaN and from a part of the Si substrate 1–2 µm from the interface.
C) Transient interferometric scanning method
The scanning TIM method was based on measuring temperature-induced changes in a semiconductor refractive index from the device backside, using a probe laser beam (λ = 1.3 µm). The beam reflected from the device topside undergoes an optical phase shift Δϕ(t), which is measured interferometrically by combining the probe beam (located in the heated area) with an unperturbed reference beam (another branch of the interferometer); see Fig. 1. The phase shift is a sum of two contributions, ΔϕGaN and Δϕsub, that are proportional to the integral of temperature distribution T(x,y,z) along the beam path (z-axis) in GaN or substrate, respectively, weighted by dn/dT:
Laser interferometer measuring principle. The substrate and III-nitrides epistructure refractive indexes are changes due to the device self-heating. A probe beam (1) and a reference beam (2) are combined in an interferometer. The phase of the probe beam changes due to the self-heating effect (exaggerated for visibility).

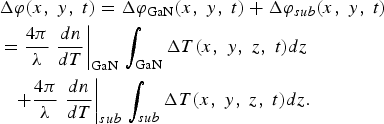
The TIM method operates in the transient (pulsed) regime of the self-heated device with a ns time and 1.5 µm space resolution.
D) Simulation
The Matlab toolbox was used for 2-D numerical thermo-optical simulation. Because of numerical reasons and meshing, TBR at the III-nitride/substrate interface in the model was represented by a virtual 100 nm thick thermal insulation layer with thermal conductivity k ISO (i.e. TBR = 100 nm/k ISO). Adiabatic boundary conditions were assumed for calculations in the transient state. However, for a steady-state simulation we considered 300 µm thick substrate with isothermal (300 K) condition at the backside.
Quantitative evaluation of TBR is based on the comparison of measured Δϕ(t) dependencies with the corresponding quantities calculated using the thermal simulation and equation (3). TBR and dn/dT are taken as fitting parameters. In the thermal model, the source–drain distance defines the device heat dissipation area. 100 nm thick GaN insulation layers (ISO) represent regions where lattice dislocations and/or TBR are decisive. Thermal conductivities of ISOs, k ISO1,2, were used as fitting parameters of the thermal model.
III. RESULTS
A) Transient self-heating in AlGaN/GaN/Si HEMTs
In Fig. 2 we show current and voltage waveforms of devices under 43 V TLP pulse. The HEMT channel temperature increase was determined using the described electrical characterization method and equation (2). Results shown in Fig. 3 are compared with calculated transients. Fitting of the experiment indicates TBR ~7 × 10⁻⁸ m2K/W. The calculated temperature increase is by about 10% higher than the measured one at the end of the pulse. Several reasons may account for this: the fact that Δv sat is neglected (~10% error), simplifications introduced by the model/experiment, and less established physical parameters of III-nitride materials. Nevertheless, the comparison of the experiment with the model with and without ISOs clearly indicates the presence of the thermally insulating layers.
HEMT current–voltage waveforms during 43 V pulse applied on the drain. After [21].

Experimental and calculated (with and without ISOs) temperature increase after a 43 V pulse of 480 ns duration. After [21].

Calculating the average dissipated power over the 400 ns time interval for different voltage levels, we could construct the experimental dependence of HEMT channel temperature (after 400 ns) on delivered power, shown in Fig. 4. Depicted points indicate almost linear dependence ΔT = f(P/w) and, thus, for a selected time instant a device thermal resistance R th = ΔT(t)/P was independent of dissipated power. We obtained R th = ~70 K/W at t = 400 ns. From the temperature exponential behavior in Fig. 3, one can also estimate the heating time constant (approx. 190 ns).
Experimental temperature increase as a function of normalized dissipated power at t = 400 ns. After [21].

The role of insulation layers is further illustrated in Figs 5(a) and 5(b), where temperature profiles are calculated for HEMTs with and without ISOs being considered. A dominant effect of TBR is visible (Fig. 5(b)). After 400 ns the device with ISOs exhibited a surface temperature increase of more than 190 K, by ~80 K more as if ISOs are not present.
Calculated temperature increase profiles in AlGaN/GaN/Si HEMT (a) without and (b) with ISO, at different time instances. After [21].

B) Self-heating in multifinger AlGaN/GaN HEMTs
To investigate heat dissipation in multifinger HEMTs (see Fig. 6), we used the TIM technique. Figure 7 shows the evolution of phase shift profiles taken during a 10 µs/10 V pulse at t = 2, 6, and 10 µs, and after the pulse at t = 30 µs. As expected, the Δϕ(x) signal increases during the pulse due to heating and decreases after the pulse due to cooling, thus reflecting the heat dynamics in the device. The spreading of peaks with time can also be observed due to lateral heat diffusion. The difference in the evolution of the signal magnitude in the valleys marked by arrows A, B (Fig. 7) is remarkable. At position ‘A’, a source contact with the electroplated thick gold metal on it is localized, while an ordinary drain contact is located at ‘B’. At t = 2 µs one observes nearly the same small amplitude ΔϕB ~ ΔϕA; however, for t > 2 µs the phase shift at the ordinary drain contact is higher ΔϕB > ΔϕA. The difference vanishes after the pulse is terminated (t = 30 µs). To interpret this result, we take into account that the phase shift represents only the heat energy in the semiconductor and the substrate, but not that which is transferred from semiconductor to metallization. Then the deeper valleys at position ‘A’ originate from a better heat sinking at the location of airbridges compared to the ordinary drain contact. This effect is negligible for the short time instants (t < 2 µs), and becomes more visible at longer time when heat penetrates more effectively from the active region to the thick metal airbridge.
Back side infrared camera image of the multifinger AlGaN/GaN HEMT. Laser beam is visible in the center, scanning was performed along the x-axis. After [22].

Phase shift evolution (left side vertical scale) and extracted surface temperature increase (right side scale) profiles of the AlGaN/GaN HEMT stressed by 10 V/10 µs drain pulse. The temperature scale holds only for the data at t = 2 and 6 µs, the dashed line depicts phase shift signal after the pulse at t = 30 µs. Positions A mark the signal minimum at the source contacts with airbridge connections, positions B mark the signal at the ordinary drain contacts. After [22].

To estimate the amount of heat transferred via the airbridge at t = 10 µs, we calculate the difference of “areas” S A and S B below the Δϕ signal at contacts, which are proportional to the total dissipated heat; see Fig. 8. The difference of areas was approx. 1.35 µm rad. Taking into account the total area S TOT ~ 68 µm·rad and that the number of airbridge contacts is five, the airbridge cooling efficiency η, i.e. the percentage of the total heat transferred from the device to the airbridge, can be estimated as η = 5 × (S B−S A)/S TOT ~ 10%. A similar ratio of ~10% was obtained also at t = 6 µs, but ~3% at t = 2 µs. Thus it seems that after the initial increase, the cooling efficiency η of the airbridge contacts saturates. The saturation can be explained by the merging of heat waves (Δϕ signals) from neighboring channels at t ~ 6 µs.
Phase shift profiles of the HEMT of Fig. 3 at t = 10 µs with marked areas S A and S B below the source and the drain contacts. After [22].

We present the approach of how to determine temperature maps ΔT surface(x) from the combination of TIM measurements and the knowledge of the ΔT channel value extracted by the electrical method. We first relate the phase shift Δϕ (x) to the GaN surface temperature ΔT surface at the particular time instant. The profiles for t ~ 2–6 µs are the most flat and the difference between the peak and the valley of the ΔT surface(x)/Δϕ(x) distribution is less than 15% (not shown). Consequently, if ΔT channel is known in this time scale, the temperature profile maps can be obtained from TIM phase measurements. Taking into account our results of ΔT channel determination (see Fig. 9) and TIM experiments (see Fig. 7, left Δϕ scale) and provided that ΔT channel/Δϕchannel ~ 730 K/rad at both t = 2 and 6 µs, the phase shift scale of Fig. 7 can be directly transformed into the temperature scale (see right scale, consider only the data at t = 2 and 6 µs). At t = 6 µs one can observe an ~25 K difference between the temperature in the center of the source (position A) and the drain (position B) contacts, representing a 25% change.
Calculated and experimental time evolution of the temperature increase in the channel of HEMT during the 10 V pulse. After [22].

C) Investigation of TBR at different III-nitride/substrate interfaces
Figure 10 shows a steady-state dependence of temperature T on dissipated power density P 2D (=V × I)/area at the GaN/Si interface extracted by the micro-Raman measurements. One can observe a linear increase of ΔT = T GaN − T Si with P 2D, where T GaN and T Si are the temperatures at the GaN and Si sides of the interface. We estimate TBR as ΔT/P 2D, giving a value of ~7 × 10⁻⁸ m2K/W. This value is in very good agreement with our previous study [TBR GaNonSi ~ 7–8 × 10⁻⁸ m2K/W] using TIM [Reference Kuzmik21].
Micro-Raman measurements of the temperature discontinuity at the GaN/Si interface in the steady-state in AlGaN/GaN/Si TLM structure. After [23].

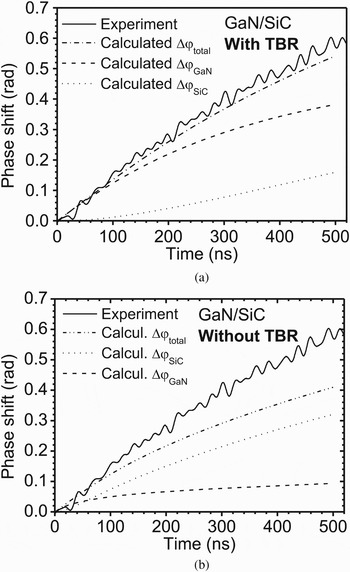
Figures 11(a) and 11(b) show the experimental and modeled Δϕ transients of the studied GaN/SiC TLM device for different values of (dn/dT)GaNonSiC and (TBR)GaN/SiC. Constant power P 2D ~ 8.2 mW/µm2 is dissipated in TLM devices for 500 ns. The best fitting of the data is obtained for (dn/dT)GaNonSiC = 5.2 × 10⁻⁵ K−1 and (TBR)GaN/SiC = 1.2 × 10⁻⁷ W/m2 K (Fig. 11(a)). If no TBR is considered for the same (dn/dT)GaNonSiC = 5.2 × 10⁻⁵ K−1, the calculated and measured data differ by ~30%; see Fig. 11(b). The contributions of phase shift coming from GaN and SiC are also given in the graphs. If TBR is included (Fig. 11(a)) the phase shift arises mostly from GaN where the heat is confined, and this is in contrast to the case of TBR = 0 (Fig. 11(b)).
Comparison of calculated Δϕ total(t) with experimental TIM Δϕ(t) for P 2D ~ 8.25 mW/µm2 in AlGaN/GaN/SiC TLM structure for (a) (TBR)GaN/SiC = 1.2 × 10⁻⁷ W/m2K, (dn/dT)GaNonSiC = 5.2 × 10⁻⁵ K−1 and (b) (TBR)GaN/SiC = 0, (dn/dT)GaNonSiC = 5.2 × 10⁻⁵ K−1. After [23].
In Fig. 12 we demonstrate the role of TBR values for different substrates by calculating the steady-state temperature profiles in the cross-sections of TLM devices at P 2D = 1 mW/µm2. The III-nitride/substrate interface is located 1.2 µm from the surface for all structure types. For clarity the temperature profiles are shown only down to 5 µm from the surface. We assume k Si = 150 W/mK [Reference Hull26]. For the GaN/SiC interface we used the above-obtained TBR = 1.2 × 10⁻⁷ m2K/W; similarly, for GaN/Si we used the previously determined value of 7 × 10⁻⁸ m2K/W, and for GaN/sapphire we tested TBR = 1.2 × 10⁻⁷ m2K/W. As expected, the highest surface temperature T surf was obtained for GaN grown on sapphire (~810 K), while the smallest value was obtained for SiC substrate (~420 K). However, the influence of TBR on device thermal performance, well represented by ratio ΔT/T surf, is the highest for SiC (~65%) and the lowest for sapphire (~10%).
Calculated steady-state temperature cross-section profiles in TLM structures on different substrates. Profiles are calculated for P 2D = 1 mW/µm2 with (TBR)GaN/SiC = (TBR)GaN/sapphire = 1.2 × 10⁻⁷ W/m2K, (TBR)GaN/Si = 7 × 10⁻⁸ W/m2K and without considering TBR. After [23].

IV. CONCLUSIONS
We have developed a transient electrical characterization method for the determination of HEMT channel temperature. Experimentally obtained channel temperature values were correlated with the results of the 2D thermal model, implying the presence of a TBR of about 7 × 10⁻⁸ m2K/W at the GaN/silicon junction.
We studied transient self-heating effects in the multifinger AlGaN/GaN/sapphire HEMT with the airbridge structure connecting sources. We showed that the airbridge structure absorbs the heat and the HEMT thermal design may be optimized for a given pulsed regime. The cooling efficiency of the airbridge structure increases with the time and saturates at ~6 µs, taking away ~10% of the heat.
We experimentally investigated TBR between GaN and Si, SiC, and sapphire. We found TBR to be ~7 × 10⁻⁸±20% m2K/W at the GaN/Si interface and ~1.2 × 10⁻⁷±50% m2K/W at the GaN/SiC interface. It is difficult to estimate TBR at the GaN/sapphire interface; however, in this case the role of TBR was shown to be less important.
ACKNOWLEDGEMENT
This work was supported by the TARGET-“Top Amplifier Research Groups in a European Team” project of the Information Society Technologies Program of the EU under contract IST-1-507893-NOE.
 Jan Kuzmik received Ph.D. from the Slovak Academy of Sciences in 1991. From 1991 till 1994 he was a research fellow at the Institute of Electronic Structure and Laser, Heraklion, Greece. From 1994 he is with the Slovak Academy of Science, from 1996 till 1998 he had been awarded a JSPS Fellowship at the Kyoto Institute of Technology, Japan. Since 2002 he works also at the Institute for Solid State Electronics, TU Wien. His interest includes technology of III–V devices, SiC, GaN HEMTs, and characterization of high-power devices. He is author or co-author of more than 80 scientific papers. He is author of the European project ULTRAGAN on InAlN/GaN power electronics. He chaired EuroConference ASDAM 2000, reviews Journal of Applied Physics, IEEE Electron Dev. Lett. as well as Trans. on Electron Dev.
 Sergey Bychikhin received his M.Sc. (1995) and Ph.D. (2000) degrees from Physics Department of the M.V. Lomonosov Moscow State University, Russia. Since 2000 he joined the group for semiconductor device characterization in the Institute for Solid State Electronics in the Vienna. He is engaged in the field of the thermal and free carrier analysis of the ESD protection structures by backside laser interferometry. His current research interests are in the device characterization and simulation during the HBM and CDM stress.
 Dionyz Pogany received his Dipl. - Ing. degree in Solid State Engineering from the Slovak Technical University in Bratislava in 1987. In 1994 he received a Ph.D. degree at INSA de Lyon, France. In 1994–1995 he was a postdoc at France Telecom, CNET-Grenoble. Since 1995 he is with the Institute of Solid State Electronics, TU Vienna, Austria, where he leads a research team. Since 2003 he is Associate Professor at TU Vienna. He has published on defect states in semiconductors, low-frequency noise, device physics and reliability physics. His current research interest is in electrostatic discharge (ESD) phenomena, current filamentation, self-heating effects and device reliability physics of Si power electronics, ESD protection devices, GaN-based HEMTs and LEDs, and development of new optical methods for device characterization and failure analysis. He is author or co-author of more than 220 scientific papers. He has been managing several R&D projects.
 Dr. Kohn earned his Ph.D. at the Technical University of Aachen (Germany) in 1975. After postdoc studies at the University of Newcastle upon Tyne in the UK and many years in industry in Germany (at AEG Telefunken), France (Thomson CSF), and the US (Siemens) he joined the University of Ulm as professor and Director of the Institute of Electron Devices and Circuits in 1989, also serving as director of the Microelectronics Technology Centre. His research activities include design and technology of advanced electronic device structures in a number of semiconductors, like recently III-nitride heterostructures and diamond for high-temperature, high-power, and high-speed applications. This is accompanied by work on advanced packaging technologies and MEMS sensor and actuator devices, mainly based on CVD diamond for RF applications and applications in electrochemistry and life science. He is a member of the IEEE and Electrochemical Society and has served as IEEE distinguished lecturer. He has been a visiting fellow to the University of Wales (GB), the Norwegian Institute of Technology (Trondheim, Norway), Cornell University (NY), the National Cheng Kung University in Tainan (Taiwan), and the Air Force Research Laboratories in Dayton (OH), and has been an Adjunct Professor of Physics at the New Jersey Institute of Technology, Newark (NJ). He is the Director of the Steinbeis Technology Transfer Centre “Semiconductor Devices”; and his activities have led to two spin-off companies, GFD (Gesellschaft für Diamantprodukte) and MicroGaN.
 Emmanuelle Pichonat received her Engineer Diploma in 1998 from the ESIREM School, Dijon, France. She received the Ph.D. degree from the University of Sciences and Technologies of Franche-Comté, Besançon, France in 2002. From 2003 to 2004, she was a postdoctoral fellow at IEMN, Lille, France. Since 2004, she has been an assistant professor at the LASIR in Lille. Her current research interest is the characterization of III–V devices, HEMTs, and high-power devices by micro-Raman scattering spectroscopy.
 Christophe Gaquière, professor at the University of Lille, carries out his research activity at the Institut d'Electronique de Microélectronique et de Nanotechnology (IEMN). The topics concern design, fabrication, and characterization of HEMT and HBT devices. He works on GaAs, InP, metamorphic, and GaN HEMTs. His main activities are microwave characterizations (small and large signal between 1 and 325 GHz) in order to correlate the microwave performances with the technological and topology parameters. Today, his activities concern the investigation of two-dimensional electronic plasmons for THz solid state GaN-based detectors and emitters and AlGaN/GaN nano-wires for microwave applications. He was responsible for the microwave characterization part of the common laboratory between Thales TRT and IEMN focus on wide band gap semiconductor (GaN, SiC, and Diamond) up to 2007. At the present time he has in charge the Silicon millimeter wave advanced technologies part of the common lab between ST microelectronics and IEMN. Christophe Gaquière is author or co-author of more than 70 publications and 150 publications.
 Erwan Morvan was born in Garmisch in 1971. He first graduated in material physics and semiconductor devices at National Institue for Applied Science (INSA) in Lyon (France). From 1995 to 1999 he was a Ph.D. student at National Center for Microelectronics in Barcelona (CNM). He was active in the field of device and technology simulation and he developed an ion implantation simulator for silicon carbide (SiC) crystal. He got Ph.D. in Electronics from INSA Lyon in 1999. In 2000, he joined the Corporate Laboratory of Thomson CSF (LCR), now called Thales Research and Technology (TRT). From 2000 to 2003, he was involved in SiC MESFET design, technology, and characterization as a research engineer. Since 2003 he has been working on GaN-based high-power/high-frequency devices. He is head of the GaN devices processing team at Alcatel-THALES III-Vlab since 2008.
 Jean-Pierre Teyssier was born in 1963 in Brive, France. Since 1990, he works at the IRCOM/XLIM lab of the University of Limoges, France, in the group of Pr Raymond Quéré. He has presented his Ph.D. thesis in 1994, the subject was about pulsed I(V) and pulsed S-Parameters for nonlinear characterization of microwave active devices. Up to now, he is involved in the design of measurement systems and instrumentation for microwave nonlinear investigations, with an emphasis on time domain pulsed large signal characterization of transistors. Since many years, Jean-Pierre Teyssier and his students are frequent contributors of ARFTG papers, and he has been in fall 2006 the organizer of the ARFTG workshop about RF samplers. He has defended in 2007 his habilitation thesis in order to become a full university professor. He is now a member of ARFTG ExCom, responsible for workshop organization.



