1. Introduction
The dynamics of tracers in turbulent flows has important applications in a variety of physical phenomena, ranging from the dispersion of atmospheric pollutants (Csanady Reference Csanady1973) to the transport of plankton in the oceans (Abraham Reference Abraham1998). Moreover, the motion of tracers is intimately related to the mixing properties of turbulent flows, and therefore determines the statistics of passive fields such as temperature in a weakly heated fluid or the concentration of a dye in a liquid (Falkovich, Gawȩdzki & Vergassola Reference Falkovich, Gawȩdzki and Vergassola2001). The last fifteen years have seen a renewed interest in the Lagrangian study of turbulence thanks to the development of new experimental and numerical particle-tracking techniques (Pandit, Perlekar & Ray Reference Pandit, Perlekar and Ray2009; Toschi & Bodenschatz Reference Toschi and Bodenschatz2009).
Several of the qualitative properties of tracer dynamics in turbulent flows have been understood by means of the Kraichnan (Reference Kraichnan1968) model, in which the velocity is a homogeneous and isotropic Gaussian field with zero correlation time and power-law spatial correlations. Under these assumptions, the separations between tracers form a multi-dimensional diffusion process with space-dependent diffusivity, the properties of which have been studied analytically (Falkovich et al.
Reference Falkovich, Gawȩdzki and Vergassola2001; Cardy, Falkovich & Gawȩdzki Reference Cardy, Gawȩdzki, Falkovich, Nazarenko and Zaboronski2008). In particular, in the smooth and incompressible regime of the Kraichnan model, tracers behave chaotically and spread out evenly in the fluid. If the velocity field is weakly compressible, the Lagrangian dynamics remains chaotic, but tracers cluster over a fractal set with Lyapunov dimension
 $1<D_{L}<d$
, where
 $d$
is the spatial dimension of the fluid (Le Jan Reference Le Jan1984, Reference Le Jan1985; Chertkov, Kolokolov & Vergassola Reference Chertkov, Kolokolov and Vergassola1998). The Lyapunov dimension decreases as the degree of compressibility increases; furthermore, the density of tracers exhibits a multifractal behaviour in space, which indicates the presence of strong fluctuations in the distribution of tracers within the fluid (Bec, Gawȩdzki & Horvai Reference Bec, Gawȩdzki and Horvai2004). Finally, if the degree of compressibility of the Kraichnan model exceeds a critical value, all the Lyapunov exponents of the flow become negative and tracers collapse onto a point-like fractal with
 $D_{L}=0$
. This latter regime only exists if
 $d\leqslant 4$
(Chertkov et al.
Reference Chertkov, Kolokolov and Vergassola1998) and is known as the regime of strong compressibility.
In nature, compressible flows are not only found for large values of the Mach number. An example of a low-Mach-number compressible flow is given by the velocity field on the free surface of a three-dimensional incompressible flow (Sommerer & Ott Reference Sommerer and Ott1993; Cressman et al.
Reference Cressman, Davoudi, Goldburg and Schumacher2004). Furthermore, at small Stokes numbers, the dynamics of inertial particles in an incompressible flow can be assimilated to that of tracers in an effective compressible velocity field (Maxey Reference Maxey1987; Boffetta et al.
Reference Boffetta, Celani, De Lillo and Musacchio2007). Compressible flows like those mentioned above have a non-zero correlation time. In this respect, the Kraichnan model is not realistic, and quantitative discrepancies may be expected between the theoretical predictions and the experimental and numerical observations. In a numerical simulation of a turbulent surface flow, Boffetta et al. (Reference Boffetta, Davoudi, Eckhardt and Schumacher2004) have found that
 $D_{L}$
does decrease as a function of the degree of compressibility, in accordance with the prediction of the Kraichnan model. However, the transition from the weak- to the strong-clustering regime occurs at a larger degree of compressibility compared to the Kraichnan model. This phenomenon is counter-intuitive, because the level of clustering would be expected to increase when the correlation of the flow is non-zero. Thus, the study by Boffetta et al. (Reference Boffetta, Davoudi, Eckhardt and Schumacher2004) raises the questions of the interplay between compressibility and temporal correlation in turbulent flows and of the degree of universality of the weak–strong clustering transition – for further studies on clustering in turbulent surface flows, see Schumacher & Eckhardt (Reference Schumacher and Eckhardt2002), Boffetta, Davoudi & De Lillo (Reference Boffetta, Davoudi and De Lillo2006), Vucelja, Falkovich & Fouxon (Reference Vucelja, Falkovich and Fouxon2007), Ducasse & Pumir (Reference Ducasse and Pumir2008), Larkin & Goldburg (Reference Larkin and Goldburg2010), Larkin, Goldburg & Bandi (Reference Larkin, Goldburg and Bandi2010), Lovecchio, Marchioli & Soldati (Reference Lovecchio, Marchioli and Soldati2013) and Perez-Munuzuri (Reference Perez-Munuzuri2014). The investigation of the universality of this phenomenon is particularly interesting in the light of previous findings of non-universal transport properties in random compressible flows for passive scalar fields (Elperin et al.
Reference Elperin, Kleeorin, Rogachevskii and Sokoloff2000).
For inertial particles, the effect of the temporal correlation of the flow on the Lagrangian dynamics has been studied analytically in the following one-dimensional cases: for a velocity gradient described by the telegraph noise (Falkovich et al. Reference Falkovich, Musacchio, Piterbarg and Vucelja2007) or by the Ornstein–Uhlenbeck process (Wilkinson Reference Wilkinson2011) and for a velocity field given by a Gaussian potential with exponential correlations (Gustavsson & Mehlig Reference Gustavsson and Mehlig2013a ). In the case of tracers in compressible flows, Chaves et al. (Reference Chaves, Gawȩdzki, Horvai, Kupiainen and Vergassola2003) have studied two-particle dispersion in Gaussian self-similar random fields. Falkovich & Martins Afonso (Reference Falkovich and Martins Afonso2007) have calculated the Lyapunov exponent and the statistics of the stretching rates for a one-dimensional strain described by the telegraph noise. Gustavsson & Mehlig (Reference Gustavsson and Mehlig2013b ) have obtained the Lyapunov exponents of a two-dimensional random flow in the limits of short and long correlation times; the solenoidal and potential components of the velocity were assumed to be Gaussian random functions with exponential spatio-temporal correlations.
In this paper, we undertake a thorough study of the effects of temporal correlations on tracer dynamics in a compressible random flow. We consider a compressible version of the two-dimensional renewing flow, which consists of a random sequence of sinusoidal velocity profiles with variable origin and orientation. Each profile remains frozen for a fixed time; by changing the duration of the frozen phase, we can vary the correlation time of the flow and examine the effect on clustering. The renewing flow, in its original incompressible version, has been successfully applied to the study of the kinematic dynamo (Zel’dovich et al. Reference Zel’dovich, Ruzmaikin, Molchanov and Sokoloff1984; Gilbert & Bayly Reference Gilbert and Bayly1992), chaotic mixing (Pierrehumbert Reference Pierrehumbert1994; Antonsen et al. Reference Antonsen, Fan, Ott and Garcia-Lopez1996; Young Reference Young, Thiffeault and Pasquero1999; Elperin et al. Reference Elperin, Kleeorin, Rogachevskii and Sokoloff2000; Thiffeault, Doering & Gibbon Reference Thiffeault, Doering and Gibbon2004; Alexakis & Tzella Reference Alexakis and Tzella2011), inertial-particle dynamics (Elperin et al. Reference Elperin, Kleeorin, L’vov, Rogachevskii and Sokoloff2002; Pergolizzi Reference Pergolizzi2012) and polymer stretching (Musacchio & Vincenzi Reference Musacchio and Vincenzi2011). The properties of this model flow allow us to fully characterise the Lagrangian statistics of tracers as a function of the degree of compressibility and for a wide range of correlation times. We show that, in a time-correlated compressible flow, even single-time Lagrangian averages can differ considerably from their Eulerian counterparts. Furthermore, we demonstrate that the properties of clustering depend not only on universal parameters such as the degree of compressibility and the Kubo number, but also on the specific spatial and temporal properties of the velocity field. In particular, we show that a crucial role is played by the spatial distribution of the stagnation points.
The rest of the paper is organised as follows. In § 2, we introduce the compressible renewing flow and describe its Eulerian properties. In § 3, we compare the Lagrangian and Eulerian statistics of tracer dynamics as a function of the degree of compressibility and of the correlation time of the flow. Section 4 describes the fractal clustering of tracers in the weakly compressible regime and the weak–strong clustering transition. Section 5 concludes the paper by discussing the non-universal character of the weak–strong clustering transition.
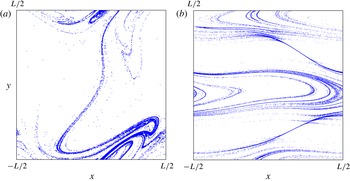
Spatial distribution of tracers in the compressible renewing flow for
 $C=1/4$
and (a)
 $\mathit{Ku}=0.1$
and (b)
 $\mathit{Ku}=10$
. Each plot shows the positions of
 $10^{5}$
tracers. For
 $\mathit{Ku}=10$
, the distribution of tracers mirrors the structure of the flow, which consists of periodic channels and of regions where transport is inhibited by the stagnation lines.

2. Compressible renewing flow
We consider the following velocity field
 $\boldsymbol{u}=(u_{x},u_{y})$
on a periodic square box
 ${\it\Omega}=[-L/2,L/2]^{2}$
:
 $$\begin{eqnarray}\left\{\begin{array}{@{}l@{}}u_{x}=U\sqrt{2(1-C)}\cos (ky+{\it\phi}_{y})+U\sqrt{2C}\cos (kx+{\it\phi}_{x}),\quad \\ u_{y}=0,\quad \end{array}\right.\ 2nT\leqslant t<(2n+1)T\end{eqnarray}$$
and
 $$\begin{eqnarray}\left\{\begin{array}{@{}l@{}}u_{x}=0,\quad \\ u_{y}=U\sqrt{2(1-C)}\cos (kx+{\it\phi}_{x})+U\sqrt{2C}\cos (ky+{\it\phi}_{y}),\quad \end{array}\right.\ (2n+1)T\leqslant t<2(n+1)T.\end{eqnarray}$$
Here
 $n\in \mathbb{N}$
,
 $k=2{\rm\pi}/L$
,
 $U=\sqrt{\langle u^{2}\rangle }$
is the root-mean-square (r.m.s.) velocity and
 $C=\langle (\boldsymbol{{\rm\nabla}}\boldsymbol{\cdot }\boldsymbol{u})^{2}\rangle /\langle \Vert \boldsymbol{{\rm\nabla}}\boldsymbol{u}\Vert _{F}^{2}\rangle$
is the degree of compressibility of the flow. Here,
 $\Vert \cdot \Vert _{F}$
is the Frobenius norm and
 $\langle \cdot \rangle$
denotes a spatial average over the domain
 ${\it\Omega}$
. Note that
 $0\leqslant C\leqslant 1$
;
 $C=0$
corresponds to an incompressible flow, and
 $C=1$
to a gradient flow. The angles
 ${\it\phi}_{x}$
and
 ${\it\phi}_{y}$
are independent random numbers uniformly distributed over
 $[0,2{\rm\pi}]$
and change randomly at each time period
 $T$
.
The velocity field defined in (2.1) and (2.2) is a sequence of randomly translated sinusoidal profiles, each of which persists for a time
 $T$
; the velocity is alternately oriented in the
 $x$
and
 $y$
directions. The renewing flow is in principle non-stationary, because the values of the velocity at two different times are either correlated or independent depending on whether or not the two times belong to the same frozen phase. However, it can be regarded as stationary for times much longer than
 $T$
(Zel’dovich et al.
Reference Zel’dovich, Ruzmaikin, Molchanov and Sokoloff1984). The temporal statistics of the flow is characterised by the correlation function:
 $$\begin{eqnarray}F_{\mathscr{E}}(t)\equiv {\displaystyle \frac{\langle \boldsymbol{u}(\boldsymbol{x},s+t)\boldsymbol{\cdot }\boldsymbol{u}(\boldsymbol{x},s)\rangle _{\mathscr{E}}}{U^{2}}}=\left\{\begin{array}{@{}ll@{}}1-{\displaystyle \frac{t}{T}},\quad & t\leqslant T,\\ 0,\quad & t>T.\end{array}\right.\end{eqnarray}$$
Here
 $\langle \cdot \rangle _{\mathscr{E}}$
denotes a space–time Eulerian average:
 $\langle \cdot \rangle _{\mathscr{E}}\equiv T^{-1}L^{-2}\!\int _{0}^{T}\!\int _{{\it\Omega}}\cdot \,\text{d}s\,\text{d}\boldsymbol{x}$
. The correlation time of the flow is:
 $T_{\mathscr{E}}\equiv \int _{0}^{T}\!F_{\mathscr{E}}(t)\,\text{d}t=T/2$
. A dimensionless measure of the correlation time is given by the Kubo number
 $\mathit{Ku}\equiv TUk$
;
 $\mathit{Ku}$
is proportional to the ratio of
 $T_{\mathscr{E}}$
and the eddy turnover time of the flow.
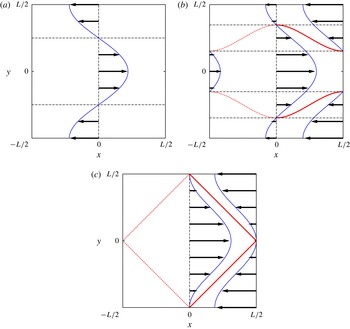
Velocity profile of the renewing flow for (a)
 $C=0$
, (b)
 $C=1/4$
and (c)
 $C=1/2$
. The thick solid grey lines (red online) are the portions of the stagnation lines where
 $\boldsymbol{{\rm\nabla}}\boldsymbol{\cdot }\boldsymbol{u}<0$
.

The position of a tracer evolves according to the following equation:
 $$\begin{eqnarray}\dot{\boldsymbol{X}}(t)=\boldsymbol{u}(\boldsymbol{X}(t),t).\end{eqnarray}$$
Figure 1 shows the distribution of tracers in the weakly compressible regime. The transition from the regime of weak compressibility to that of strong compressibility occurs when the maximum Lyapunov exponent of the flow becomes negative. In this case, the flow is no longer chaotic and tracers are attracted to a point-like set. To study this transition, it is useful to consider the set of stagnation points of the flow, in which
 $\boldsymbol{u}=(0,0)$
. Tracers indeed tend to accumulate in the neighbourhood of these points. From (2.1) and (2.2), we deduce that the set of stagnation points of the renewing flow consists of the two lines
 $$\begin{eqnarray}y=\pm {\displaystyle \frac{1}{k}}\arccos \bigg(\sqrt{{\displaystyle \frac{C}{1-C}}}\cos (kx+{\it\phi}_{x})\bigg)-{\displaystyle \frac{{\it\phi}_{y}}{k}}+2{\rm\pi}m,\end{eqnarray}$$
if the velocity is given by (2.1), or
 $$\begin{eqnarray}y=\pm {\displaystyle \frac{1}{k}}\arccos \bigg(\sqrt{{\displaystyle \frac{1-C}{C}}}\cos (kx+{\it\phi}_{x})\bigg)-{\displaystyle \frac{{\it\phi}_{y}}{k}}+2{\rm\pi}m,\end{eqnarray}$$
if the velocity is given by (2.2). In (2.5) and (2.6),
 $m\in \mathbb{Z}$
is such that
 $(x,y)\in {\it\Omega}$
. The stagnation lines are shown in figure 2 for some representative values of the degree of compressibility. If
 $C=0$
, the flow consists of parallel periodic ‘channels’ of width
 $L/2$
. If
 $0<C<1/2$
, the stagnation lines form barriers that block the motion of tracers over a portion of the domain whose size increases as
 $C$
approaches
 $1/2$
; the width of the periodic channels shrinks accordingly. Finally, if
 $1/2\leqslant C\leqslant 1$
, the stagnation lines divide the domain into regions that are not linked by any streamline. For these values of
 $C$
, there are no periodic trajectories, and if
 $\mathit{Ku}$
is sufficiently large, all tracers collapse onto the stagnation lines. We conclude that the transition from the regime of weak clustering to that of strong clustering must occur for
 $C\leqslant 1/2$
. However, the critical value of the degree of compressibility depends on
 $\mathit{Ku}$
.
3. Lagrangian versus Eulerian statistics
The properties of the flow introduced in § 2, namely the r.m.s. velocity, the degree of compressibility and the correlation function, are of an Eulerian nature. If the flow is compressible and has a non-zero correlation time, the Lagrangian counterparts of the aforementioned quantities may be different. Indeed, tracers are attracted towards the stagnation points and hence do not sample the phase space uniformly.
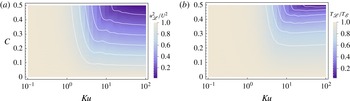
(a) Ratio of the r.m.s. Lagrangian and Eulerian velocities as a function of the Kubo number
 $\mathit{Ku}$
and of the degree of compressibility
 $C$
of the flow. (b) Ratio of the Lagrangian and Eulerian correlation times of the velocity as a function of
 $C$
and
 $\mathit{Ku}$
.

We define the r.m.s. Lagrangian velocity as
 $u_{\mathscr{L}}\equiv \sqrt{\langle u^{2}(\boldsymbol{X }(s),s)\rangle _{\mathscr{L}}}$
, where
 $u=|\boldsymbol{u}|$
and
 $\langle \cdot \rangle _{\mathscr{L}}$
is a Lagrangian average over both the random trajectory
 $\boldsymbol{X}(s)$
and time. Figure 3(a) compares
 $u_{\mathscr{L}}^{2}$
and its Eulerian counterpart
 $U^{2}$
for different values of
 $\mathit{Ku}$
and
 $C$
. The plot includes 51 values of
 $C$
between 0 and
 $1/2$
, and 31 values of
 $\mathit{Ku}$
ranging from
 $10^{-1}$
to
 $10^{2}$
. For each pair
 $(\mathit{Ku},C)$
, we have computed
 $u_{\mathscr{L}}^{2}$
by solving (2.4) for
 $10^{2}$
tracers and for an integration time
 $t=2\times 10^{3}\,T$
(to integrate (2.4), we have used a fourth-order Runge–Kutta method). At
 $C=0$
,
 $u_{\mathscr{L}}$
is the same as
 $U$
for all values of
 $\mathit{Ku}$
, because tracers explore the phase space uniformly. Likewise, at
 $\mathit{Ku}=0$
the Eulerian and the Lagrangian statistics coincide independently of the value of
 $C$
. By contrast, for
 $C\neq 0$
and
 $\mathit{Ku}\neq 0$
,
 $u_{\mathscr{L}}<U$
because tracers are attracted towards the stagnation lines, where
 $u=0$
. The ability of the stagnation points to trap tracers strengthens with increasing
 $C$
and
 $\mathit{Ku}$
; hence
 $u_{\mathscr{L}}$
eventually approaches zero.
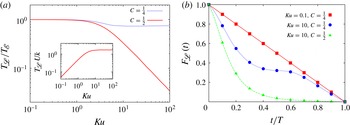
(a) Ratio of the Lagrangian and Eulerian correlation times of the velocity as a function of
 $\mathit{Ku}$
for
 $C=1/4$
and
 $C=1/2$
. The inset shows the Lagrangian correlation time rescaled by
 $(Uk)^{-1}$
as a function of
 $\mathit{Ku}$
for
 $C=1/2$
. (b) Lagrangian correlation function of the velocity for
 $\mathit{Ku}=0.1$
,
 $C=1/4$
,
 $\mathit{Ku}=10$
,
 $C=1/4$
and
 $\mathit{Ku}=10$
,
 $C=1/2$
.

The Lagrangian correlation function of the velocity is defined as
 $$\begin{eqnarray}F_{\mathscr{L}}(t)\equiv {\displaystyle \frac{\langle \boldsymbol{u}(\boldsymbol{X}(s+t),s+t)\boldsymbol{\cdot }\boldsymbol{u}(\boldsymbol{X}(s),s)\rangle _{\mathscr{L}}}{u_{\mathscr{L}}^{2}}}.\end{eqnarray}$$
The associated Lagrangian correlation time is
 $T_{\mathscr{L}}\equiv \int _{0}^{T}\!F_{\mathscr{L}}(t)\,\text{d}t$
. If the flow is incompressible (
 $C=0$
) or if it is decorrelated in time (
 $\mathit{Ku}=0$
), then
 $T_{\mathscr{L}}=T_{\mathscr{E}}$
(figure 3
b). If both
 $C$
and
 $\mathit{Ku}$
are non-zero,
 $T_{\mathscr{L}}$
is smaller than
 $T_{\mathscr{E}}$
, and the ratio
 $T_{\mathscr{L}}/T_{\mathscr{E}}$
decreases as
 $\mathit{Ku}$
or
 $C$
increase (figure 3
b). Again, this behaviour can be explained by considering that a tracer is attracted towards the stagnation points, where
 $u=0$
, and hence its velocity decorrelates from the velocity it had at the beginning of the period. As
 $\mathit{Ku}$
and
 $C$
increase, a larger fraction of tracers get close to the stagnation points, and therefore the decorrelation is faster. The inset of figure 4(a) also shows that, for
 $C$
close to
 $1/2$
,
 $T_{\mathscr{L}}$
is proportional to
 $T$
for small values of
 $\mathit{Ku}$
, whereas it saturates to a value proportional to the eddy turnover time for large values of
 $\mathit{Ku}$
. Indeed, after that time most of the tracers have reached a stagnation point, and their velocities have completely decorrelated.
Figure 4(b) shows that, for small values of
 $\mathit{Ku}$
,
 $F_{\mathscr{L}}(t)$
is the same as
 $F_{\mathscr{E}}(t)$
irrespective of the value of
 $C$
. However, at large
 $\mathit{Ku}$
, not only the Lagrangian correlation time of the velocity but also the functional form of
 $F_{\mathscr{L}}(t)$
varies with
 $C$
.
The degree of compressibility experienced by tracers also depends on
 $\mathit{Ku}$
and
 $C$
and differs from its Eulerian value if
 $\mathit{Ku}\neq 0$
and
 $C\neq 0$
. Let us define the Lagrangian degree of compressibility as
 $C_{\mathscr{L}}\equiv \langle (\boldsymbol{{\rm\nabla}}\boldsymbol{\cdot }\boldsymbol{u})^{2}\rangle _{\mathscr{L}}/\langle \Vert \boldsymbol{{\rm\nabla}}\boldsymbol{u}\Vert _{F}^{2}\rangle _{\mathscr{L}}$
. Then,
 $C_{\mathscr{L}}>C$
for all non-zero values of
 $\mathit{Ku}$
and
 $C$
, because tracers spend more time in high-compressibility regions. For fixed
 $\mathit{Ku}$
, the increase in compressibility is an increasing function of
 $C$
, whereas for fixed
 $C$
it is maximum when
 $\mathit{Ku}$
is near to unity and vanishes in both the small- and the large-
 $\mathit{Ku}$
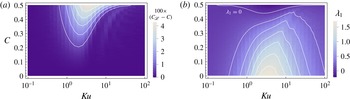
limits (figure 5
a). The non-monotonic behaviour of the Lagrangian compressibility as a function of
 $\mathit{Ku}$
is due to a peculiar feature of the model flow considered here. The stagnation lines (2.5) and (2.6) towards which the tracers are attracted do not coincide with the regions where the local compressibility of the flow is maximum, i.e. the lines
 $ky+{\it\phi}_{y}=m{\rm\pi}$
for
 $2nT\leqslant t<(2n+1)T$
and
 $kx+{\it\phi}_{x}=m{\rm\pi}$
for
 $(2n+1)T\leqslant t<2(n+1)T$
. Therefore, in the long-correlated limit the preferential sampling of the regions of strong compressibility is reduced.
4. Fractal clustering
The spatial distribution of tracers within a fluid can be characterised in terms of the Lyapunov dimension (e.g. Sommerer & Ott Reference Sommerer and Ott1993),
 $$\begin{eqnarray}D_{L}=N+\frac{\ \displaystyle \mathop{\sum }_{i=1}^{N}{\it\lambda}_{i}\ }{|{\it\lambda}_{N+1}|},\end{eqnarray}$$
where
 ${\it\lambda}_{1}\geqslant {\it\lambda}_{2}\geqslant \cdots \geqslant {\it\lambda}_{d}$
are the Lyapunov exponents of the flow and
 $N$
is the maximum integer such that
 $\sum _{i=1}^{N}{\it\lambda}_{i}\geqslant 0$
(
 $d$
denotes the dimension of the flow). Three different regimes can be identified. If the flow is incompressible (
 $\sum _{i=1}^{d}{\it\lambda}_{i}=0$
), tracers spread out evenly within the fluid (
 $D_{L}=d$
). In the weakly compressible regime (
 $\sum _{i=1}^{d}{\it\lambda}_{i}<0$
and
 ${\it\lambda}_{1}>0$
), tracers cluster over a fractal set (
 $1<D_{L}<d$
). In the strongly compressible regime (
 $\sum _{i=1}^{d}{\it\lambda}_{i}<0$
and
 ${\it\lambda}_{1}<0$
), tracers are attracted to a point-like set (
 $D_{L}=0$
). The transition from the regime of weak compressibility to that of strong compressibility occurs when
 ${\it\lambda}_{1}$
changes sign.
(a) Increase in compressibility multiplied by 100,
 $(C_{\mathscr{L}}-C)\times 100$
, as a function of
 $\mathit{Ku}$
and
 $C$
. (b) Maximum Lyapunov exponent of the compressible renewing flow as a function of
 $\mathit{Ku}$
and
 $C$
.

For the smooth
 $d$
-dimensional Kraichnan (Reference Kraichnan1968) flow, the Lyapunov exponents can be calculated exactly (we remind the reader that in the Kraichnan model the velocity field is Gaussian, delta-correlated in time, and statistically homogenous and isotropic). The Lyapunov exponents are
 ${\it\lambda}_{i}=\mathscr{D}\{d(d-2i+1)-2C[d+(d-2)i]\}$
, where
 $i=1,\dots ,d$
,
 $C$
is defined as in § 2, and
 $\mathscr{D}>0$
determines the amplitude of the fluctuations of the velocity gradient (Le Jan Reference Le Jan1984, Reference Le Jan1985). Thus, for
 $d=2$
, the Lyapunov dimension of the smooth Kraichnan model is
 $D_{L}^{0}=2/(1+2C)$
and the weak–strong clustering transition occurs at
 $C=1/2$
. In time-correlated flows, the prediction of the Kraichnan model is recovered in the small-
 $\mathit{Ku}$
limit (Boffetta et al.
Reference Boffetta, Davoudi, Eckhardt and Schumacher2004; Gustavsson & Mehlig Reference Gustavsson and Mehlig2013b
).
In this section, we study how the weak–strong clustering transition depends on
 $\mathit{Ku}$
in the compressible renewing flow. To compute the Lyapunov exponents, we have used the method proposed by Benettin et al. (Reference Benettin, Galgani, Giorgilli and Strelcyn1980). We have set the integration time to
 $t=10^{6}$
for all values of
 $\mathit{Ku}$
and
 $C$
in order to ensure the convergence of the stretching rates to their asymptotic values.
The maximum Lyapunov exponent decreases with increasing
 $C$
(figure 5
b). Its behaviour as a function of
 $\mathit{Ku}$
is different in the weakly compressible and strongly compressible regimes. For small values of
 $C$
,
 ${\it\lambda}_{1}$
is maximum for
 $\mathit{Ku}$
near to unity, which signals an increase in chaoticity when the correlation time of the flow is comparable to the eddy turnover time. By contrast, for values of
 $C$
near to
 $1/2$
,
 ${\it\lambda}_{1}$
is minimum at
 $\mathit{Ku}\approx 1$
, in accordance with the fact that the Lagrangian compressibility is maximum for these values of the parameters (figure 5). We also note that if
 $\mathit{Ku}$
is near to unity,
 ${\it\lambda}_{1}$
becomes negative for
 $C<1/2$
; hence the weak–strong clustering transition occurs at a lower degree of compressibility compared to the short-correlated case.
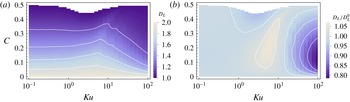
(a) Lyapunov dimension
 $D_{L}$
as a function of
 $\mathit{Ku}$
and
 $C$
. The region in which
 $D_{L}=0$
is coloured in white in the plot. (b) Lyapunov dimension
 $D_{L}$
rescaled by its value at
 $\mathit{Ku}=0$
,
 $D_{L}^{0}$
, as a function of
 $\mathit{Ku}$
and
 $C$
.

Analogous conclusions can be reached by studying the behaviour of
 $D_{L}=1-{\it\lambda}_{1}/{\it\lambda}_{2}$
(figure 6). For fixed
 $\mathit{Ku}$
, an increase in the Eulerian compressibility yields an increased level of clustering. The behaviour as a function of
 $\mathit{Ku}$
is not monotonic and depends on the value of
 $C$
. When
 $\mathit{Ku}$
is near to unity, the level of clustering is minimum if
 $C$
is small and is maximum if
 $C$
is near to
 $1/2$
. Furthermore,
 $D_{L}$
vanishes for values of
 $C$
smaller than the critical value of the short-correlated case. The most important deviations of
 $D_{L}$
from the
 $\mathit{Ku}=0$
prediction are observed for values of
 $\mathit{Ku}$
greater than unity (figure 6
b).
5. Conclusions
We have studied the Lagrangian dynamics of tracers in a time-correlated compressible random flow as a function of the degree of compressibility and the Kubo number. The use of the compressible renewing flow has allowed us to examine a wide area of the parameter space
 $(\mathit{Ku},C)$
. We have shown that, in compressible random flows with non-zero correlation time, Lagrangian correlations differ significantly from their Eulerian counterparts, because tracers are attracted towards the stagnation points and therefore do not sample the phase space uniformly. This fact influences the spatial distribution of tracers within the fluid. In particular, in both the small- and large-
 $\mathit{Ku}$
limits, the critical degree of compressibility for the weak–strong clustering transition is the same as for a short-correlated flow. By contrast, when the correlation time of the flow is comparable to the eddy turnover time, a smaller degree of compressibility is required for the transition to occur. The non-monotonic behaviour of the critical degree of compressibility is a consequence of the fact that the stagnation points do not coincide with the points in which the compressibility is maximum. This behaviour is very different from that observed by Gustavsson & Mehlig (Reference Gustavsson and Mehlig2013b
) in a Gaussian velocity field with exponential spatio-temporal correlations. In that flow, the critical degree of compressibility indeed decreases monotonically as a function of
 $\mathit{Ku}$
and tends to zero in the large-
 $\mathit{Ku}$
limit, i.e. the weak–strong clustering transition is more and more favoured as
 $\mathit{Ku}$
increases.
The comparison of our results for intermediate values of
 $\mathit{Ku}$
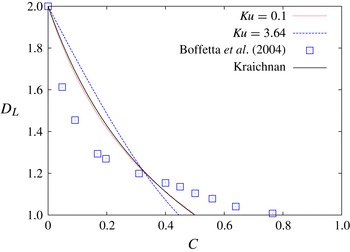
with those by Boffetta et al. (Reference Boffetta, Davoudi, Eckhardt and Schumacher2004) reveals yet another difference. In the compressible renewing flow, the clustering is reduced compared to the small-
 $\mathit{Ku}$
case if the compressibility is small, but it is enhanced if the compressibility is large. This behaviour is the opposite of that found in the turbulent surface flow (figure 7). Moreover, in the renewing flow, the critical degree of compressibility is less than or equal to
 $1/2$
for all values of
 $\mathit{Ku}$
; in the surface flow, it is significantly greater (figure 7). In the light of our findings, it would be interesting to examine the distribution of the stagnation points of the surface flow considered by Boffetta et al. (Reference Boffetta, Davoudi, Eckhardt and Schumacher2004) and understand how it influences the statistics of clustering.
Lyapunov dimension
 $D_{L}$
as a function of
 $C$
for the Kraichnan model (solid curve; black) and for the compressible renewing flow with
 $\mathit{Ku}=0.1$
(dotted curve; red online) and
 $\mathit{Ku}=3.64$
(dashed curve; blue online). The square symbols are from the direct numerical simulation of a turbulent surface flow by Boffetta et al. (Reference Boffetta, Davoudi, Eckhardt and Schumacher2004).

In conclusion, the differences between our findings and those obtained in different flows demonstrate that the properties of tracer dynamics in time-correlated compressible flows are strongly non-universal, to the extent that flows with comparable
 $C$
and
 $\mathit{Ku}$
can have an opposite effect on clustering. In particular, the level of clustering depends dramatically on the peculiar structures of the velocity field towards which tracers are attracted.
Acknowledgements
The authors are grateful to B. Mehlig and K. Gustavsson for useful discussions.