I. INTRODUCTION
Zinc phthalocyanine (ZnPc) is an organic molecular material possessing outstanding electronic and optical properties as well as thermal stability and chemical resistance. ZnPc has been utilized in organic solar cells, Reference Senthilarasu, Velumani, Sathyamoorthy, Subbarayan, Ascencio, Canizal, Sebastian, Chavez and Perez1 photoelectrochemical cells, Reference Karousis, Ortiz, Ohkubo, Hasobe, Fukuzumi, Sastre-Santos and Tagmatarchis2 organic light emitting diodes, Reference Pfeiffer, Leo, Zhou, Huang, Hofmann, Werner and Blochwitz-Nimoth3 photosensitizers, Reference Fabris, Valduga, Miotto, Borsetto, Jori, Garbisa and Reddi4 nonlinear optical materials, Reference Santhi, Namboodiri, Radhakrishnan and Nampoori5 liquid crystals, Reference de la Escosura, Martinez-Diaz, Barbera and Torres6 Langmuir–Blodgett films, Reference Acikbas, Evyapan, Ceyhan, Capan and Bekaroglu7 optical data storage, Reference Gan8 and gas sensors. Reference Acikbas, Evyapan, Ceyhan, Capan and Bekaroglu7,Reference Nahlik, Kasparkova and Fitl9,Reference Kadish, Smith and Guilard10
Vacuum evaporation is most widespread technique to prepare ZnPc thin films. Reference Nahlik, Kasparkova and Fitl9,Reference Kadish, Smith and Guilard10 ZnPc thin films can also be fabricated by sol–gel, glow discharge-induced sublimation Reference Maggioni, Manera, Spadavecchia, Tonezzer, Carturan, Quaranta, Dejulianfernandez, Rella, Siciliano and Dellamea11 and laser assisted techniques such as matrix assisted pulsed laser evaporation (MAPLE). Reference Stanculescu, Socol, Socol, Mihailescu, Girtan and Stanculescu12,Reference Stanculescu, Socol, Rasoga, Mihailescu, Socol, Preda, Breazu and Stanculescu13 MAPLE demands relatively complex deposition procedure involving a necessity of liquid nitrogen cooled target as well as selection of a proper solvent as matrix. Possible photochemical reactions between the matrix and phthalocyanine must be avoided. Furthermore the solubility of ZnPc (like other unsubstituted metal phthalocyanines) in common solvents is much lower than the solubility of substituted metal phthalocyanines. Reference Fitl, Vrnata, Kopecky, Vlcek, Skodova, Bulir, Novotny and Pokorny14 The solubility generally limits the use of unsubstituted metal phthalocyanines in low cost wet technologies. Reference Ghani, Kristen and Riegler15 Hence we recently investigated pulsed laser deposition (PLD) as an option of a simpler laser based technique to fabricate ZnPc film. We reported on optical properties of ZnPc thin film prepared by PLD using KrF laser (λ = 248 nm). Reference Novotny, Bulir, Bensalah-Ledoux, Guy, Fitl, Vrnata, Lancok and Moine16 PLD was also successfully used for fabrication of copper phthalocyanine (CuPc). Reference Matsumoto, Shima, Fujii and Kannari17,Reference Ina, Matsumoto, Shikada and Kannari18 CuPc films preserved the original molecular structure of the target material only at fluence near the ablation threshold of 20 mJ/cm2, Reference Matsumoto, Shima, Fujii and Kannari17,Reference Ina, Matsumoto, Shikada and Kannari18 none of the original structure being observed when nonpolymer organic materials are ablated at relatively high laser fluences. PLD of organic materials with nonpolymer structure might generally suffer in imperfect reconstruction of organic molecular structure from various types of small fragments generated in the laser ablation. Reference Ghani, Kristen and Riegler15,Reference Novotny, Bulir, Bensalah-Ledoux, Guy, Fitl, Vrnata, Lancok and Moine16 On the other hand the chemical change allows the preparation of promising functional organic films with unique structures different from the original target materials. Reference Nishio, Mase, Oba, Matsuzaki and Sato19 PLD has been successfully used for deposition of several nonpolymer organic materials, e.g., tris-(8-hydroxyquinoline) aluminum (Alq3), N,N′-diphenyl-N,N′-bis(3-methylphenyl)-(1,1′-biphenyl)-4,4′-diamine Reference Nishio, Mase, Oba, Matsuzaki and Sato19–Reference Wang and Kwok21 nonlinear nonpolymeric organic compounds, Reference Kajitani, Tanaka, Tange, Matsuda, Ooie, Yano, Yoneda, Katsumura and Suzaki22 binapthyl, Reference Guy, Guy, Bensalah-Ledoux, Pereira, Grenard, Cosso and Vautey23 pentacene, Reference Blanchet, Fincher and Malajovich24 porphyrines, metal acetyl acetonates. Reference Wang and Kwok21,Reference Kajitani, Tanaka, Tange, Matsuda, Ooie, Yano, Yoneda, Katsumura and Suzaki22 The growth of such films by PLD requires detailed knowledge on properties (optical and structural) change with fluence.
Recently, the electronic structure of ZnPc metal phthalocyanine complex was analyzed by a detailed analysis of the ultraviolet-visible (UV–VIS) absorption spectra using time-dependent density functional theory (TD-DFT) calculations. Reference Tawada, Tsuneda, Yanagisawa, Yanai and Hirao25 In our previous articles Reference Kratochvilova, Nespurek, Sebera, Zalis, Pavelka, Wang and Sworakowski26,Reference Sebera, Nespurek, Kratochvilova, Zalis, Chaidogiannos and Glezos27 we provided the calculations of electronic, optical, and charge transport properties of phthalocyanine thin films of H2Pc, NiPc, and NiPc(SO3Na) x to explain charge carrier mobility based on Organic Field Effect Transistor (OFET) experiments.
We report on ZnPc thin films grown by PLD, investigation of influence of fluence and laser repetition rate on film growth and its optical properties characterized by in situ measurements, and characterization of electrical properties and chemical structure of resulted ZnPc film. Density functional theory (DFT) and TD-DFT calculations are used to obtain theoretically accurate interpretation of optical properties influenced by phase of ZnPc thin films.
II. EXPERIMENTAL
ZnPc thin films were grown by PLD (KrF laser, λ = 248 nm, τ = 5 ns) in vacuum on suprasil UV transparent glass substrate at room temperature. Experimental details of the PLD setup are described in Ref. Reference Guy, Bensalah-Ledoux, Lambert, Guillin, Guy and Mulatier28. The substrates were cleaned by standard procedure using ultrasonic bath in ethanol and then in distilled water. The substrate was located 4 cm from the target. The target (diameter of 20 mm and thickness of 3 mm) was formed by casting the ZnPc powder (Sigma-Aldrich Co. LLC, St. Louis, Missouri) under high mechanical pressure of 125 MPa. Fluence (F) was changed from 10 to 100 mJ/cm2. Laser repetition rate (f L) was 50 and 200 Hz. The growth of ZnPc thin film was in situ monitored using transmission measurement in UV–VIS spectral range from 300 to 720 nm. The substrate can be rotated to face either the target or the lamp beam to perform in situ monitoring. Reference Guy, Bensalah-Ledoux, Lambert, Guillin, Guy and Mulatier28 The baseline was measured on the cleaned substrate before deposition, and further data were recorded during the deposition process. The optical properties were ex situ characterized by spectrophotometric measurement (a setup based on Ocean Optics USB4000 minispectrometer and DT-MINI-2-GS light source; Ocean Optics, Dunedin, Florida) and spectral ellipsometry (M2000 ellipsometer, J.A. Wollam Co., Lincoln, Nebraska) in wave length region 250–900 nm. Reference Novotny, Bulir, Bensalah-Ledoux, Guy, Fitl, Vrnata, Lancok and Moine16 The electrical properties were analyzed by van der Pauw resistivity measurements, using a Keithley 6430 source-meter as voltage source/current meter and two Keithley 6514 electrometers as high input resistance (∼1015 Ω) voltmeters (Keithley Instruments, Inc., Solon, Ohio) interconnected in differential read-out mode, in air and vacuum ambient. Colloidal silver was used for contacting the films. Ohmic behavior of the contacts was confirmed by indicative 2-point I–V measurement, using Keithley 6430 model in the voltage source/current meter mode. In all electrical measurements one sample contact was grounded; in addition, triaxial cables and polytetrafluorethylene (PTFE) insulators were used to suppress leakages (leakage resistance of the sample holder and cables was higher than ∼1016 Ω). Film thickness was measured by profilometer (Tencor P8, KLA-Tencor, Milpitas, California). Powder x-ray diffraction (PXRD) was performed using the PANalytical X'Pert PRO diffractometer (PANalytical B.V., Almelo, the Netherlands) with Cu Kα radiation (λ = 1.541874 Å) equipped by secondary monochromator and PIXcel detector (PANalytical B.V.). All samples were measured in the Bragg–Brentano geometry with 2θ in the range of 5–40° with the step of 0.02°. Calibration was done using the powder of LaB6 (SR 660b) from NIST (Gaithersburg, Maryland). Chemical composition and structure of PLD deposited ZnPc films was analyzed by infrared (IR) spectra measured by the attenuated total reflection Fourier transform infrared spectroscopy (ATR FTIR). The spectra were scanned using a BRUKER IFS 66V device (diamond crystal; Bruker, Billerica, Massachusetts) in the interval of wavenumbers from 600 to 1800 cm−1 covering finger-print of ZnPc molecules.
To investigate the effect of ZnPc molecules arrangement for β-phase on the UV–VIS and IR spectra we performed the constrained geometry optimizations (the parameters of crystal cell were fixed at their experimental values) using plane-wave DFT including periodic boundary conditions in all three dimensions by means of program CASTEP. Reference Sebera, Nespurek, Kratochvilova, Zalis, Chaidogiannos and Glezos27,Reference Guy, Bensalah-Ledoux, Lambert, Guillin, Guy and Mulatier28 The atomic coordinates and parameters of crystal cells for ZnPc β-phase were taken from Cambridge Crystallographic Data Center on the basis of Scheidt and Dow. Reference Scheidt and Dow29 The electronic structure calculations were performed using the generalized gradient approximation method of Perdew, Burke, and Ernzerhof (PBE). Reference Perdew, Burke and Ernzerhof30 We used ultrasoft pseudopotentials (a plane-wave kinetic energy cutoff of 310 and 350 eV) and norm-conserving pseudopotentials (a plane-wave kinetic energy cutoff of 700 and 900 eV) for geometry optimizations. Brillouin zone sampling of electronic states was performed on a Monkhorst–Pack mesh. Reference Monkhorst and Pack31 The IR spectra were calculated using norm-conserving pseudopotentials with a plane-wave cutoff energy of 700 eV. Vibrational calculations were performed on well optimized ground state geometry by the finite displacement method. By means of (time-dependent) TD-DFT method as implemented in Gaussian 09 program package Reference Frisch, Trucks, Schlegel, Scuseria, Robb, Cheeseman, Scalmani, Barone, Mennucci, Petersson, Nakatsuji, Caricato, Li, Hratchian, Izmaylov, Bloino, Zheng, Sonnenberg, Hada, Ehara, Toyota, Fukuda, Hasegawa, Ishida, Nakajima, Honda, Kitao, Nakai, Vreven, Montgomery, Peralta, Ogliaro, Bearpark, Heyd, Brothers, Kudin, Staroverov, Kobayashi, Normand, Raghavachari, Rendell, Burant, Iyengar, Tomasi, Cossi, Rega, Millam, Klene, Knox, Cross, Bakken, Adamo, Jaramillo, Gomperts, Stratmann, Yazyev, Austin, Cammi, Pomelli, Ochterski, Martin, Morokuma, Zakrzewski, Voth, Salvador, Dannenberg, Dapprich, Daniels, Farkas, Foresman, Ortiz, Cioslowski and Fox32 the UV–VIS spectra were calculated on the monomer, dimer, tetramer, and hexamer optimized geometry system which was derived from DFT plane-wave calculations. To study the UV–VIS spectra of ZnPc β-phase we used four DFT functionals B3LYP, Reference Becke33 PBE0, Reference Adamo and Barone34 CAM-B3LYP Reference Yanai, Tew and Handy35 recommended for accurate calculations of excited states and the LC-BLYP DFT functional that is a long-range correction Reference Iikura, Tsuneda, Yanai and Hirao36 of generalized-gradient-approximation exchange functional BLYP. Reference Becke37–Reference Miehlich, Savin, Stoll and Preuss39 The atomic basis sets used in these quantum chemistry calculations were 6-31G(d) Reference Rassolov, Pople, Ratner and Windus40 and cc-pVDZ. Reference Dunning41–Reference Woon and Dunning43 The UV–VIS absorption spectra were modeled with the GaussSum software. Reference O'Boyle, Tenderholt and Langner44 Gaussian shapes of the absorption bands were supposed, a full width at half maximum (FWHM) value of 0.12 eV was used.
III. RESULTS AND DISCUSSION
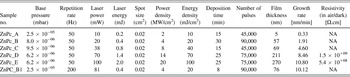
The list of deposited samples including details on deposition conditions is shown in Table I.
List of prepared samples and deposition conditions.

A. Optical properties
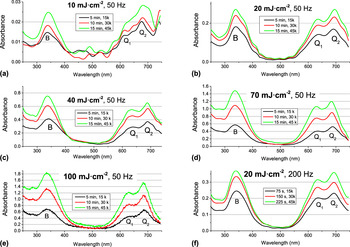
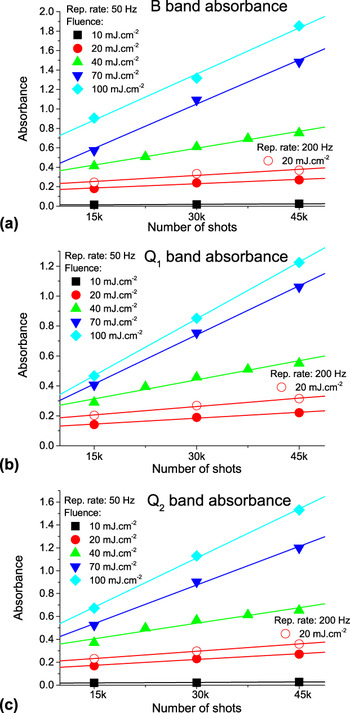
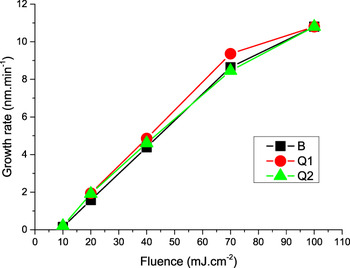
In situ monitoring of optical transmission (absorbance) in UV–VIS was applied to examine variation of the optical properties with film thickness, fluence, and repetition rate. Absorbance was also used to determine fluence threshold (F th) for deposition of ZnPc thin film. The absorbance measurement was usually taken after each 15,000 shots. The evaluation of absorbance as a function of both fluence (which varied from 10 to 100 mJ/cm2) and number of shots (which varied from 15,000 to 45,000) at repetition rate f L of 50 and 200 Hz is depicted on Figs. 1–3.
In situ absorbance evaluation for ZnPc film growth at repetition rate of 50 Hz and fluence: (a) 10 mJ/cm2, (b) 20 mJ/cm2, (c) 40 mJ/cm2, (d) 70 mJ/cm2, (e) 100 mJ/cm2 and at repetition rate of 200 Hz and fluence: (f) 20 mJ/cm2. Absorbance was measured after each 15,000, 30,000, and 45,000 laser shots.

Evolution of absorbance of (a) B, (b) Q1 and (c) Q2 bands during the ZnPc film growth for laser fluence (10–100 mJ/cm2) and repetition rate of 50 and 200 Hz.

Dependence of growth rate on fluence at repetition rate of 50 Hz derived from in situ absorbance (B, Q1 and Q2 absorption bands).

We can observe representative phthalocyanine absorption B and Q bands in the spectra in Fig. 1. Both these bands arise due to the π–π* transitions and the lowest allowed n–π* transition might also be found in the B band. Reference Senthilarasu, Sathyamoorthy and Kulkarni45–Reference Edwards and Gouterma47 ZnPc does not present ligand to metal and metal to ligand transfer bands due to fully filled Zn2+ d 10-configuration, which simplifies the spectra in relation to other metal phthalocyanines. B band is equivalent to γ or the Soret band in porphyrins Reference El-Nahass, Zeyada, Aziz and El-Ghamaz48 and is due to a 2u(π) → e g(π*) together with b 2u(π) → e g(π*) transitions. B band wave length of maximum intensity λmax was varied in range 337–342 nm in the spectra. Q band, equivalent to the α band in porphyrins, is due to a 1u(π) → e g(π*) transitions, with the dipole moment in the plane of the molecule. Reference Henriksson and Sundbom46 Hence this band is very sensitive to the crystal structure and can also be exploited to calculate the average molecular tilt angle of the ZnPc molecules. Reference Senthilarasu, Sathyamoorthy and Kulkarni45,Reference Louis, Lehmann, Friedrich and Zahn49,Reference Barrett, Borkowska, Humphreys and Parsons50 Q band is split due to so-called Davydov splitting (exciton coupling between two nonequivalent molecules in a unit cell) Reference Kadish, Smith and Guilard10 into two bands Q1 and Q2, λmax around 630–638 and 681–695 nm, respectively. The Q1 and Q2 bands are identified as the Q band of the monomer and the dimer or higher aggregates, respectively. Reference Maggioni, Manera, Spadavecchia, Tonezzer, Carturan, Quaranta, Dejulianfernandez, Rella, Siciliano and Dellamea11 Davydov model suggests shifts of the absorption bands—a blue shift of the Q-band is predicted in the case of a cofacial alignment of two or more molecules and a red shift of the Q-band, on the contrary, is expected in the case of coplanar dimers or stripes, as long as a strong coupling of electronic states still occurs.
We could notice a very weak increase of absorbance at F around 10 mJ/cm2, shown in Figs. 1(a) and 2, while a significant increase was obtained for F above 20 mJ/cm2, shown in Figs. 1(b)–1(f) and 2. The dependence of absorbance on the number of shots is rather linear and its slope is increasing with increasing F that might be attributed to increasing growth rate. Reference Guy, Bensalah-Ledoux, Lambert, Guillin, Guy and Mulatier28 We used linear regression fit to visualize absorbance trend in Fig. 2. Absorbance of a sample deposited at F = 40 mJ/cm2 was measured after each 7500 laser shots to verify more accurately evaluation of the absorbance with number of shots. The plots of the absorbance of B, Q1, and Q2 bands (proportional to the deposition rates) versus F are presented in Fig. 3 for f L = 50 Hz. We assume that the deposited material thickness is proportional to the optical absorption following the Beer–Lambert law. The proportionality factor is deduced by comparing the thickness of “thick” samples measured by profilometry with the intensity of particular absorption band (B, Q1, and Q2).
We could establish a fluence threshold F th which defines two regimes: below F th, the deposition rate is very low and above F th, it increases rapidly and depends quasi-linearly on the fluence (Fig. 3). From the curves, we define the ablation threshold F th as the fluence value where the line describing the regime at high fluence crosses the abscissa axis. Based on absorbance evaluation we could estimate the fluence threshold F th ∼ 10 mJ/cm2.
We could reach the highest growth rate GR = 10 nm/min at F = 100 mJ/cm2 at f L = 50 Hz. The growth rate can be also substantially enhanced when elevated f L = 200 Hz is applied. We can follow this fact at the samples grown at same F = 20 mJ/cm2 and different f L values (ZnPc_B and ZnPc_B1) comparing Figs. 1(b), 1(f), and 2 and the data in Table I. We reached higher absorbance at f L = 200 Hz than at f L = 50 Hz for the same number of shots. The enhancement of the GR (the ratio of GR for these samples is ∼5.3) is even higher than expected ratio of particular f L (200/50 = 4), as one can see in Fig. 2 and Table I. We can attribute this effect to deposition of higher amount of material due to elevated heating and melting of the target surface at f L = 200 Hz.
The relative intensities of Q1 and Q2 bands give insight to the phases of ZnPc molecules. Reference Kadish, Smith and Guilard10,Reference Debe51–Reference Chowdhury, Biswas, Majumder, Sanyal and Mallik55 The spectra depicted on Fig. 1, where Q2 band dominates, would correspond to β-form structure of ZnPc films. On the other hand λmax of Q2 band would rather correspond to α-form ΖnPc comparing with experimental data in literature because λmax of Q2 band for β-ZnPc was reported at wavelengths longer than 700 nm. Reference Wojdyła, Derkowska, Łukasiak and Bała54,Reference Senthilarasu, Hahn and Lee56,Reference Cai, Crossley, Reimers, Kobayashi and Amos57
The absorbance values of B and Q bands, when we take into account film growth rate depicted in Fig. 3, are higher than those for films evaporated on substrate at room temperature Reference El-Nahass, Zeyada, Aziz and El-Ghamaz48 but they are rather comparable with those measured on films evaporated at elevated substrate temperature Reference Senthilarasu, Hahn and Lee56 or annealed films. Reference El-Nahass, Zeyada, Aziz and El-Ghamaz48 This finding confirms the growth of different ZnPc phase by PLD compared to evaporation. We can see in the spectra in Fig. 1 that λmax of Q2 band is increasing with increasing fluence while λmax of Q1 band is not varying with fluence only is slightly decreasing with increasing film thickness. Red shift of λmax of Q2 was observed with increasing substrate temperature Reference Senthilarasu, Sathyamoorthy and Kulkarni45 and after thermal annealing Reference El-Nahass, Zeyada, Aziz and El-Ghamaz48 of vacuum evaporated ZnPc films. It could be also correlated with variation of crystalline quality together with surface roughness.
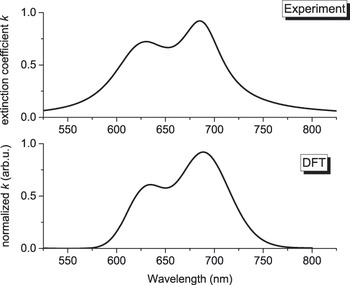
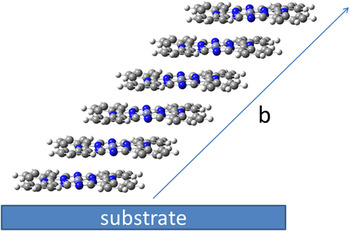
We performed DFT calculations to shed more light on relationship between the optical and structural properties. The DFT functionals B3LYP, PBE0, CAM-B3LYP fail to correctly describe measured UV–VIS spectra. B3LYP and PBE0 functionals do not correctly describe this system, because these functionals include incorrect asymptotic forms of the exchange-correlation potential. Reference Cai, Crossley, Reimers, Kobayashi and Amos57 These functionals can fail to describe charge transfer, especially when electron is moved over large distances. CAM-B3LYP functional is based on long-range correction of the exchange potential developed by Tawada et al. Reference Tawada, Tsuneda, Yanagisawa, Yanai and Hirao25 and applied to modify B3LYP functional. However, UV–VIS spectrum calculated by CAM-B3LYP overestimated experimental UV–VIS spectra and shifts the first and second allowed electronic states to higher transition electronic energy. UV–VIS spectrum simulated by LC-BLYP DFT functional shows very good agreement with experimental UV–VIS spectra (extinction coefficient k of sample ZnPc_E deposited at F = 100 mJ/cm2) as shown in Fig. 4. For this purpose, we have modeled a UV–VIS spectrum using a sequence of calculations with different number of monomers units, atomic basis sets, pseudopotentials and different values of cutoff of plane-wave kinetic energy, see Table SI. Our results show that the calculations for monomer units have only negligible value of Davydov splitting (up to 0.016 eV) and that oscillator strength for first and second allowed electronic transitions are almost the same. The calculations of UV–VIS spectra for tetramer and hexamer systems depicted in Fig. 5 show significant improvement. Davydov splitting is shifted up to 0.140 eV (tetramer systems) and 0.168 eV (hexamer system). Moreover, calculated oscillator strengths for first and second allowed electronic transitions are in the correct ratio (oscillator strength of first allowed electronic transition is higher about ∼24% than oscillator strength of second allowed electronic transition for tetramer system and oscillator strength of first allowed electronic transition is higher about ∼40% than oscillator strength of second allowed electronic transition for hexamer system). The comparison between experimental and theoretical position of λmax of Q1 and Q2 bands and their intensities splitting ratio show that theoretical values calculated for hexamer systems lies very close to experimental values (630 up to 642 nm for Q1 bands and 688 up to 702 nm for Q2 band in comparison to experimental values of 630–638 nm for Q1 band and 681–695 nm for Q2 band) when considering β-form ZnPc. Hence, DFT/TD-DFT calculations revealed that the spectra in Fig. 1 could be attributed to β-phase ZnPc.
Comparison of Q band—extinction coefficient k for sample deposited at laser fluence of 100 mJ/cm2 (ZnPc_E) and DFT simulation.

ZnPc hexamer used for VIS absorption spectra modelled by TD-DFT method. The figure shows the stacking axe b related to monoclinic crystal system.

B. FTIR spectroscopy
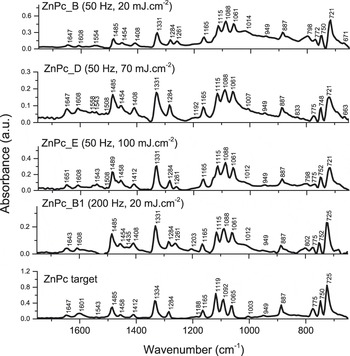
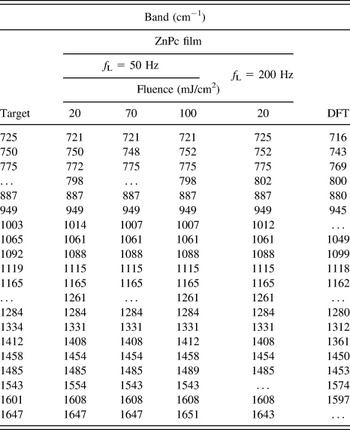
IR spectroscopy measured in fingerprint region (600–1800 cm−1) was involved to characterize chemical structural properties and evaluate deterioration of the deposited ZnPc. FTIR spectra of the ZnPc films deposited at laser fluence 20, 70, and 100 mJ/cm2 (f L = 50 and 200 Hz) and the spectra of the target are depicted in Fig. 6. The experimental band positions and DFT calculated values are listed in Table II. Considering the spectrum of the target, the molecules are randomly distributed and the spectrum shows peaks at 725 and 775 cm−1 corresponding to the out-of-plane vibrational modes of ZnPc (wagging of Cc–H bonds), while the band at 750 cm−1 corresponds to bending motion of Ca–Nb–Ca and Ca–Ni–Ca Reference Saini, Singh, Kaur, Kumar, Sathe and Tripathi58 and all other bands above 800 cm−1 correspond to various in-plane vibrational modes of the molecules. Reference Saini, Singh, Kaur, Kumar, Sathe and Tripathi58 Dominating bands at 1331 and 1485 cm−1 correspond to metal–nitrogen stretching mode and displacement of C–N–C bridge bond for ZnPc molecules, respectively. Reference Bala, Wojdyla, Rebarz, Szybowic, Drozdowski, Grodzicki and Piszczek59 The absorption at 1608 cm−1 can be assigned to a general skeletal vibration of porphyrin ring system. Reference Farag60 The shoulder appearing around 800 cm−1 that was clearly pronounced only in the deposited films can be attributed to Zn–N i vibration and isoindole breathing vibration. Reference Saini, Singh, Kaur, Kumar, Sathe and Tripathi58 We can observe in the IR spectra of the films another absorption band of unknown origin at 1261 cm−1 that is not presented in the spectra of the target. A comparison of the IR spectra of the target and the films shown in Fig. 6 and Table II generally suggest low deterioration of ZnPc material in the films.
FTIR spectra of ZnPc films and target—in dependence on laser fluence: 20, 70, and 100 mJ/cm2 and laser repetition rate 50 and 200 Hz.

Position of observed IR bands of ZnPc in PLD target and films (deposited at different fluence and repetition rate) and calculated by DFT.

Considering the out-of-plane peak positions reported for β-ZnPc films [728, 771 cm−1 (Ref. Reference Louis, Lehmann, Friedrich and Zahn49); 729, 775 cm−1 (Ref. Reference Bala, Wojdyla, Rebarz, Szybowic, Drozdowski, Grodzicki and Piszczek59); 727, 779 cm−1 (Ref. Reference Chowdhury, Biswas, Majumder, Sanyal and Mallik55)] and α-ZnPc [719, 769 cm−1(Ref. Reference Louis, Lehmann, Friedrich and Zahn49); 722, 771 cm−1 (Ref. Reference Saini, Singh, Kaur, Kumar, Sathe and Tripathi58); 721, 769 cm−1 (Ref. Reference Chowdhury, Biswas, Majumder, Sanyal and Mallik55)] makes difficult to unambiguously attribute the phase of the ZnPc target and the films according to the IR spectra. We might suggest the presence of both phases. The peak position could be significantly influenced due to the average crystallite size. In case of nanocrystalline phthalocyanine films of the average crystalline size smaller than 3 nm the contribution of the surface molecules may become considerable with respect to that of the core molecules and a perturbation of the IR features takes place. Reference Maggioni, Quaranta, Carturan, Patelli, Tonezzer, Ceccato and Della Mea61
C. Crystalline structure
The results from PXRD of prepared samples are shown in Fig. 7. There is an obvious presence of Bragg peaks at the 2θ positions of 6.88 and 11.4°, which clearly show that the prepared thin layers of ZnPc are crystalline. The phase analysis from PXRD patterns leads to the monoclinic or triclinic ZnPc phase with the space group C2/n and P
1 respectively,
Reference Schunemann, Elschner, Levin, Levichkova, Leo and Riede62
they can be assigned using PDF-4+ 2013 database source. These Bragg maxima can be indexed as the h00 diffractions of the different orders which depends on phase. For triclinic phase, the order is of h = 1, 2 and for the monoclinic phase h = 2, 4 for the 6.88 and 11.4° of 2θ, respectively. The small intensity broader feature with at 9.39° of 2θ can be indexed as a
 $\left( {hkl} \right) = \left( {\bar 202} \right)$
reflection of the monoclinic phase or as a
 $\left( {hkl} \right) = \left( {\bar 101} \right)$
reflection of triclinic phase. This reflection was not found in thermally evaporated films at room temperature but appeared only in annealed samples.
Reference El-Nahass, Zeyada, Aziz and El-Ghamaz48
We could notice appearance of a broad peak centered at 2θ = 22.3° in XRD patterns that might imply that some of the ZnPc molecular macrocycles lay parallel to the substrate surface plane and their stacking axes are inclined to it.
Reference Senthilarasu, Hahn and Lee63
The broad peak can be also related to the contribution of amorphous phase.
Reference Saini, Singh, Kaur, Kumar, Sathe and Tripathi58
It should be seen that the full-widths of half maxima of the reflections in XRD patterns are broader, which indicates the presence of rather small crystallites of ZnPc.
XRD pattern of ZnPc film [hkl notation for triclinic
 $\left( {100} \right)$
,
 $\left( {\bar 101} \right)$
,
 $\left( {200} \right)$
and monoclinic
 $\left( {200} \right)$
,
 $\left( {\bar 202} \right)$
,
 $\left( {400} \right)$
crystalline phase, respectively].

D. Electrical properties
We noticed a variation of the resistivity of orders of magnitude therefore the measurements were performed at constant voltage (typically −30 and 30 V), which avoided large changes of the potential difference on voltage contacts. The resistivity was then calculated using current values monitored by the source-meter. We observed slow charge relaxation, usually involving several hours. In the relaxed state, we obtained resistivity ρ ≈ 1.5 × 10⁹ Ω cm measured in air ambient for the sample deposited at F = 70 mJ/cm2 (ZnPc_D). When the sample was placed in vacuum (pressure of 10 Pa) the resistivity increased, at least, by one order of magnitude (ρ > 1010 Ω cm), while the observed resistance became comparable with the measurement limit of our experimental setup. Sample deposited at higher fluence F = 100 mJ/cm2 (ZnPc_E) revealed lower resistivity ρ ∼ 5 × 10⁸ Ω cm in air. It might suggest formation of trapping sites at higher laser fluence, which reduces the forbidden energy band Reference Novotny, Bulir, Bensalah-Ledoux, Guy, Fitl, Vrnata, Lancok and Moine16 and resistivity. Measured resistivity values are in agreement with ρ ≈ 4.7 × 10⁷ Ω cm for α-ZnPc and ρ ≈ 4.3 × 10¹¹ Ω cm for β-ZnPc mentioned in literature. Reference Kadish, Smith and Guilard10
IV. CONCLUSIONS
Zinc phthalocyanine thin films were successfully fabricated by PLD using KrF (λ = 248 nm, τ = 6 ns) at fluence from the threshold of 10 to 100 mJ/cm2 and repetition rate of 50 and 200 Hz. It was found that the growth rate increased quasi-linearly with fluence. A comparable maximum growth rate of ∼10 nm/min was reached for samples grown at F = 100 mJ/cm2, f L = 50 Hz and F = 20 mJ/cm2, f L = 200 Hz. In situ optical monitoring of UV–VIS transmission revealed the growth of films of rather β-phase that was supported by DFT/TD-DFT calculations based on ZnPc hexamer unit. XRD proved crystalline character of the film. Electrical resistivity ρ ≈ 108–1010 Ω cm was measured for the films deposited at F ≥ 70 mJ/cm2. We did not observe any substantial deterioration of the ZnPc films after the deposition process.
Supplementary Material
To view supplementary material for this article, please visit http://dx.doi.org/jmr.2015.379.
ACKNOWLEDGMENTS
The research was supported by Czech Science Foundation, project 14-10279S and Ministry of Education, Youth and Sports project of large research infrastructure SAFMAT LM2011029 and Czech Republic–France bilateral project CZ 7AMB14FR010 - FR 31283ZL. Access to computing and storage facilities owned by the National Grid Infrastructure MetaCentrum and Institute of Organic Chemistry and Biochemistry ASCR, is greatly appreciated. Authors also thank J. Náhlík for “fruitful” discussions.