1. Croll in the context of glacial and astronomical theories
During the course of the ‘long 19th Century’, the emergence of a novel perspective and novel method in geology radically transformed the view of Earth history in general, and of the physical character of the most recent major global change in particular (Rudwick Reference Rudwick2005). Cuvier's revolutions (Reference Cuvier1812), representing a series of localised abrupt environmental changes, were transformed in the English translation by Jameson into universal catastrophes, the most recent of which was the biblical Flood, providing support for the diluvial theory (Buckland Reference Buckland1823). Erratics, large boulders lying unconformably on a terrain of different geological composition, presented a difficulty for the diluvial theory, which had to invoke transport by ‘violently moving water’ (de Saussure Reference de Saussure1779–1796) or on ice rafts (Lyell Reference Lyell1840; hence the term ‘drift’ deposits). Von Buch (Reference von Buch1815, Reference von Buch1818) undertook a systematic study of the distribution of erratics, in the Alps and the plains of northern Europe; he identified the sources of the erratics, refuted earlier conjectures for a physical cause and suggested mudslides or subaerial turbidity currents as possible agents. In time, mounting evidence from Switzerland and Scandinavia for the dispersal of erratics and deposition of moraines by the greater extent of glaciers in the past (e.g., Venetz Reference Venetz1833; de Charpentier Reference de Charpentier1841) led to the emergence of the glacial theory and the coining of the term Ice Age (Eiszeit) (Schimper Reference Schimper1837; Agassiz Reference Agassiz1838).
Various theories attempted to account for the occurrence of multiple revolutions and also a gradual cooling during recent geological ages that led to an ice age. Lyell (Reference Lyell1830–1832) proposed a geographical theory based on recurring changes in the distribution of land and sea, and tectonic vertical motions of the continents; he pointed to a gradual uplift of land areas of the northern hemisphere and an increase of land area at higher latitudes to account for global cooling since the early Tertiary. Another family of theories invoked celestial mechanics. Poisson (Reference Poisson1835) suggested that during its geological history the Earth had passed through warmer and cooler regions in space. An early allusion to the occurrence of glaciation as a result of Earth occupying an orbital position farthest from the Sun was by Esmark (Reference Esmark1827), who described evidence of glaciation in Norway and was aware of von Buch's work on erratics. In a paper read to the Geological Society in 1830, Herschel (Reference Herschel1832) assessed the possible effects of changes in the Earth's orbit on geological revolutions. He thought that changes in the eccentricity would be too small to have an appreciable effect on the mean annual amount of solar radiation, but the combined effects of axial precession and apsidal precession could enhance seasonality, leading to changes in climate. Adhémar (Reference Adhémar1842) proposed a theory based on precessional variations with alternating glaciations in the two hemispheres caused by differences in the lengths of the seasons. According to Adhémar (Reference Adhémar1842), the southern hemisphere is in a glacial period, as implied by the presence of the newly discovered Antarctic ice sheet, because its winters are longer by almost 8 days as a result of austral winter occurring at the point of the Earth's orbit farthest from the Sun (aphelion). However, von Humboldt (Reference von Humboldt1821) and Herschel (Reference Herschel1832) had pointed out that seasonal differences arising from precession are in fact balanced over the course of a year and both hemispheres receive the same amount of annual radiation.
Croll proposed that evidence for the recurrence of colder and warmer periods through geological time required ‘some great, fixed, and continuously operating cosmical law’ (Croll Reference Croll1864, p. 129). He developed an astronomical theory that included the effects of both climatic precession and eccentricity, using calculations of orbital variations by Le Verrier; he was also aware of the effects of changes in the inclination of the Earth's rotational axis (obliquity) (Croll Reference Croll1867), though accurate calculations were not available at that time. The main tenets of his theory (Croll Reference Croll1875) were (1) high eccentricity produces on the hemisphere with winter solstice at aphelion long and cold winters and the accumulation of snow and ice; (2) changes in eccentricity lead to long glacial epochs, when the orbit is more elliptical and seasonal differences are accentuated (as from 240–80 thousand years ago (ka)), and to long interglacial epochs with a more circular orbit and subdued seasonal differences (e.g., 80 ka to present); (3) within glacial epochs, precession leads to glaciations alternating between hemispheres every ~11 thousand years (kyr) and in the same hemisphere every ~22 kyr (but only near local maxima in eccentricity; thus during the glacial epoch from 80 to 240 ka, three interglacials would have occurred near 200 ka and not more than two near 100 ka [Croll Reference Croll1884]); (4) changes in obliquity accentuate the effects of precession; and (5) the direct effect of seasonal changes in irradiation is too small and therefore physical agencies (amplifying feedbacks) are required: the cooling effects of snow and fogs on air temperature and ice albedo lead to an increase in the latitudinal temperature gradient and the strength of the trade winds in the colder hemisphere, which in turn lead to changes in ocean currents and interhemispheric heat transport, further amplifying snow and ice accumulation. Croll emphasised that ‘the physical causes are far more powerful than the astronomical’ and that ‘it is the transference of heat by ocean currents from the hemisphere in aphelion to the one in perihelion which is the main reason why the former is cold and the latter warm’ (Croll Reference Croll1884, pp. 97–98). In this view, ‘the main function of the astronomical agents is to keep the physical agencies in operation, and also to determine the character of their operations’ (Croll Reference Croll1884, p. 95). It is for this reason that Croll preferred to term his theory the Physical Theory of Secular Changes of Climate.
The Irish savant Joseph John Murphy (Reference Murphy1869) was first to point to summer as the critical season for glaciation by proposing that a glacial period would occur in the hemisphere with aphelion near the summer solstice, though he agreed with Croll that glaciation would alternate between hemispheres every half-precession cycle. Lyell (Reference Lyell1875) considered the effect of astronomical variations secondary to the influence of physical geography on climate. Moreover, he thought the geological evidence did not support the occurrence of glaciation in one hemisphere at a time and was also not convinced by Croll's (Reference Croll1864) argument that because melting would give rise to thick fogs, the heat in the hemisphere with summer at perihelion would not be sufficient to remove the winter snow accumulation. Croll (Reference Emiliani1875) dismissed Murphy's suggestion, but in in response to Lyell's criticism he accommodated geographical factors (e.g., land–sea distribution, bathymetry) more explicitly into his theory (Croll Reference Croll1884), though he considered them as necessary conditions that enable the active causes (astronomical, physical) to produce glaciation.
The most damaging criticism of Croll's theory, however, centred on the timing of the last glaciation, using relative dating of erosional and depositional features. Dana (Reference Dana1896, p. 978) observed that Croll's theory ‘is objected to by American geologists on the ground that the Glacial period closed…not more than 10,000, or at most 15,000 years ago, instead of…at least 80,000 years, as the eccentricity requires’.
While support for the astronomical theory waned, so-called geochemical theories provided an alternative explanation for changes in climate and the occurrence of an Ice Age (Paillard Reference Paillard2015). Tyndall (Reference Tyndall1861) had suggested that small changes in the atmospheric concentration of water vapour and carbon dioxide (CO2) would suffice to account for changes in climate observed by geologists. Svante Arrhenius (Reference Arrhenius1896) calculated the effect of changes in CO2 concentration on global temperatures during the Ice Age and proposed that small imbalances between sinks and sources would be able to account for this. He also observed that the global nature of these changes would be in accordance with the emerging view in the geological community that glacial periods were simultaneous in both hemispheres, contrary to Croll's theory. Following Arrhenius' work, Chamberlin (Reference Chamberlin1897) proposed a carbon–ice-sheet oscillatory model, with variations in ocean temperature, oxidation of organic matter and silicate weathering leading to changes in CO2 concentration and climate.
The astronomical theory was revived in the first part of the 20th Century by Milankovitch (and promoted by Köppen and Wegener). Milankovitch (Reference Milankovitch1920, Reference Milankovitch, Köppen and Geiger1930, Reference Milankovitch1941) was able to use the Stockwell – Pilgrim numerical values (and later also those of Le Verrier–Miskovitch) of all three astronomical elements (eccentricity, precession and obliquity) to compute changes in insolation at different latitudes over the past 600,000 years before 1800 AD (Berger & Yin Reference Berger, Yin, Alderton and Elias2021). This showed that the impact of changes in obliquity on insolation is symmetrical across the hemispheres, while that of precession is opposite; the effect of obliquity variations is more important at high latitudes, while that of precession is more important at low latitudes. Echoing Murphy and following Brückner et al. (Reference Brückner, Köppen and Wegener1925), Milankovitch considered that the distribution of summer insolation at 65°N would be critical for changes in ice sheets. However, defining summer insolation is not a trivial problem as the length of astronomical seasons varies with Earth's orbital position (Berger & Yin Reference Berger, Yin, Alderton and Elias2021). Given that ice ablation depends both on total irradiation and the length of the summer season, Milankovitch introduced the concept of caloric summer insolation, which is the energy integrated over the caloric summer half of the year (where any day of the summer half receives more insolation than any day of the winter half). The variance of this metric contains a strong obliquity component, whose influence Milankovitch considered crucial for the timing of glaciations. Thus, instead of glaciations alternating between hemispheres, he proposed synchronous global climate changes, which were further amplified by the effect of large northern hemisphere ice sheets on planetary albedo. According to the Milankovitch formulation of the astronomical theory, periodic expansions of northern hemisphere ice sheets are driven by variations in the Earth's orbital geometry and axial inclination that influence the amount of summer isolation received at northern high latitudes.
2. Croll and the geological record
In a paper on the Post-Tertiary and Quaternary formations of Switzerland, Morlot (Reference Morlot1855) drew attention to evidence for two separate glacial periods, with an intervening diluvial period of considerable length, but of unclear character that included remains of wood and shells of recent freshwater species, but also mammoth. A few years later, Archibald Geikie reported the presence of stratified deposits within the glacial drift of Scotland, providing ‘good evidence to show that even during the accumulation of the Scottish till, this extreme [glacial] rigour was not the constant and universal condition of the climate’ (Geikie Reference Geikie1863, p. 92). However, the length of the temperate interval was unclear. Around the same time, Oswald Heer, Professor of Palaeobotany in Zürich, presented evidence for the development of mixed forest and temperate fauna in beds sandwiched between glacial deposits at Dürnten, Switzerland and proposed the term ‘interglacial formation’ (Heer Reference Heer1865). To our knowledge, this is the first time the term ‘interglacial’ was introduced in the literature. Within a few years, a substantial number of interglacials deposits had been identified in the British Isles, Scandinavia, Central Europe and North America (Geikie Reference Geikie1874). It is worth noting, however, that the term interglacial (or ‘inter-glacial’, as distinct from ‘pre-glacial’ and ‘post-glacial’) was often used loosely to denote an interruption of glacial conditions. While some of these deposits would likely be considered ‘interstadials’ today, the fossil remains of others provided clear evidence of the temperate climatic character and considerable duration of interglacial periods.
Croll (Reference Croll1869, p. 344) drew attention to intercalated deposits within glacial drift in Scotland as ‘…bearing decided testimony to the existence of interglacial warm periods’, because he understood the implications for his Physical Theory: ‘…the glacial epoch did not, as has hitherto been generally supposed, consist of one long unbroken period of cold and ice. Neither did it consist, as some have concluded, of two long periods of ice with an intervening mild period, but it must have consisted of a long succession of cold and warm periods’ (Croll Reference Croll1875, p. 236).
In principle, the geological record could provide a test of Croll's Physical Theory: ‘Here we have the grand crucial test of the truth of the foregoing theory of the cause of the glacial epoch. That the glacial epoch should have consisted of a succession of cold and warm periods is utterly inconsistent with all previous theories which have been advanced to account for it. What, then, is the evidence of geology on this subject?’ (Croll Reference Croll1875, p. 237). But Croll (Reference Croll1868, Reference Croll1875) was aware of the limitations of the terrestrial sedimentary sequence to preserve a complete record of glacials and interglacials: ‘It is upon the present land surface that we find the chief evidence of the last glacial epoch, but the traces of the warm periods of that epoch are hardly now to be met with in that position since they have nearly all been obliterated or carried into the sea…In regard to former glacial epochs, however, ice-marked rocks, scratched stones, moraines, till, &c, no longer exist; the land-surfaces of those old times have been utterly swept away.’ (Croll Reference Croll1875, p. 287).
And then, as Imbrie & Imbrie (Reference Imbrie and Imbrie1979) have suggested, he famously appears to be anticipating the advent of palaeoceanographic exploration: ‘The only evidence, therefore, of such ancient glacial epochs, that we can hope to detect, must be sought for in the deposits that were laid down upon the sea-bottom; where also we may expect to find traces of the warm periods that alternated during such epochs with glacial conditions.’ (Croll Reference Croll1875, p. 287).
In fact, Croll was not advocating a research programme in deep-sea sediment sampling, but was juxtaposing the marine and terrestrial geological records to draw attention to the imperfections of the latter, and by extension its inadequacy to test his hypothesis: ‘But our limited knowledge of former glacial epochs must no doubt be attributed chiefly to the actual imperfection of the geological records. So great is this imperfection that the mere absence of direct geological evidence cannot reasonably be regarded as sufficient proof that the conclusions derived from astronomical and physical considerations regarding former ice-periods are improbable.’ (Croll Reference Croll1875, p. 267).
And: ‘Nothing that does not lie buried in the deeper recesses of the ocean will escape complete disintegration and appear imbedded in those formations. It is only those objects which lie in our existing sea-bottoms that will remain as monuments of the glacial epoch of the Post-tertiary period. And, moreover, it will only be those portions of the sea-bottoms that may happen to be upraised into dry land that will be available to the geologist of future ages.’ (Croll Reference Croll1875, p. 271). Thus, was the proper testing of the astronomical theory consigned to remote posterity.
3. The marine record – testbed of astronomical theories
Around the same time, the Royal Society sponsored the Challenger expedition of 1872–76, the first oceanographic expedition of its kind. In addition to investigating the physical conditions of the deep sea and the chemical composition of seawater, the expedition undertook a systematic investigation of deep-sea sediments to examine their physical and chemical character and origin. When the scientific results were eventually published by John Murray, deep sea sediments were described as having either an organic origin, precipitated by organisms, or an inorganic origin, derived from terrestrial and extra-terrestrial sources and products synthesised in the deep sea. While diatom and radiolarian remains were abundant in deposits of the Southern Ocean and of the North Pacific, sediments in temperate and tropical seas above 4000 m depth were dominated by an ooze composed of remains of pelagic Foraminifera (Challenger Expedition 1880–1895). The Challenger results showed that the deep-sea floor was covered by sediments, but obtaining the archives that enabled the testing of the astronomical theory would have to await for technological and scientific developments to fall into place.
The initial sea floor samples of the Challenger expedition were small samples of surface sediment, recovered by means of the sounding instrument. In the early 20th Century, gravity corers were able to obtain continuous sediment cores about 1 m long. Wolfgang Schott analysed the relative abundance of planktic Foraminifera in cores raised by the German Meteor expedition of 1925–27 from the floor of the equatorial Atlantic; he plotted their present-day geographical distribution on the seafloor and found that downcore variations in the abundance of Globorotalia menardii indicated alternations of cold and warm climates (Schott Reference Schott1935). A major development was the invention of the Kullenberg piston corer which allowed the recovery of longer 10–15 m cores and was used on the Swedish deep-sea expedition of the Albatross, 1947–49 (Pettersson Reference Pettersson1948). Cores raised from the Pacific on the Albatross were sent to Gustaf Arrhenius (Svante Arrhenius' grandson) at the Scripps Institution of Oceanography. Arrhenius (Reference Arrhenius1952) showed the presence of cyclical variations in the concentration of calcium carbonate (CaCO3) and suggested that these were related to glacial-interglacial changes in Pacific Ocean circulation. In that same publication, Arrhenius introduced the system of notation, with odd-numbers corresponding to warm stages and even numbers to cold stages, starting with the Holocene as no. 1.
In 1949, Maurice Ewing established the Lamont Geological Observatory of Columbia University as a centre of oceanographic and geophysical research. Recognising the potential of deep-sea cores, Ewing directed its research vessels to raise a piston core every day, irrespective of other research activities, reaching a rate of 200 cores per year (Imbrie & Imbrie Reference Imbrie and Imbrie1979). The Lamont core collection quickly became the largest in the world and provided critical material for reconstructing past climate variability. Using Lamont cores, Ericson & Wollin (Reference Ericson and Wollin1956) produced qualitative estimates of sea surface temperature (SST) variations over several cycles by calculating the relative abundances of planktic foraminifer indicator species that were sensitive to climate changes, such as G. menardii. Radiocarbon dating showed that the most recent cold-to-warm transition in their cores occurred ~11,000 years ago, in line with dating of terrestrial records (Ericson et al. Reference Ericson, Broecker, Kulp and Wollin1956).
While records of faunal variations contributed to the body of evidence on past warm–cold cycles, advances in chemistry would revolutionise the field of palaeoclimate and eventually provide a more rigorous test of astronomical theories. In a lecture on the thermodynamic properties of isotopic substances delivered before the Chemical Society in 1947, Harold Urey proposed to use the temperature dependence of oxygen isotope fractionation in the CO2–H2O–CaCO3 system to determine the temperature of precipitation of CaCO3 by measuring its 18O/16O isotopic composition (Urey Reference Urey1947). In Urey's laboratory at the University of Chicago, Cesare Emiliani applied this approach to the isotopic composition of planktic foraminiferal shells in Caribbean and equatorial Atlantic piston cores from Lamont. He suggested that SSTs varied by ~6°C during glacial–interglacial cycles and used the Arrhenius notation to define what are now called Marine Isotopic Stages (MIS) (Emiliani Reference Emiliani1955). Emiliani was aware that the isotopic composition of carbonate does not only depend on temperature, but also on the isotopic composition of seawater. He therefore applied a small correction (0.4 ‰) to his palaeotemperature equation for glacial samples, representing the enrichment of seawater after extraction of water with the lighter isotope that is then locked in ice sheets. The relative contribution of changes in the isotopic composition of seawater, however, would remain uncertain, until Nick Shackleton, a PhD student at the University of Cambridge, modified a mass spectrometer to analyse much smaller samples with improved precision. This enabled him to measure the δ18O content in much rarer bottom-dwelling benthic Foraminifera, which yielded the same glacial–interglacial isotopic range as planktic Foraminifera from the same samples. Since bottom water temperatures vary little, Shackleton (Reference Shackleton1967) reasoned that variations in oxygen isotope curves do not primarily reflect sea-water temperatures, but rather the extraction of large amounts of water from the oceans during glacial periods. In 1997, John Imbrie spoke about the significance of this development in an interview for the American Institute of Physics:
“[Shackleton] then went to…the Pacific Ocean, took a core, and he went down, let's say a hundred and fifty thousand years with the sediment. And he measured the 18O ratio in the plankton, and he also…measured the 18O ratio of the benthics. Now there's a famous picture in one of his papers [Shackleton & Opdyke Reference Shackleton and Opdyke1973] where he plotted both of these together. And it was that picture that he brought…[to] a lecture to the CLIMAP group and said, look at this. The benthic record [to a] first approximation has exactly the same amplitude of change as the surface one does. So he showed that graph. Right away a cheer goes up from our audience…Because what that shows is that the temperature effect is very small. Because the temperature at the bottom of the Pacific Ocean can't change by more than a degree Centigrade. So that says right away that the basic feature of the [δ]18O record is…an ice volume record”.Footnote 1
A central issue in exploring the presence of astronomical frequencies embedded in marine palaeoclimatic archives was the derivation of a robust chronology. The deep sea represented a stable depositional environment, so to a first approximation the assumption of linear sedimentation rates was not entirely unrealistic. Emiliani (Reference Emiliani1955, Reference Emiliani1972) had derived a timescale for his Caribbean cores by using 14C and 230Th/231Pa measurements for the last 150,000 years and beyond that extrapolation using a constant sedimentation rate or alignment to the 65°N insolation curve. Equatorial Pacific core V28–238 was a gamechanger because it extended beyond the Matuyama/Brunhes (M/B) palaeomagnetic boundary (Fig. 1), which had been independently K-Ar dated on land to 700 ka. Shackleton & Opdyke (Reference Shackleton and Opdyke1973) generated a δ18O record from planktic Foraminifera, showing a regular succession of glacial–interglacial cycles back to MIS 22; they identified the M/B boundary in MIS 19 and used its age to anchor their chronology. Applying a uniform sedimentation rate for the entire core yielded an age of 123 ka for MIS 5e, very close to independent estimates for that interval (Broecker et al. Reference Broecker, Thurber, Goddard, Ku and Matthews1968; Shackleton Reference Shackleton1969). Comparison with Emiliani's Caribbean δ18O records showed that the original timescales beyond 60 ka had been wide of the mark, with the age of MIS 19 underestimated by ~250,000 years (Emiliani & Shackleton Reference Emiliani and Shackleton1974).
Magnetic stratigraphy and oxygen isotopic composition of planktic foraminifer G. sacculifera in core V28–238 (Shackleton & Opdyke Reference Shackleton and Opdyke1973). Marine Isotope Stages (MIS) are indicated.

The scene was finally set for testing the astronomical theory. Hays et al. (Reference Hays, Imbrie and Shackleton1976) selected two high-accumulation and continuous sequences spanning the last 450 kyr in the southern Indian Ocean, whose locations and properties were suited to testing astronomical hypotheses. They derived records of planktic foraminiferal δ18O, SST from radiolarian assemblages and the abundance of a radiolarian species Cycladophora davisiana, reflecting variations in global land ice, subantarctic SST and Antarctic surface water structure, respectively. Spectral analysis revealed that the variance of these records was concentrated in peaks at 100 kyr, 42 kyr and 23–19 kyr. The 42-kyr and 23–19-kyr components had the same period as variations in obliquity and precession, respectively, indicating that the climate system responds quasi-linearly to astronomical forcing. However, the dominant 100-kyr component had a period close to, and in phase with, eccentricity, which, given its very small effect on insolation, was not predicted by astronomical theory and therefore required non-linear responses. Hays et al. (Reference Hays, Imbrie and Shackleton1976, p. 1131) concluded that ‘changes in the Earth's orbital geometry are the fundamental cause of the succession of Quaternary ice ages’, providing support for the Milankovitch hypothesis. Although they did not refer to Croll's theory explicitly, their analyses showed that changes in northern hemisphere ice volume and subantarctic SST were nearly synchronous, and therefore glaciations did not alternate between hemispheres.
4. Astronomical frequencies in marine records
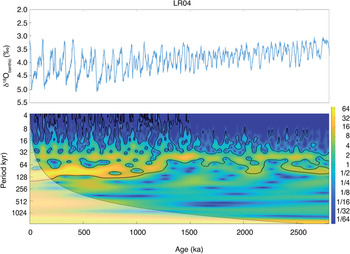
Over time, longer and higher resolution foraminiferal δ18O records were obtained and these were eventually combined to produce composite (Shackleton Reference Shackleton, Vrba, Denton, Partridge and Burckle1995) or stacked records (e.g., Imbrie et al. Reference Imbrie, Hays, Martinson, McIntyre, Mix, Morley, Pisias, Prell, Shackleton, Berger, Imbrie, Hays, Kukla and Saltzman1984; Lisiecki & Raymo Reference Lisiecki and Raymo2005) that were astronomically tuned to derive detailed chronologies spanning the Pleistocene and Pliocene, and eventually reaching to the base of the Cenozoic (Zachos et al. Reference Zachos, Pagani, Sloan, Thomas and Billups2001; Westerhold et al. Reference Westerhold, Marwan, Drury, Liebrand, Agnini, Anagnostou, Barnet, Bohaty, De Vleeschouwer, Florindo, Frederichs, Hodell, Holbourn, Kroon, Lauretano, Littler, Lourens, Lyle, Pälike, Röhl, Tian, Wilkens, Wilson and Zachos2020). Time-series analyses of these records revealed a steadily increasing contribution by obliquity over the last 15 million years (Myr) (Westerhold et al. Reference Westerhold, Marwan, Drury, Liebrand, Agnini, Anagnostou, Barnet, Bohaty, De Vleeschouwer, Florindo, Frederichs, Hodell, Holbourn, Kroon, Lauretano, Littler, Lourens, Lyle, Pälike, Röhl, Tian, Wilkens, Wilson and Zachos2020), underlining the sensitivity of ice sheets to high-latitude insolation changes associated with changes in the Earth's axial inclination. The intensification of northern hemisphere glaciation ~2.8 million years ago (Ma) is marked by an increase in the amplitude of the 41-kyr glacial cycles, without a significant concentration of variance in the precession band (Ruddiman et al. Reference Ruddiman, Raymo and McIntyre1986; Shackleton et al. Reference Shackleton, Hall, Pate, Pisias, Mayer, Janecek and van Andel1995). Between 2.8 and 0.92 Ma, maximum ice volumes ranged between one half and one third of the LGM value, with the first extensive glaciation recorded during MIS 22, around 0.9 Ma (Elderfield et al. Reference Elderfield, Ferretti, Greaves, Crowhurst, McCave, Hodell and Piotrowski2012). A prolongation and intensification of glacial cycles took place over the so-called Middle Pleistocene Transition (MPT, ~1.25–0.70 Ma [Clark et al. Reference Clark, Archer, Pollard, Blum, Rial, Brovkin, Mix, Pisias and Roy2006]), after which δ18O records became dominated by the 100-kyr cycle along with a precession component (Imbrie et al. Reference Imbrie, Hays, Martinson, McIntyre, Mix, Morley, Pisias, Prell, Shackleton, Berger, Imbrie, Hays, Kukla and Saltzman1984; Shackleton et al. Reference Shackleton, Berger and Peltier1990; Lisiecki & Raymo Reference Lisiecki and Raymo2005) (Fig. 2). Dating of Barbados coral terraces representing a series of sea-level highstands also showed precessional changes in ice volume in MIS 5 and 7 (Broecker et al. Reference Broecker, Thurber, Goddard, Ku and Matthews1968; Mesolella et al. Reference Mesolella, Matthews, Broecker and Thurber1969).
Oxygen isotope composition of benthic Foraminifera in the LR04 stack (Lisiecki & Raymo Reference Lisiecki and Raymo2005) (upper panel) and its continuous wavelet power spectrum (lower panel). Colour scale represents the relative wavelet power and the thick black contour designates the 5 % significance level against red noise (Grinsted et al. Reference Grinsted, Moore and Jevrejeva2004).

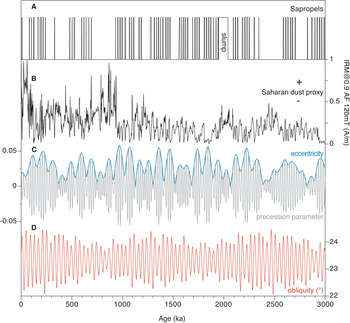
Milankovitch had suggested that precession would dominate climate variability at low latitudes. Lithological changes in Atlantic, Arabian Sea and Mediterranean Sea cores have indeed revealed that aeolian dust deposition varied at the 23–19-kyr period before 2.8 Ma, reflecting the influence of precession on monsoonal precipitation (Larassoaña et al. Reference Larrasoaña, Roberts, Rohling, Winklhofer and Wehausen2003; deMenocal Reference deMenocal2004). After 2.8 Ma variability in the dust record shifted to the 41-kyr period and after 1 Ma to the 100-kyr period, indicating a coupling of high- and low-latitude climates. However, precession remained a fundamental driver of African climate variability throughout the Quaternary (deMenocal Reference deMenocal2004). In addition, marine records from deep-sea cores and exposed sections on land in the Mediterranean spanning the last 13.5 Myr, also show the effects of precession on the quasi-periodic deposition of organic-rich sapropel layers as a result of increased surface water freshening, reduced deep water ventilation and increased export production (e.g., Rossignol-Strick et al. Reference Rossignol-Strick, Nesteroff, Olive and Vergnaud-Grazzini1982; Hilgen et al. Reference Hilgen, Hinnov, Abdul Aziz, Abels, Batenburg, Bosmans, de Boer, Hüsing, Kuiper, Lourens, Rivera, Tuenter, Van de Wal, Wotzlaw, Zeeden, Smith, Bailey, Burgess and Fraser2015; Rohling et al. Reference Rohling, Marino and Grant2015). Sapropels are associated with precession minima and boreal insolation maxima, leading to the intensification of the African monsoon, northward penetration of the rain belt beyond the central Saharan watershed at ~21°N, and increased freshwater input into the Mediterranean Sea via northward draining catchments and the Nile (Rohling et al. Reference Rohling, Marino and Grant2015). In addition to precession, complex orbital effects are detected in the character of sapropels, with small- and large-scale bundles of sapropels corresponding to maxima in the 100-kyr and 400-kyr eccentricity cycles (Larrasoaña et al. Reference Larrasoaña, Roberts, Rohling, Winklhofer and Wehausen2003), while sapropel thickness appears to be related to obliquity, with thick (thin) sapropels corresponding to obliquity maxima (minima) (Lourens et al. Reference Lourens, Antonarakou, Hilgen, Van Hoof, Vergnaud-Grazzini and Zachariasse1996). Figure 3 shows the relationship between sapropel occurrence and astronomical parameters and its antiphase relation with Saharan dust deposition at ODP Site 967 SW in the eastern Mediterranean.
Occurrence of sapropels and Saharan dust at ODP Site 967, eastern Mediterranean, in relation to changes in astronomical parameters. (a) position of sapropels in ODP Site 967 (Kroon et al. Reference Kroon, Alexander, Little, Lourens, Matthewson, Robertson, Sakamoto, Robertson, Emeis, Richter and Camerlanghi1998). (b) variations in IRM0.9 T@AF120 mT in ODP Site 967, indicating changes in haematite concentration as a proxy for Saharan dust supply (Larrasoaña et al. Reference Larrasoaña, Roberts, Rohling, Winklhofer and Wehausen2003). (c) variations in eccentricity and precessional parameter (Laskar et al. Reference Laskar, Robutel, Joutel, Gastineau, Correia and Levrard2004); (d) variations in obliquity (Laskar et al. Reference Laskar, Robutel, Joutel, Gastineau, Correia and Levrard2004).

5. Astronomical frequencies in terrestrial records
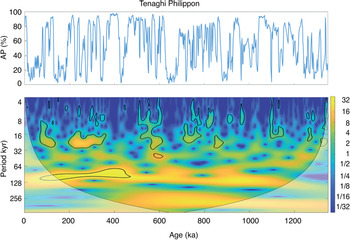
In principle, Croll was correct that evidence of past glacial–interglacial cycles would not be recovered from land surfaces where erosion or intermittent deposition predominate. But in places beyond glaciated terrains or continuous permafrost areas, favourable geological contexts have occasionally led to the uninterrupted deposition of sediment sequences that have gradually provided a picture of changes on land over long timescales. The first terrestrial sequences extending continuously from present over multiple glacial-interglacial cycles were pollen records obtained in the 1960s and 1970s from the Bogotá basin, Colombia (Van der Hammen & González Reference Van der Hammen and González1960; Van der Hammen Reference Van der Hammen1974) and the Tenaghi Philippon fen, Greece (Wijmstra Reference Wijmstra1969; Wijmstra & Smit Reference Wijmstra and Smit1976), and loess records from central Europe (e.g., Kukla Reference Kukla1977). The pollen records from Bogotá and Tenaghi Philippon were later extended to cover the last 2.2 Myr (Hooghiemstra Reference Hooghiemstra1984; Hooghiemstra et al. Reference Hooghiemstra, Melice, Berger and Shackleton1993; Torres et al. Reference Torres, Hooghiemstra, Lourens and Tzedakis2013) and 1.35 Myr (Wijmstra & Groenhart Reference Wijmstra and Groenhart1983; van der Wiel & Wijmstra Reference van der Wiel and Wijmstra1987a, Reference van der Wiel and Wijmstrab; Tzedakis et al. Reference Tzedakis, Hooghiemstra and Pälike2006), respectively. Gradually, a number of long pollen sequences emerged from southern Europe, showing expansions and contractions of forest communities associated with variations in ice volume, although glacial-interglacial transitions in the marine and terrestrial records were not always synchronous (Tzedakis et al. Reference Tzedakis, Andrieu, de Beaulieu, Crowhurst, Follieri, Hooghiemstra, Magri, Reille, Sadori, Shackleton and Wijmstra1997, Reference Tzedakis, Roucoux, de Abreu and Shackleton2004; Shackleton et al. Reference Shackleton, Sánchez Goñi, Pailler and Lancelot2003). These records also revealed recurring patterns of characteristic vegetation communities associated with specific astronomical configurations: expansion of Mediterranean sclerophylls, expansion of heathland vegetation and collapse of forest communities at times of boreal summer solstice, vernal equinox and winter solstice at perihelion, respectively (Magri & Tzedakis Reference Magri and Tzedakis2000; Margari et al. Reference Margari, Skinner, Hodell, Martrat, Toucanne, Grimalt, Gibbard, Lunkka and Tzedakis2014). Analyses of the spectral evolution in pollen records from Bogotá basin (Torres et al. Reference Torres, Hooghiemstra, Lourens and Tzedakis2013), Tenaghi Philippon (Tzedakis et al. Reference Tzedakis, Hooghiemstra and Pälike2006; Fig. 4), Lake Ohrid, Albania/FYROM (Wagner et al. Reference Wagner, Vogel, Francke, Friedrich, Donders, Lacey, Leng, Regattieri, Sadori, Wilke, Zanchetta, Albrecht, Bertini, Combourieu-Nebout, Cvetkoska, Giaccio, Grazhdani, Hauffe, Holtvoeth, Joannin, Jovanovska, Just, Kouli, Kousis, Koutsodendris, Krastel, Leicher, Levkov, Lindhorst, Masi, Melles, Mercuri, Nomade, Nowaczyk, Panagiotopoulos, Peyron, Reed, Sagnotti, Sinopoli, Stelbrink, Sulpizio, Timmermann, Tofilovska, Torri, Wagner-Cremer, Wonik and Zhang2019) and Heqing basin, SW China (An et al. Reference An, Clemens, Shen, Qiang, Jin, Sun, Prell, Luo, Wang, Xu, Cai, Zhou, Liu, Liu, Shi, Yan, Xiao, Chang, Wu, Ai and Lu2011) show a shift from 41-kyr cyclicity to 100-kyr cyclicity during the MPT, reflecting high-latitude effects. However, clusters of precession cycles appear throughout the entire interval covered in these records, reflecting the effect of local insolation changes on moisture availability (see for example Fig. 4). Speleothem records from China also indicate the pervasive influence of precession on the intensity of the Asian Monsoon during the last 640 kyr (Cheng et al. Reference Cheng, Edwards, Sinha, Spötl, Yi, Chen, Kelly, Kathayat, Wang, Li, Kong, Wang, Ning and Zhang2016). What emerges is that although high-latitude effects were superimposed on low- to mid-latitude climate variability, precession remained a fundamental driver of precipitation and vegetation changes during the course of the Quaternary.
Arboreal pollen (AP) percentages in the Tenaghi Philippon record, Greece (Tzedakis et al. Reference Tzedakis, Hooghiemstra and Pälike2006) (upper panel) and its continuous wavelet power spectrum (lower panel). Colour scale represents the relative wavelet power and the thick black contour designates the 5 % significance level against red noise (Grinsted et al. Reference Grinsted, Moore and Jevrejeva2004).

Analyses of pollen and sediment records from Zoige Basin, eastern Tibetan Plateau (Zhao et al. Reference Zhao, Tzedakis, Li, Qin, Cui, Liang, Birks, Liu, Zhang, Ge, Zhao, Felde, Deng, Cai, Li, Ren, Wei, Yang, Zhang and Guo2020), show shifts in the dominant periodicity, from precession cycles (1.74–1.54 Ma), to precession and obliquity cycles (1.54–0.62 Ma) and finally 100-kyr cycles (0.64–0 Ma). On the other hand, Chinese loess records show only one major transition at ~0.9–0.7 Ma from ~40-kyr to ~100-kyr cycles (e.g., Guo et al. Reference Guo, Biscaye, Wei, Chen, Peng and Liu2000; Ding et al. Reference Ding, Derbyshire, Yang, Yu, Xiong and Liu2002). At higher latitudes, changes in the abundance of biogenic silica in lake Baikal over the last 1.8 Myr (Prokopenko et al. Reference Prokopenko, Hinnov, Williams and Kuzminc2006), and sediment grain size in lake El'gygytgyn, Far East Russian Arctic over the last 2.6 Myr (Francke et al. Reference Francke, Wennrich, Sauerbrey, Juschus, Melles and Brigham-Grette2013), show cyclicities in all three astronomical components, with a shift from 41-kyr to 100-kyr cyclicity during the MPT. As in lower latitudes, these records reflect the influence of glacial cycles, but the presence of precession cycles indicates the effect of local insolation changes.
6. Astronomical frequencies in ice core records
Croll could certainly not have envisaged that the remaining ice sheets on Earth would also provide evidence about the climate, and especially provide a means of linking geochemical and astronomical theories.
While the first shallow cores were drilled in the 1950s (Jouzel Reference Jouzel2013), the potential of ice cores to address questions of climate on the timescales of astronomical frequencies had to wait for a series of technical and scientific breakthroughs. The scientific advances include the establishment of water isotopes (δ18O and δD) as a proxy for temperature (Dansgaard Reference Dansgaard1964), and the development of an ability to measure correctly the concentration of CO2 in air bubbles within the ice (Delmas et al. Reference Delmas, Ascencio and Legrand1980). The technical advances led to the ability to drill to the bottom of the Greenland and Antarctic ice sheets, initially at Camp Century (Greenland) (Hansen & Langway Reference Hansen and Langway1966) where a 1366-m core was completed in 1966 and then at Byrd Station (Antarctica) where the bed at 2164 m was reached in 1968 (Gow et al. Reference Gow, Ueda and Garfield1968).
However, even these cores were not enough to penetrate a complete glacial cycle. Only with the Vostok record (Lorius et al. Reference Lorius, Jouzel, Ritz, Merlivat, Barkov, Korotkevich and Kotlyakov1985), eventually reaching 420 ka (Petit et al. Reference Petit, Jouzel, Raynaud, Barkov, Barnola, Basile, Bender, Chappellaz, Davis, Delaygue, Delmotte, Kotlyakov, Legrand, Lipenkov, Lorius, Pepin, Ritz, Saltzman and Stievenard1999), did it become possible to consider several glacial cycles in ice cores, and to assess their frequency content. Such work remains confined to Antarctica, because the oldest reliable Greenland ice core record still only reaches 128 ka (NEEM Community Members 2013). In Antarctica, cores drilled at Dome C (EPICA Community Members 2004; Jouzel et al. Reference Jouzel, Masson-Delmotte, Cattani, Dreyfus, Falourd, Hoffmann, Nouet, Barnola, Chappellaz, Fischer, Gallet, Johnsen, Leuenberger, Loulergue, Luethi, Oerter, Parrenin, Raisbeck, Raynaud, Schwander, Spahni, Souchez, Selmo, Schilt, Steffensen, Stenni, Stauffer, Stocker, Tison, Werner and Wolff2007) and Dome Fuji (Kawamura et al. Reference Kawamura, Parrenin, Lisiecki, Uemura, Vimeux, Severinghaus, Hutterli, Nakazawa, Aoki, Jouzel, Raymo, Matsumoto, Nakata, Motoyama, Fujita, Azuma, Fujii and Watanabe2007; Dome Fuji Ice Core Project Members Reference Kawamura, Abe-Ouchi, Motoyama, Ageta, Aoki, Azuma, Fujii, Fujita, Fujita, Fukui, Furukawa, Furusaki, Goto-Azuma, Greve, Hirabayashi, Hondoh, Hori, Horikawa, Horiuchi, Igarashi, Iizuka, Kameda, Kanda, Kohno, Kuramoto, Matsushi, Miyahara, Miyake, Miyamoto, Nagashima, Nakayama, Nakazawa, Nakazawa, Nishio, Obinata, Ohgaito, Oka, Okuno, Okuyama, Oyabu, Parrenin, Pattyn, Saito, Saito, Saito, Sakurai, Sasa, Seddik, Shibata, Shinbori, Suzuki, Suzuki, Takahashi, Takahashi, Takahashi, Takata, Tanaka, Uemura, Watanabe, Watanabe, Yamasaki, Yokoyama, Yoshimori and Yoshimoto2017) have extended beyond the age of the Vostok core. Because the pattern of glacial–interglacial change seems to be close to uniform across the East Antarctic plateau and CO2 is well mixed in the atmosphere, we can use these three cores interchangeably to discuss the imprint of astronomical cycles on local and global climate.
Analysis of the record extending to MIS 11 in the Vostok core showed that the signature of water isotopes in the ice (interpreted as a proxy for temperature at Vostok) has strong power in the 100-kyr and 41-kyr bands, but little in the precessional bands (Petit et al. Reference Petit, Jouzel, Raynaud, Barkov, Barnola, Basile, Bender, Chappellaz, Davis, Delaygue, Delmotte, Kotlyakov, Legrand, Lipenkov, Lorius, Pepin, Ritz, Saltzman and Stievenard1999). Some caution must be used in assessing this result because the timescale (based on glaciological modelling and named GT4) derived in that work has been superseded by better age models that are constrained by absolute dating ties. Nonetheless, it is noteworthy that the Vostok record (Petit et al. Reference Petit, Jouzel, Raynaud, Barkov, Barnola, Basile, Bender, Chappellaz, Davis, Delaygue, Delmotte, Kotlyakov, Legrand, Lipenkov, Lorius, Pepin, Ritz, Saltzman and Stievenard1999) allowed an assessment for the first time of the frequency content of the CO2 concentration. This has the same frequencies, but with an even larger proportion of variance concentrated in the 100-kyr band, reflecting the role of CO2 as a key amplifier of the glacial-interglacial climate changes. The role of CO2 helps to explain why glacial cycles are in phase across the hemispheres, because CO2 acts globally as a radiative forcing agent. A final noteworthy observation from the Vostok record was that δ18Oatm (the isotopic ratio of oxygen in air bubbles), a signal that is particularly affected by low latitude terrestrial productivity, shows a strong precessional frequency. In detail, δ18Oatm closely mirrors (but with a phase lag) mid-June northern hemisphere insolation, providing both evidence of the role of insolation on tropical climate, and a useful tool that was later used to provide fixed tie-points for dating ice cores.
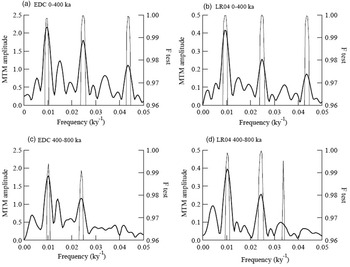
The 800-kyr record of EPICA Dome C (Jouzel et al. Reference Jouzel, Masson-Delmotte, Cattani, Dreyfus, Falourd, Hoffmann, Nouet, Barnola, Chappellaz, Fischer, Gallet, Johnsen, Leuenberger, Loulergue, Luethi, Oerter, Parrenin, Raisbeck, Raynaud, Schwander, Spahni, Souchez, Selmo, Schilt, Steffensen, Stenni, Stauffer, Stocker, Tison, Werner and Wolff2007) has a much improved age model, in particular constrained by the 10Be signal that marks the Matuyama–Brunhes boundary at ~780 ka (Raisbeck et al. Reference Raisbeck, Yiou, Cattani and Jouzel2006). Spectral analysis of the temperature proxy confirms that the dominance of the 100- and 41-kyr periods extends back to 800 ka. However, in contrast to what was deduced from Vostok, there is some power in the precessional band from 0 to 400 ka, though it is not observed between 400 and 800 ka (Fig. 5). Methane records also exhibit 100-kyr, 41-kyr and 23-kyr frequencies throughout the 800-kyr record (Loulergue et al. Reference Loulergue, Schilt, Spahni, Masson-Delmotte, Blunier, Lemieux, Barnola, Raynaud, Stocker and Chappellaz2008).
Power spectra for 0–400 ka (upper panels) and 400–800 ka (lower panels) for Antarctic temperature at Dome C (Jouzel et al. Reference Jouzel, Masson-Delmotte, Cattani, Dreyfus, Falourd, Hoffmann, Nouet, Barnola, Chappellaz, Fischer, Gallet, Johnsen, Leuenberger, Loulergue, Luethi, Oerter, Parrenin, Raisbeck, Raynaud, Schwander, Spahni, Souchez, Selmo, Schilt, Steffensen, Stenni, Stauffer, Stocker, Tison, Werner and Wolff2007) (left panels) and for the benthic oxygen isotope LR04 stack (Lisiecki & Raymo Reference Lisiecki and Raymo2005) (right panels). Site temperature (T s) is calculated from δD measured on the EPICA Dome C ice core. The thick lines are the power spectrum amplitudes calculated using the multi-taper method (MTM). The thin lines show the significance of peaks at particular frequencies estimated from an F-test. Both records show clear power at ~100 kyr and 40 kyr. The 20-kyr period is significant only in the most recent 400 ka. From Jouzel et al. Reference Jouzel, Masson-Delmotte, Cattani, Dreyfus, Falourd, Hoffmann, Nouet, Barnola, Chappellaz, Fischer, Gallet, Johnsen, Leuenberger, Loulergue, Luethi, Oerter, Parrenin, Raisbeck, Raynaud, Schwander, Spahni, Souchez, Selmo, Schilt, Steffensen, Stenni, Stauffer, Stocker, Tison, Werner and Wolff2007. Orbital and millennial Antarctic climate variability over the last 800,000 years. Science 317, 793–796. Reprinted with permission from AAAS.

A final interesting finding specific to the local climate in Antarctica is the existence of cycles in the ratio of O2/N2 in the air trapped in ice in Antarctica (Kawamura et al. Reference Kawamura, Parrenin, Lisiecki, Uemura, Vimeux, Severinghaus, Hutterli, Nakazawa, Aoki, Jouzel, Raymo, Matsumoto, Nakata, Motoyama, Fujita, Azuma, Fujii and Watanabe2007). This ratio shows a strong resemblance to local summer insolation at the Antarctic site (such as Dome Fuji). This is believed to arise from the effect of insolation on snow structure at the surface that later influences the amplitude of a small fractionation between oxygen and nitrogen that occurs during the bubble closure process. Again, this can be used to aid in dating cores but it also provides another demonstration that astronomically forced variability is imprinted in a variety of climate indicators.
The ice core record clearly exhibits similar frequencies to the marine record. However, it adds to the story by showing directly the influence on polar temperatures, and that the astronomical frequencies are passed to climate not only directly but also through the amplifying effect of greenhouse gases.
7. Croll in the context of the modern synthesis of a theory of ice ages
As Croll predicted, testing of the astronomical theory would require long and undisturbed archives, though his own version of the theory has not fared well under the weight of accumulating evidence. Glaciations do not only occur when eccentricity is high, they do not alternate between hemispheres every ~11 kyr and the critical season for the initiation of glaciation is not winter, but summer. Drawing attention to the flaws of early theories from today's vantage point may be regarded as the epitome of bad taste, but it is of interest to explore how different aspects of Croll's theory fit in the context of the modern theory of ice ages.
The ‘heroic’ age of palaeoclimate research (~1950–2000) and subsequent attempts to develop a synthesis have transformed our understanding of the nature of glacial cycles. In the Early Pleistocene, deglaciations occurred every 41 kyr and climate resided mostly in an interglacial state. Over the course of the MPT, secular cooling or a change in ice dynamics led to a rise in the deglaciation threshold, a decrease in the frequency of interglacials after 1 Ma and the emergence of the 100-kyr glacial cycle (e.g., Berger et al. Reference Berger, Li and Loutre1999; Clark et al. Reference Clark, Archer, Pollard, Blum, Rial, Brovkin, Mix, Pisias and Roy2006; Tzedakis et al. Reference Tzedakis, Crucifix, Mitsui and Wolff2017), though the temporal spacing of deglaciations is not always 100 kyr (Past Interglacial Working Group of PAGES 2016). The distinction between the more symmetric cycles of the ‘41-kyr world’ of the Early Pleistocene and the more saw toothed-shaped cycles of the ‘100-kyr world’ in the Middle and Late Pleistocene is thought to reflect a difference between a quasi-linear and a strongly nonlinear climate–cryosphere response to the same astronomical forcing, respectively. Although there is no consensus on the origin and mechanism of the 100-kyr cycle, a key element appears to be the critical size of ice sheets in triggering deglaciations (e.g., Raymo Reference Raymo1997; Paillard Reference Paillard1998; Tzedakis et al. Reference Tzedakis, Crucifix, Mitsui and Wolff2017). Over time the glacial system accumulates instability (MayAyeal Reference MacAyeal1979) that makes ice sheets more sensitive to insolation increases as a result of (i) ice-sheet physics and glacio-isostatic adjustments (e.g., Birchfield et al. Reference Birchfield, Weertman and Lunde1981; Abe-Ouchi et al. Reference Abe-Ouchi, Saito, Kawamura, Raymo, Okuno, Takahashi and Blatter2013); (ii) dust deposition and changes in ice-sheet albedo (Ganopolski & Calov Reference Ganopolski and Calov2011); (iii) extent of Antarctic ice sheet, bottom-water formation and ocean carbon storage (Paillard & Parrenin Reference Paillard and Parrenin2004). In addition, during glacial terminations the interaction of orbital and millennial-scale climate variability may promote deglaciation via the operation of the bipolar seesaw, whereby weakening of the meridional overturning circulation leads to changes in interhemispheric heat transport and CO2 degassing from the Southern Ocean (e.g., Paillard Reference Paillard2001; Barker et al. Reference Barker, Knorr, Edwards, Parrenin, Putnam, Skinner, Wolff and Ziegler2011). In this context, Croll's recognition of the crucial role of changes in the transference of heat by ocean currents remains relevant to the present day.
By comparison to the 100-kyr world, the Early Pleistocene of smaller ice sheets and reduced non-linearity provides a simpler testbed for understanding the response of the climate system to astronomical forcing. Before 1 Ma, interglacials occurred every time the amount of energy reaching northern high latitudes exceeded a simple threshold, approximately every 41 kyr (Huybers Reference Huybers2006; Tzedakis et al. Reference Tzedakis, Crucifix, Mitsui and Wolff2017). Near 65°N, the variance of the caloric summer half year insolation has almost equal contributions from precession and obliquity and insolation peaks are spaced every ~21 kyr, yet deglaciations skipped nearly every other insolation peak in the Early Pleistocene (the so-called ‘41-kyr problem’ of Raymo & Nisancioglu Reference Raymo and Nisancioglu2003). The simplest explanation is that the 41-kyr glacial cycle arises because every second insolation peak is boosted by above-average obliquity (Tzedakis et al. Reference Tzedakis, Crucifix, Mitsui and Wolff2017).
Raymo et al. (Reference Raymo, Lisiecki and Nisancioglu2006), however, proposed that in the Early Pleistocene ice volume changes occurred not only in the northern hemisphere, but also in the southern hemisphere, where a land-based East Antarctic ice sheet with melting margins was contributing to sea-level changes. Since precession is out of phase between hemispheres but obliquity is in phase, the contribution of each hemisphere to ice-volume variations cancelled each other in the globally integrated benthic δ18O record for the 21-kyr cycle, but were additive for the 41-kyr cycle. In essence, the possibility of additional ‘cryptic’ ice volume variations occurring on precessional timescales represents a ‘Croll–Murphy’ model of alternating glaciations between hemispheres every ~11 kyr when summer solstice is at aphelion.
Recent analysis of high-resolution benthic records (Liautaud et al. Reference Liautaud, Hodell and Huybers2020), however, has revealed a larger precession contribution in ice volume variance in the Early Pleistocene than previously recognised, which steadily increases over the course of the Quaternary. If anti-phased precessional variations in ice volume did occur in the earliest Pleistocene in the mode of Raymo et al. (Reference Raymo, Lisiecki and Nisancioglu2006), then the gradual increase in the amplitude of precession might reflect the expansion of northern hemisphere ice-sheets and a growing imbalance in northern and southern contributions to sea level, such that they would no longer cancel each other in the benthic δ18O record (Liautaud et al. Reference Liautaud, Hodell and Huybers2020). Alternatively, the steady intensification of the precession signal through the Quaternary simply reflects the gradual southward extension of northern hemisphere ice-sheet margins to lower latitudes, where the influence of precessional insolation changes is stronger (Liautaud et al. Reference Liautaud, Hodell and Huybers2020).
On a more abstract level, Paillard (Reference Paillard2015) noted that the Milankovitch theory is a theory of ice sheets where astronomical changes lead to changes in ice sheets, which in turn drive global climate changes via the albedo effect; the geochemical theory, on the other hand, is a theory of climate, where changes in CO2 concentration and climate drive ice volume changes. In this context, Croll's Physical Theory of Secular Changes of Climate, would probably lie somewhere in between, with climate feedbacks playing a central role in amplifying small variations in insolation and driving ice volume changes. In many ways, it is this aspect of Croll's theory that has contributed to his enduring legacy.
Acknowledgements
We thank Simon Crowhurst for wavelet analyses and assistance with figures and Richard Preece for discussions. We are grateful to John Lowe and James Scourse for their insightful reviews and guidance. Finally, we are indebted to Kevin Edwards for the invitation to contribute to this Croll volume, commemorating the life and work of an extraordinary individual.