Introduction
The wheat curl mite (WCM), Aceria tosichella Keifer, is an eriophyoid pest in cereals that has been implicated as the primary vector of numerous pathogens, including wheat streak mosaic virus (WSMV), wheat spot mosaic virus, wheat spot chlorosis pathogen, cereal spotting, triticum mosaic virus and high plains virus (HPV) (Slykhuis, Nault & Styer, 1969; Reference Slykhuis1956; Borodina et al., Reference Borodina, Sukhareva, Shtein-Margolina, Evgrafova and Krylov1982; Seifers et al., Reference Seifers, Harvey, Martin and Jensen1997, Reference Seifers, Martin, Harvey, Fellers and Michaudm2009). WCM generally cause little crop damage in the field through direct feeding (Harvey et al., Reference Harvey, Martin and Seifers2000, Reference Harvey, Martin and Seifers2002); however, the viruses WCM are capable of transmitting can have major impacts on crop yields. WSMV (Potyviridae: Tritimovirus) is a particularly damaging viral pathogen affecting cropping regions of the Americas, northern Africa, Asia, Europe and Australia. Yields of wheat and, to a lesser extent, other cereals, such as barley, oats, millet and rye, can be greatly reduced, whereby infected plants fail to grow or produce viable seed and often die prematurely (Staples & Allington, Reference Staples and Allington1956; Atkinson & Grant, Reference Atkinson and Grant1967; Sanchez-Sanchez et al., Reference Sanchez-Sanchez, Henry, Cardenas-Soriano and Alvizo-Villasana2001; Lanoiselet et al., Reference Lanoiselet, Hind-Lanoiselet and Murray2008). In the Great Plains region of North America, WSMV is responsible for annual yield losses of approximately 5%, with localised areas suffering complete loss of yield in severe cases. Annual economic losses have amounted to costs of more than US$100 million in the state of Kansas alone (Christian & Willis, Reference Christian and Willis1993; French & Stenger, Reference French and Stenger2003; Appel et al., Reference Appel, Bowden, Bockus and Jardine2006).
Management of WCM and associated viruses is complicated by the ability of mites to inhabit and potentially colonise more than 60 alternate host plants other than their primary host wheat (Slykhuis, Reference Slykhuis1955; Connin, Reference Connin1956; Somsen & Sill Jr., Reference Somsen and Sill1970; Harvey et al., Reference Harvey, Seifers and Martin2001; Skoracka & Kuczynski, Reference Skoracka, Kuczynski, Gabrys and Ignatowicz2006; Carew et al., Reference Carew, Schiffer, Umina, Weeks and Hoffmann2009). Infected host plants provide an effective ‘green bridge’ refuge for WCM outside growing seasons, and a potential source of re-infestation and spread of viruses to successive wheat crops (Thomas & Hein, Reference Thomas and Hein2003; Jiang et al., Reference Jiang, Garrett, Peterson, Harvey, Bowden and Fang2005; Coutts et al., Reference Coutts, Strickland, Kehoe, Severtson and Jones2008). Additionally, WCM are highly fecund and population sizes can expand rapidly given optimal climatic conditions (Slykhuis, Reference Slykhuis1956; Orlob, Reference Orlob1966). Warm and humid conditions favour mite population growth; and, therefore, early sown winter crops are at greatest risk of mite infestations and virus infection (Nyvall, Reference Nyvall1999). Despite efforts to develop WCM and WSMV resistant wheat cultivars (Harvey et al., Reference Harvey, Seifers, Martin, Brown-Guedira and Gill1999; Thomas et al., Reference Thomas, Conner and Graf2004), primary management of WCM vectored viruses focuses on reducing numbers of WCM through the control of volunteer wheat and alternate plant hosts (Bowden et al., Reference Bowden, Brooks, Peterson and Shroyer1991; Jiang et al., Reference Jiang, Garrett, Peterson, Harvey, Bowden and Fang2005) and sowing crops when conditions are less favourable for mite population growth (Nyvall, Reference Nyvall1999).
Aceria tosichella is exotic to Australia and the timing of its introduction is unknown (Frost, Reference Frost1995; Halliday & Knihinicki, Reference Halliday and Knihinicki2004). It is currently recognized as an emerging threat to the grains industry following WSMV outbreaks in recent years. Isolated cases of WSMV were first confirmed in eastern Australia in 2003 (Ellis et al., Reference Ellis, Rebetzke and Chu2003a,Reference Ellis, Rebetzke, Mago and Chub), with genetic studies suggesting a single incursion of infected seed from the Pacific Northwest of the United States being responsible for its introduction (Dwyer et al., Reference Dwyer, Gibbs, Gibbs and Jones2007). Subsequently, cropping regions of New South Wales (NSW) and Western Australia (WA) in 2005 and 2006, respectively, suffered severe outbreaks, with many crops sustaining complete loss of yield (Murray & Wratten, Reference Murray and Wratten2005; Murray, Reference Murray2006). To date, detections of WSMV have been confirmed in all states and territories of Australia, except the Northern Territory, and it is now evident that the entire Australian wheat belt is at risk of WSMV infections (Carew et al., Reference Carew, Goodisman and Hoffmann2004; Coutts et al., Reference Coutts, Strickland, Kehoe, Severtson and Jones2008). Given the increasing prevalence and spread of WSMV in Australia, there is a need to understand the biology, ecology and genetics of WCM in order to devise effective control strategies for WCM and associated cereal pathogens.
Aceria tosichella belongs to the super family Eriophyoidae and is considered the principal Aceria species on cereal hosts (Amrine & Stansy, Reference Amrine and Stansy1994; Frost & Ridland, Reference Frost, Ridland, Lindquist, Sabelis and Bruin1996). Despite an unconfirmed report of WCM reproducing completely by parthenogenesis (Slykhuis, Reference Slykhuis1976), it is likely that WCM reproduce by arrhenotokous parthenogenesis (haplodiploidy), the proposed ancestral mode of reproduction in the Eriophyoidae (Helle & Wysoki, Reference Helle and Wysoki1983; Oldfield et al., Reference Oldfield, Hobza and Wilson1970; Sternlicht & Goldenberg, Reference Sternlicht and Goldenberg1971). WCM are approximately 200 micron in length and typically complete a life cycle in 8–10 days, with females capable of laying 12–20 eggs in their lifetime (Staples & Allington, Reference Staples and Allington1956; del Rosario & Sill, Reference del Rosario and Sill1958). Under ideal conditions, a single female can produce more than 3 million descendants within 60 days. Both immature and adult WCM transmit WSMV (Slykhuis, Reference Slykhuis1955; Orlob, Reference Orlob1966). To become viruliferous, the virus must be acquired by WCM during either of the two nymphal stages, typically after at least 15–30 min of feeding on infected plant material. Once infected, the mite has the potential to transmit the virus for at least seven days (Slykhuis, Reference Slykhuis1955; del Rosario & Sill, Reference del Rosario and Sill1965; Orlob, Reference Orlob1966). Mite movement is thought to be extensive, with dispersal primarily facilitated by wind currents (Slykhuis, Reference Slykhuis1955; Sabelis & Bruin, Reference Helle, Wysoki, Lindquist, Sabelis and Bruin1996; Coutts et al., Reference Coutts, Strickland, Kehoe, Severtson and Jones2008).
In Australia, two distinct genetic lineages of WCM, likely representing different species, have been described based on DNA sequence analysis of one mitochondrial gene and two nuclear markers (Carew et al., Reference Carew, Schiffer, Umina, Weeks and Hoffmann2009). These lineages appear to occupy similar distributions, occurring throughout the entire Australian wheat belt, and are often found in sympatry. Laboratory experiments also suggest that these lineages differ in their ability to transmit WSMV, with only one lineage transmitting WSMV under controlled conditions (Schiffer et al., Reference Schiffer, Umina, Carew, Hoffmann, Rodoni and Miller2009). This pattern of association also appears to be consistent with field observations, whereby one lineage is generally dominant at WSMV infected sites (Schiffer et al., Reference Schiffer, Umina, Carew, Hoffmann, Rodoni and Miller2009). Climate modeling suggests that tolerance to heat and desiccation limit the distribution of WCM in Australia; and climatic conditions for most of south-eastern Australia, stretching beyond the margins of the wheat belt, are likely highly favourable for WCM population growth (Schiffer et al., Reference Schiffer, Umina, Carew, Hoffmann, Rodoni and Miller2009).
These findings can inform the development of effective management strategies in Australia. Firstly, the identification of a potential species complex has significant implications for pest control. Cryptic species often differ in their biology and ecology (Mathys, Reference Mathys1957; Anderson & Morgan, Reference Anderson and Morgan1958; Helle & Sabelis, Reference Helle and Sabelis1985), and control strategies need to accommodate these differences, as has been observed in the control of blue oat mites, Penthaleus spp., in Australia (Umina & Hoffmann, Reference Umina and Hoffmann1999; Weeks & Hoffmann, Reference Weeks and Hoffmann1999; Robinson & Hoffmann, Reference Robinson and Hoffmann2000). Secondly, the observed patterns of WSMV transmission suggest that WCM and WSMV management strategies in the future may need only focus on a single lineage, although we suggest that additional research is needed to determine WSMV isolate and WCM population vector competency effects on patterns of transmission. Finally, climate modeling, coupled with reports of a suite of likely alternate host plant species (Carew et al., 2008), highlight the possibility that WCM have a broader species distribution in eastern Australia than currently assumed. The potential for seasonal recruitment of WCM into the wheat-growing regions from these areas will depend on actual species distribution limits and WCM dispersal potential.
In this study, we extend the findings of Carew et al. (2008) and Schiffer et al. (Reference Schiffer, Umina, Carew, Hoffmann, Rodoni and Miller2009) by conducting a population genetic assessment of A. toshichella in Australia, focusing on the lineage so far proven capable of vectoring WSMV, referred to as WCM2 by Schiffer et al. (Reference Schiffer, Umina, Carew, Hoffmann, Rodoni and Miller2009). We developed a microsatellite marker library and assessed allele frequencies across loci to investigate patterns of gene flow and population structure in the Australian wheat belt. Multilocus genotypes within individuals and across populations were also investigated for characteristic features reflecting parthenogenetic or arrhenotokous parthenogenetic modes of reproduction. The study highlights the dispersal and colonization potential of the species and provides a spatial framework for the management of WCM and associated cereal pathogens in Australia.
Methods and materials
Mite collections
Eriophyoid mites were collected from 16 sites during late spring to early summer of 2005 and 2006, encompassing all major wheat growing regions of mainland Australia (southern Western Australia, South Australia, Victoria, New South Wales and southern Queensland) and Tasmania. GPS coordinates for all sample localities were recorded. At each location, a total of 20 late ‘dough-stage’ wheat heads were collected, with five heads taken every 20 m along a 60-m transect. Individual mites were extracted from plant material in the field using a dissecting microscope (40x magnification) and a metal probe, transferred to separate 0.5 ml microcentrifuge tubes, transported to the laboratory in liquid nitrogen and then stored at –80°C.
DNA extraction and lineage identification
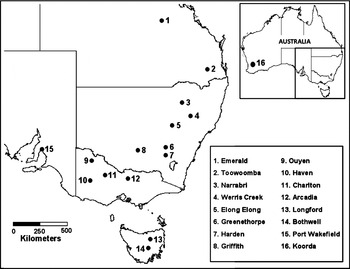
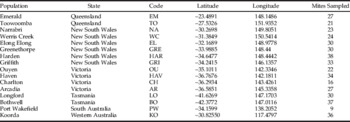
A modified Chelex method from Carew et al. (2004) was used to extract DNA from 437 mites representing all 16 sampling locations (table 1, fig. 1). For each sampling location, mites were extracted from two or more heads from the 20-m sampling transect to reduce the chance of sampling related individuals and detecting artifactual signals of population genetic structure. Microcentrifuge tubes containing mites were centrifuged at 20,800 g for 5 min to ensure mites were at or near the base of the tube. Next, 100 μl of 5% Chelex (Bio Rad) solution was added per tube, before incubating at 95°C for 15 min with periodic vortexing every 5 min. Mite extractions were cooled on ice and stored at –20°C.
Map depicting sites in Australia that were sampled for Aceria tosichella.

Sample locality details and mites numbers collected from respective sites.

Microsatellite isolation
Frequency variation of nuclear microsatellite alleles among WCM populations was tested to assess genetic structuring. Microsatellites were isolated following the FIASCO protocol (Zane et al., Reference Zane, Bargelloni and Patarnello2002) with some modifications (Rugman-Jones et al., Reference Rugman-Jones, Weeks, Hoddle and Stouthamer2005). The microsatellite library was developed using a single DNA extraction consisting of 200 mites from a viruliferous WCM pure line culture. A total of 192 clones were sequenced by Macrogen Laboratories (Seoul, Korea) and primer pairs were designed for each clone containing microsatellite repeats using PRIMER Version 3 (Rozen & Skaletsky, Reference Rozen, Skaletsky, Krawetz and Misener2000). PCR products were generated for each primer pair using an initial annealing temperature of 53°C and subsequently screened for polymorphisms using eight individuals representing four geographically isolated populations and 5% polyacrylamide denaturing gels.
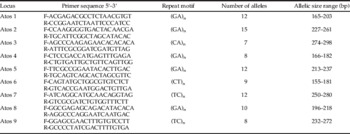
Polymorphic microsatellite markers (table 2) for individual mites were co-amplified in single multiplex PCR reactions using an Eppendorf Mastercycler Gradient S PCR machine. PCRs were performed in 10 μl reactions containing 5 μl Qiagen multiplex mix (Qiagen), 0.2 μM fluorescently labeled forward primer, 0.2 μM pigtailed reverse primer (Brownstein et al., Reference Brownstein, Carpten and Smith1996) and 2 μl template DNA. PCR cycling conditions consisted of an initial denaturation at 95°C for 15 min, followed by 40 cycles of 95°C for 20 s, 59°C for 90 s and 69°C for 60 s. A final extension step of 69°C for 30 min preceded an indefinite hold period at 20°C. Genotyping was performed using an Applied Biosystems 3730 capillary analyzer and product lengths were determined relative to a GS500LIZ_3730 size standard. Genotypes were subsequently scored using the GeneMapper version 4.0 software (Applied Biosystems).
Characteristics of polymorphic microsatellite loci.

Microsatellite analysis
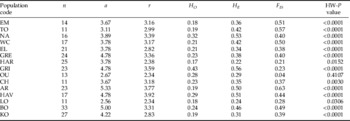
To prevent possible biases in our analyses resulting from ploidy inconsistencies between males and females associated with potential arrhenotoky in the species, a two-step analysis of the microsatellite data was performed. First, we conducted analyses on the distribution of genetic variation using diploid mites, characterized by heterozygous genotypes at one or more loci. This resulted in a reduced dataset, reducing population sizes an average of 34% (table 3). Second, we randomly selected a single allele from each locus of all individuals, thereby creating a data set consisting of haploid genotypes only. The haploid data set could not be used to estimate non-random associations of alleles within individuals (i.e. inbreeding coefficients) but yielded estimates of genetic structure at higher levels unbiased by individual ploidy level. A similar analytical approach has been previously adopted for microsatellite analyses of eriophyoid mites belonging to the Colomerus genus (Carew et al., Reference Carew, Goodisman and Hoffmann2004).
Statistics for Aceria tosichella populations screened with nine microsatellite loci assessing potential females (diploid dataset) only. Mean values over loci are presented for number of alleles (r), allelic richness (a), observed (H O) and expected (H E) heterozygosities, inbreeding (F IS), Hardy-Weinberg equilibrium P values.

The following basic statistics were calculated for the microsatellite data using FSTAT, version 2.9.3 (Goudet, Reference Goudet1995): allelic richness per population averaged over loci, Weir and Cockerham's measure of F IS, a global estimate of F ST (with 95% confidence limits) (Weir & Cockerham, Reference Weir and Cockerham1984), population pair-wise measures of F ST and their significance determined using permutations, and pairs of loci tested for linkage disequilibrium using a log-likelihood ratio test. In order to overcome potential limitations of F ST (Jost, Reference Jost2008), additional estimates of population differentiation, D est, were obtained using SMOGD version 1.2.2 (Crawford, Reference Crawford2010).
Estimates of observed (H O) and expected (H E) heterozygosity were determined using the Excel Microsatellite Toolkit (Park, Reference Park2001) and deviations from Hardy-Weinberg (HW) equilibrium were tested using Genepop, version 3.4 (Raymond & Rousset, Reference Raymond and Rousset1995). Regression and Mantel tests of Slatkin's linearized F ST transformation (F ST/(1–F ST)) (Rousset, Reference Rousset1997), with the natural log of geographical distance were calculated using GenAlex (Peakall & Smouse, Reference Peakall and Smouse2006). Significance of Mantel tests was determined by permutation (10,000 randomizations).
An analysis of molecular variation (AMOVA) was performed in GenAlEx (Peakall & Smouse, Reference Peakall and Smouse2006) by using pairwise F ST (or ϕ ST in the case of haploid data) as the distance measure, with 10,000 permutations and missing data for loci set at 10%. The model for analysis partitioned variation among regions (Queensland, New South Wales, South Australia, Western Australia, Victoria, Tasmania), among populations within regions and within populations. A principle components analysis (PCA), implemented in GenAlEx, was used to summarize patterns of genetic differentiation between the populations sampled. We plotted the first two underlying factors that explain the majority of the variation in the multilocus genotypes.
A Bayesian analysis was conducted to estimate the number of populations within the sample data using Structurama (Huelsenbeck & Andolfatto, Reference Huelsenbeck and Andolfatto2007). Structurama estimates the number of populations (K) in a sample by treating K as a random variable. The number of populations was inferred, with the prior value of K set as a random variable, using two independent Markov Chain Monte Carlo (MCMC) runs of 1 million steps, with samples taken every 1000 generations and the first 100 samples removed as burn-in. The MCMC analysis was summarized using a mean partition that minimizes the squared distance to all of the sampled partitions and the posterior probability of each K. A posterior distribution for the assignment of individuals to populations (clusters) was generated to infer population structure.
A second Bayesian analysis of population genetic structure was performed with the R package software GENELAND (Guillot et al., Reference Guillot, Estoup, Mortier and Cosson2005). The method makes use of a geographically constrained Bayesian model that explicitly takes into account the spatial position of sampled multilocus genotypes without any prior information on the number of populations and degree of differentiation between them. Like Structurama, K can be treated as variable, enabling the determination of the modal (i.e. most likely) value. The inference algorithm was launched with a single step approach (Guillot, Reference Guillot2008) using the Dirichlet distribution as prior for allele frequencies and where K was allowed to vary from 1 to 10. Ten independent runs of 500,000 MCMC iterations were performed with a maximum of 300 nuclei and a 50,000-interation processing burn-in consistent with recommendations (Guillot, Reference Guillot2008; Guillot et al., Reference Guillot, Estoup, Mortier and Cosson2005; Guillot & Santos, Reference Guillot and Santos2009).
Assessing mode of reproduction
We used multilocus genotypic profiles across populations to investigate the likely mode of species reproduction. Assuming arrhenotoky (as previous suggested for eriophyoids), we expect populations to consist of both haploid males and diploid females and a female-biased sex ratio. First, we determined the frequency of individual mites per population characterized by homozygous genotypes across all loci (potential males). Second, we determined the probability of homozygous individuals being diploid based on the number of sampled individuals and the number of alleles detected per population. The frequency of haploid and diploid population constituents was subsequently used to investigate sex ratios.
Results
Microsatellite isolation
From 192 clone sequences, 40 were identified to contain eight or more di-nucleotide repeat units. Fifteen of 40 clones were successfully amplified by PCR, and subsequent screening identified nine to be polymorphic. These nine markers were used to study genetic differentiation and diversity within A. tosichella populations (table 2).
Mode of reproduction
An assessment of mulitlocus genotypes revealed that ∼34% of individuals per sample population were characterized by homozygous genotypes across all loci. Subsequent tests indicated the probability of homozygous individuals being haploid was significant (P<0.001). Assuming arrhenotoky, the average diploid:haploid ratio of individuals across populations equated to approximately 3:1. Assuming males and females represent haploid and diploid individuals, respectively, we report a strong female-biased sex ratio, a characteristic often associated with arrhenotoky.
Genetic markers
A total of 93 alleles were detected for nine microsatellite loci, with a mean of 10.3 alleles per locus over all populations. The highest number of alleles was found for locus Atos2 (15; table 1). Allelic richness over all loci ranged between 2.34 and 3.92 (table 3). Expected heterozygosities were moderately high (H E∼0.22–0.56, mean=0.39), while observed heterozygosities were considerably lower (H O∼0.17–0.43, mean=0.24) (table 3). Mite populations, with the exception of Ouyen, exhibited strong deviations from Hardy–Weinberg Equilibrium (P<0.05 for all loci and all populations) and significant F IS values displaying an excess of homozygotes. High frequency null alleles are unlikely as homozygous excesses are present at all loci, a pattern that usually reflects genome- wide rather than locus-specific evolutionary processes. Significant linkage disequilibrium was found between pairs of loci at 12 out of 36 pairwise tests after corrections for multiple comparisons (P<0.001); however, this was largely attributed to a single population, Bothwell. We expect this to be either an artifact of the sampling, with the population sample consisting largely of related individuals; or, alternatively, this population may have been recently established by a few founding individuals.
Population differentiation – diploid dataset
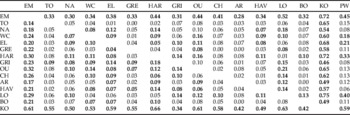
Estimates of F ST and D est across all loci were significantly different from zero (F ST=0.205; 99% CI=0.149–0.251; D est=0.181; 99% CI=0.141–0.225), indicating limited inter-population gene flow among sites we sampled. These values are largely attributed to two genetically divergent populations, Emerald and Koorda. These populations are at the most extreme north and west of the sampling distribution, respectively, and all pairwise population comparisons of F ST with these populations are highly significant (table 4). Estimates of global F ST and D est remained significantly different to zero (F ST=0.060, 99% CI=0.035–0.083; D est=0.083, 99% CI=0.048–0.126), following the exclusion of the Emerald and Koorda populations. However, the majority of the pairwise population comparisons of F ST are not significant, suggesting limited population genetic structuring and gene flow across much of the sampling distribution in eastern Australia. A number of significant pairwise population comparisons of F ST are evident; however, F ST values are generally low suggesting weak population structure.
Pairwise genetic distances among A. tosichella populations. Pairwise ϕ PT for the haploid dataset is shown in the upper diagonal, with pairwise F ST for the diploid dataset presented in the lower diagonal. F ST and ϕ PT values shown in bold are significant (P<0.001) after 10,000 permutations and corrections for multiple comparisons.

An AMOVA showed significant differentiation between regions (states) of Australia, between populations within regions as well as differences within populations. The majority of the variation in microsatellite loci was explained by variation within populations (76.12%; P<0.001), whereas variation between regions (Queensland, New South Wales, Victoria, Tasmania, Western Australia) explained 16.65% (P<0.001) of the variation and populations within regions explained 7.23% (P<0.001).
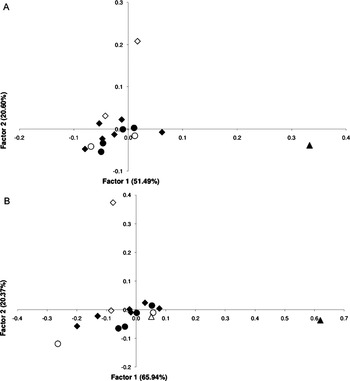
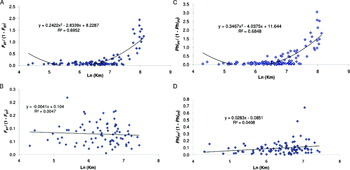
The first three axes in the PCA explained 51.5%, 20.6% and 10.72% of the variation, respectively, at the population level. The first two axes are plotted in fig. 2a. The Emerald and Koorda populations indicate a high degree of genetic differentiation from each other and all other populations. The remaining populations indicate no geographical pattern in their clustering on the axis. Regression analyses and a Mantel test suggest moderate isolation by distance. There was a significant association between genetic distance and geographic distance with the Mantel test showing a moderate relationship between Slatkin's linearized F ST and the natural log of geographic distance (Mantel r=0.62, P<0.001). Regression showed this relationship to be positive but non-linear (R2=0.695; fig. 3a). This signal is reduced when Emerald and Koorda populations are omitted from the analysis, with no significant signal of isolation by distance in eastern Australia (Mantel r=–0.069, P=0.315; linear regression R2=0.005; fig. 3b).
Principle components analysis by population for A. tosichella for (a) the diploid and (b) haploid datasets. Each point represents a single population. ◊, Queensland; ⧫, New South Wales; ●, Victoria; ○, Tasmania; ∆, South Australia; ▲, Western Australia. Variation explained by the first factor=65.94% and 65.94%, respectively.

(a) and (b) Regression analysis for A. tosichella diploid, and (c) and (d) haploid datasets datasets plotting pairwise Slatkin's linearised F ST/ϕ PT against the natural log of the pairwise geographical distance (km). All populations are included in the analysis shown in (a) and (c), while Koorda and Emerald populations are excluded from the analysis represented in (b) and (d). Scores for the accompanying mantel tests for (a), (b), (c) and (d) are r=0.62, P=0.003; r=–0.07, P=0.315; r=0.63, P=0.001; r=0.20, P=0.066, respectively.

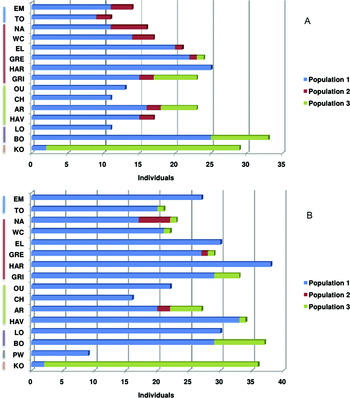
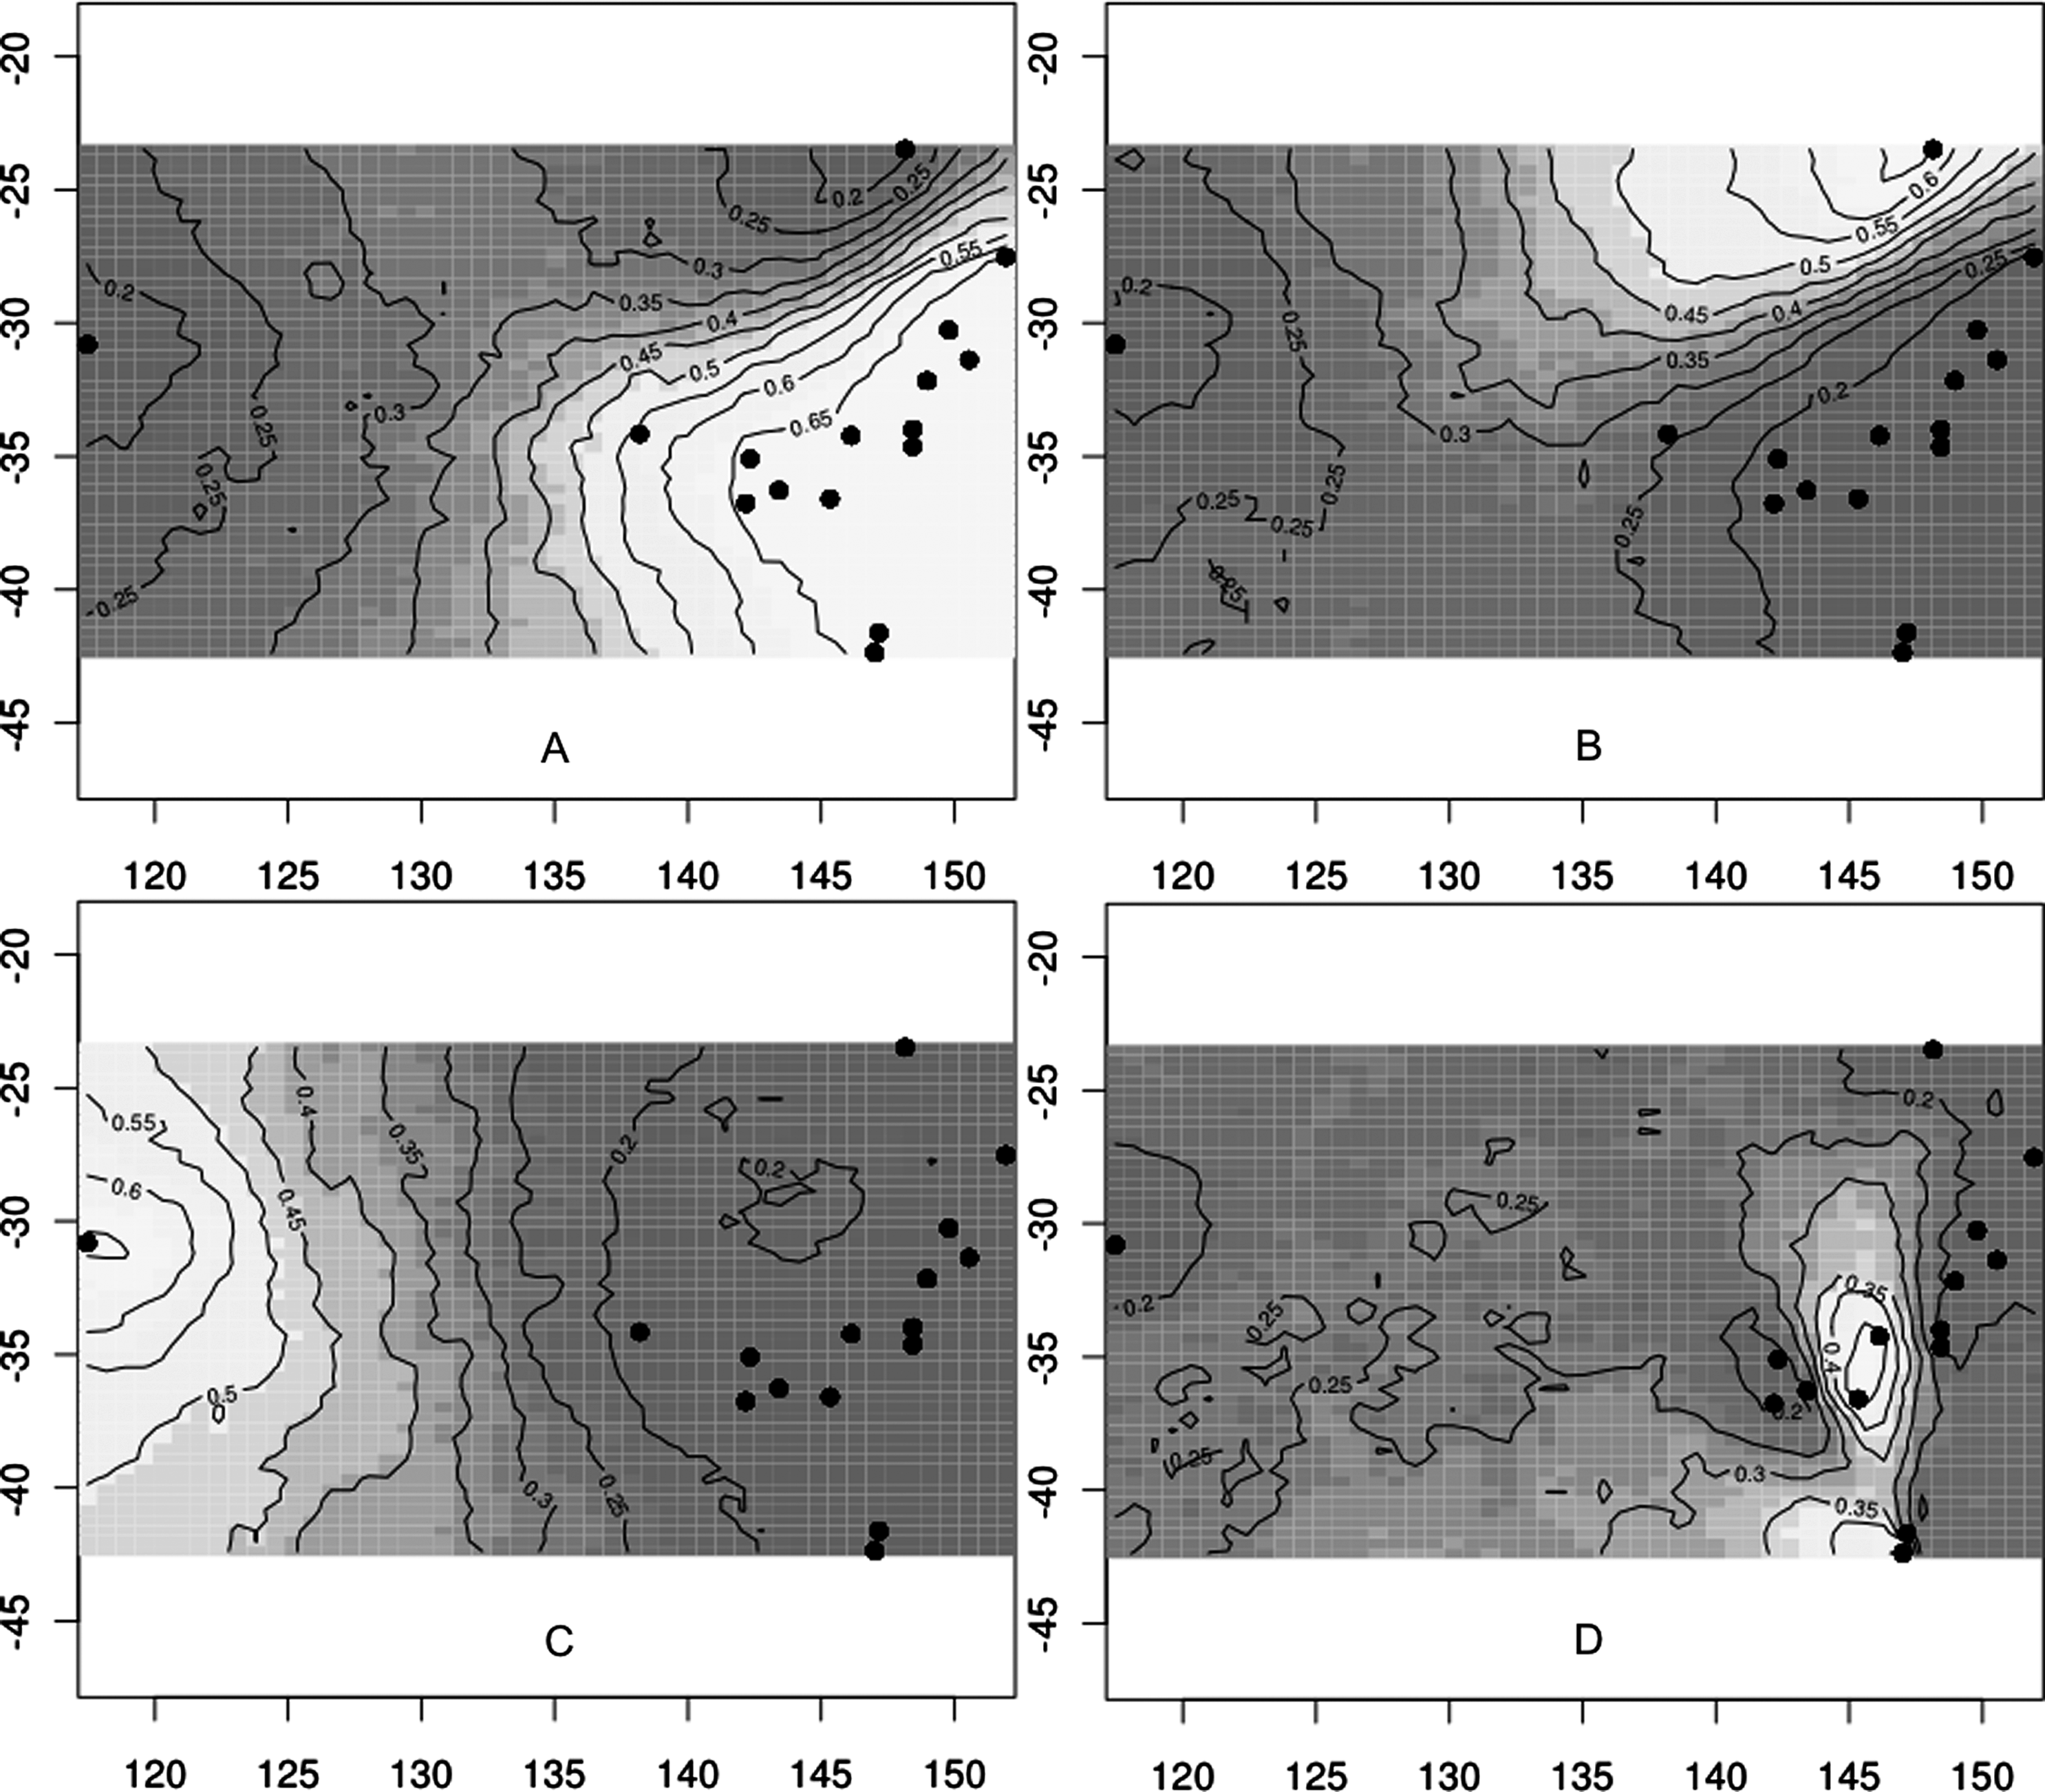
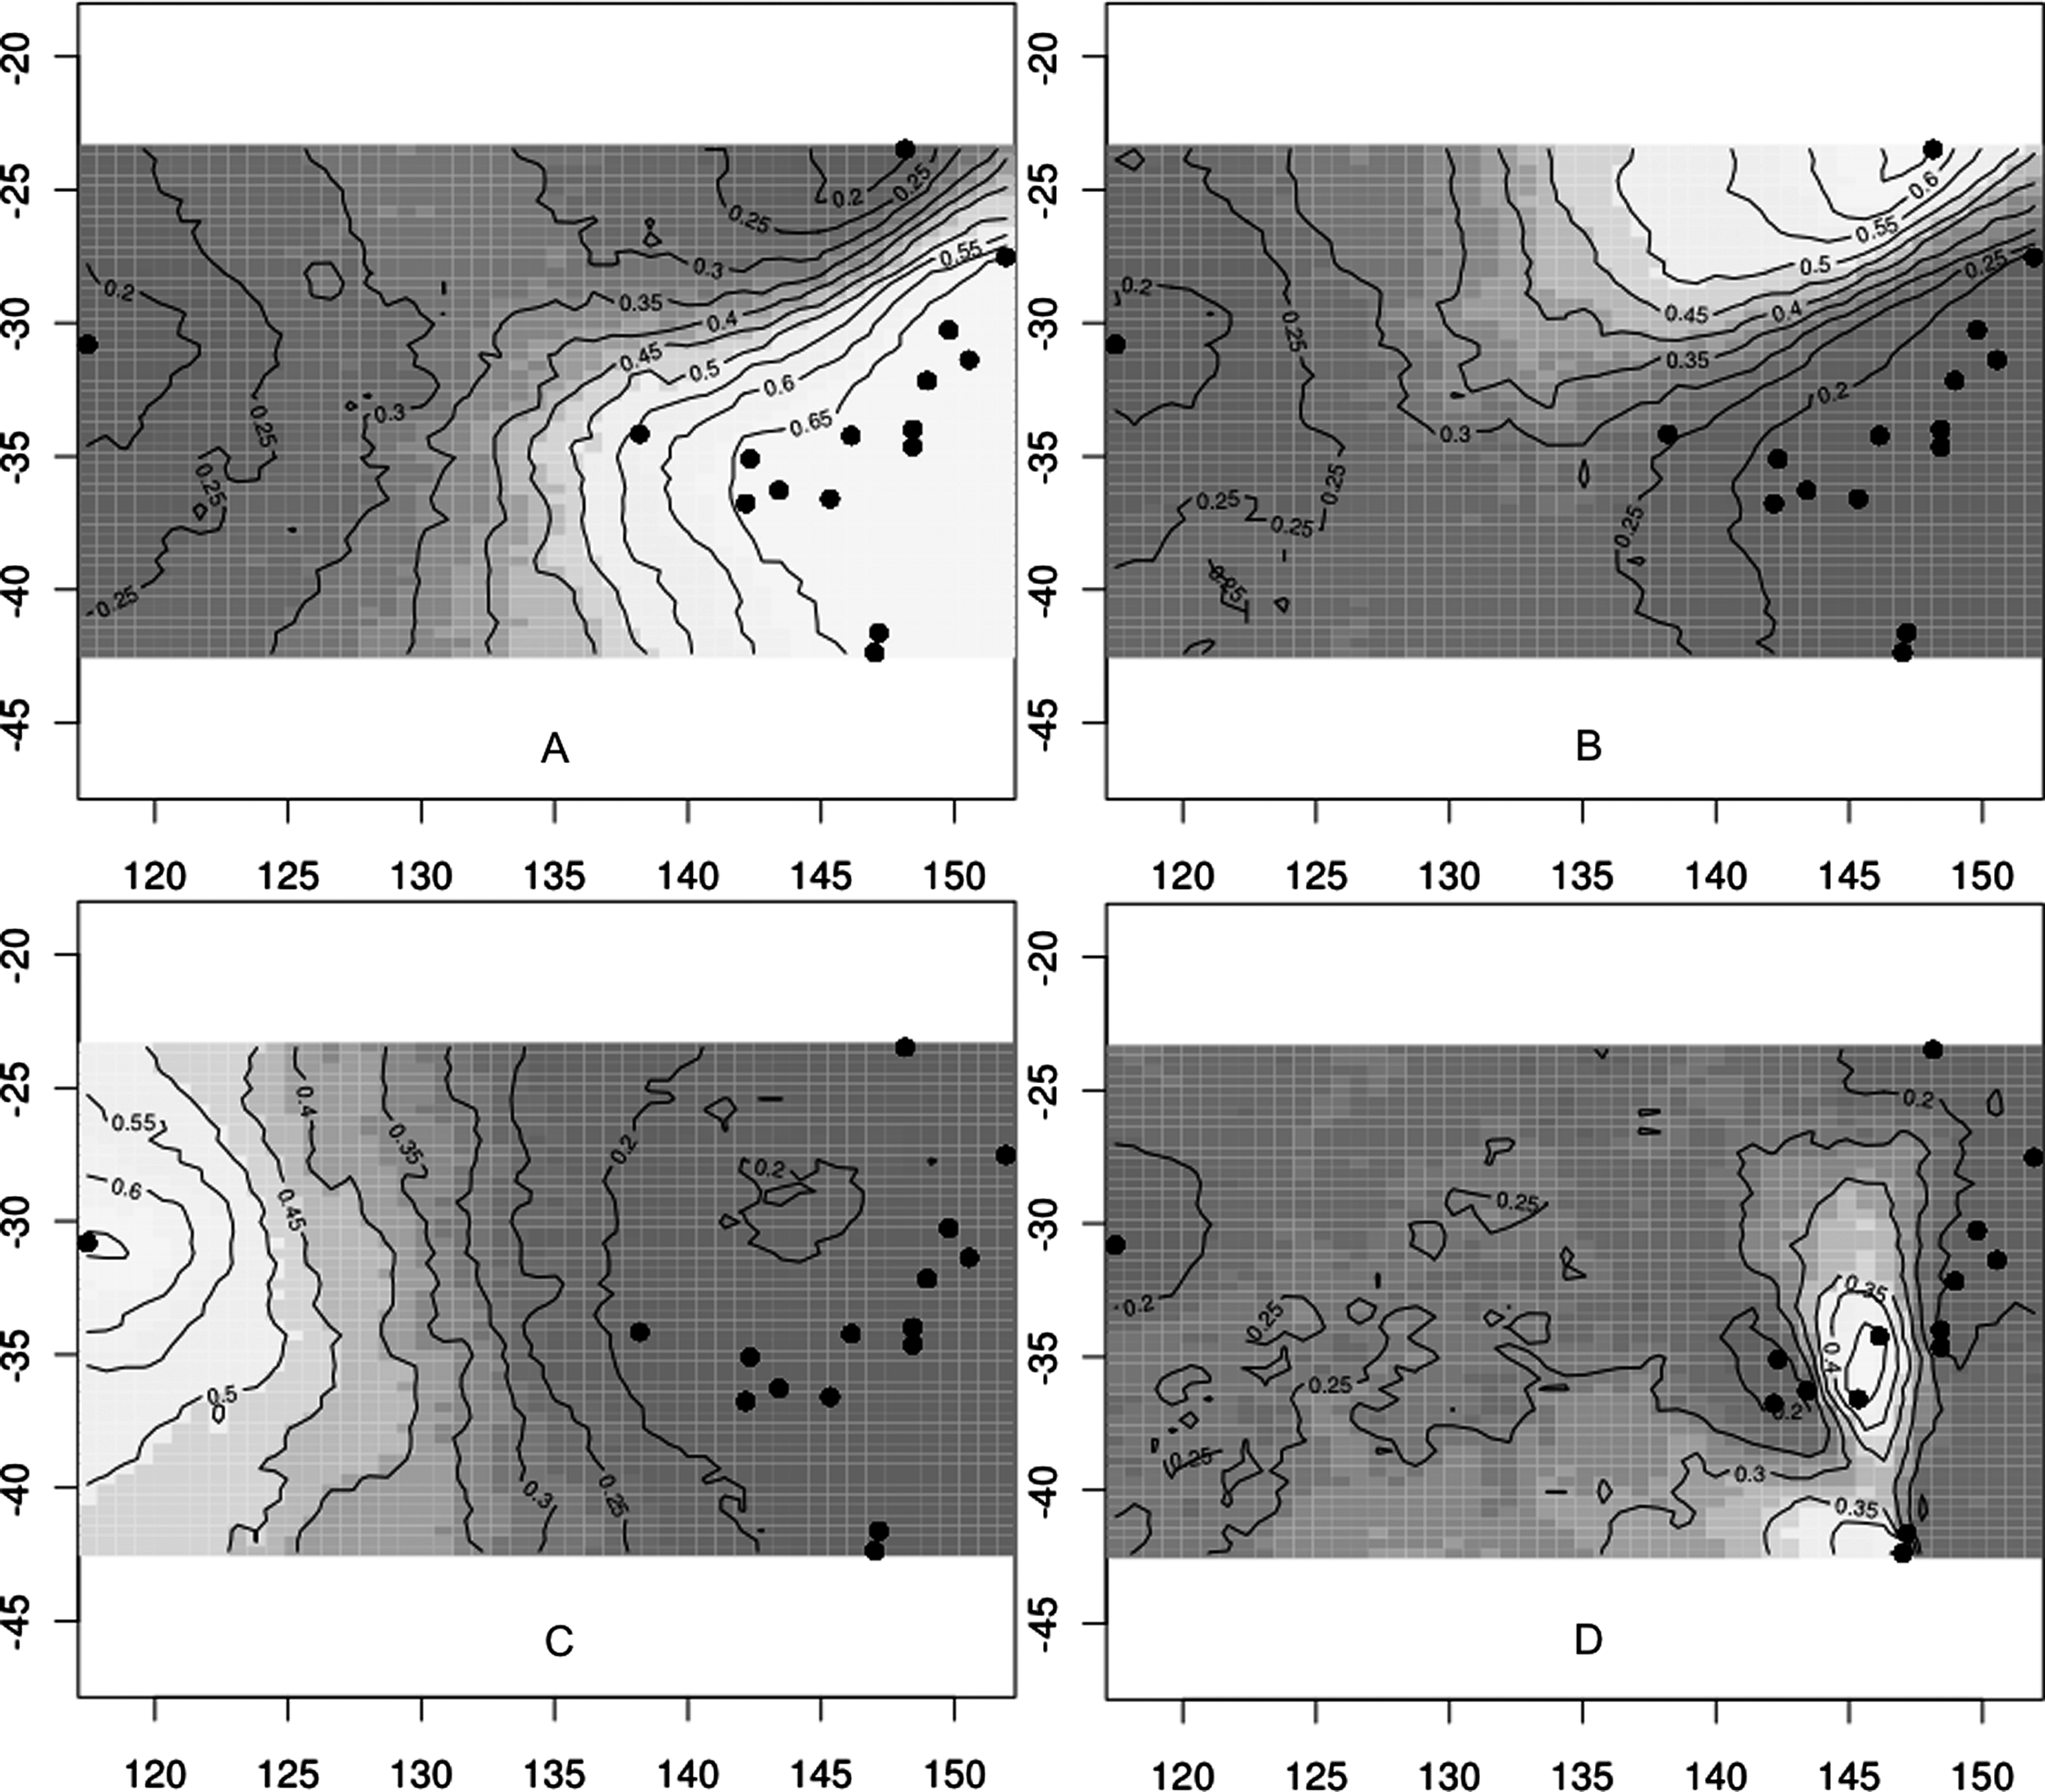
Structurama and GENELAND Bayesian clustering analyses were largely congruent. Structurama identified three populations (Pr(K=3|X)=0.27); fig. 4a) with the majority of mites from sampling locales in eastern Australian states (QLD, NSW,VIC,TAS) assigned to a single large population (population 1). A second smaller population was identified in eastern Australia (population 2) consisting of small numbers of individuals from nine populations representing all states (QLD, NSW, VIC, TAS). A third population (population 3) appears largely restricted to Western Australia. The Emerald population did not cluster on its own despite other analyses, suggesting it to be significantly divergent. GENELAND identified four populations (K=4; fig. 5), with the majority of mites from sampling locales in eastern Australian states (QLD, NSW, VIC, TAS) assigned to a single large population. Three sites nested within the major eastern Australian population form a second population, while mites from the Emerald and Koorda sample locations make up the third and fourth populations.
Individuals assigned to three populations by Structurama Bayesian cluster analysis of the diploid (A: Pr(K=3|X)=0.27) and haploid (B: Pr(K=3|X)=0.59) datasets. Sample locations presented on X-axis with coloured bars representing Australian states (blue, Queensland; red, New South Wales; green, Victoria; Purple, Tasmania; grey, South Australia; orange, Western Australia).

GENELAND maps of posterior probabilities of population membership and spatial representation population genetic structure for A. tosichella. Lighter areas indicate higher probabilities of population membership and contour lines represent genetic discontinuities between populations. Maps A, B and C represent individual assignments for K=3 (haploid dataset), while map D represents a nested fourth population in eastern Australia supported only by the diploid dataset (K=4).
Population differentiation – haploid dataset
Estimate of ϕ PT (analogous to F ST) and D est across all loci were significantly different from zero (ϕ PT=0.287, 99% CI=0.215–0.311; D est=0.178, 99% CI=0.146–0.215), indicating limited inter-population gene flow among sites. As observed with the diploid dataset, these values are largely attributed to two genetically divergent populations, Emerald and Koorda. All pairwise population comparisons of ϕ PT with these populations are highly significant. A single Tasmanian population, Longford, is also contributing to the significant global ϕ PT, exhibiting significant pairwise population comparisons of ϕ PT with 12 of the total 16 populations. When the Emerald and Koorda populations are excluded, the global ϕ PT (analogous to F ST) remains significantly different from zero (ϕ PT=0.072, 99% CI=0.052–0.115; D est=0.069, 99% CI=0.040–0.105); however, pairwise comparisons of ϕ PT suggest limited genetic structuring and high levels of gene flow among mite populations in eastern Australia. Significant pairwise comparisons generally exhibit low ϕ PT values, suggesting weak signals of population structure. Compared with values derived from the diploid dataset, the frequency of significant pairwise comparisons are less abundant.
An AMOVA showed significant differentiation between regions (states) of Australia, between populations within regions as well as differences within populations. The majority of the variation in the microsatellite loci was explained by variation within populations (71.31%; P<0.001), whereas variation between regions (Queensland, New South Wales, Victoria, Tasmania, South Australia, Western Australia) explained 21.20% (P<0.001) of the variation and populations within regions explained 7.49% (P<0.001).
The first three axes in the PCA explained 65.94%, 20.37% and 8.67% of the variation, respectively, at the population level. The first two axes are plotted in fig. 2b. Again Emerald and Koorda populations indicate a high degree of genetic differentiation from each other and all other populations. The remaining samples indicate no defined geographical pattern in their clustering on the axis, although Longford is more genetically distinct compared with the PCA generated for the diploid dataset.
Regression analyses and a Mantel test suggest a moderate isolation by distance association. There was a significant but weak correlation between genetic distance and geographic distance, with the Mantel test showing a moderate relationship between Slatkin's linearized F ST and the natural log of geographic distance (Mantel r=0.63, P<0.001). Regression showed this relationship to be positive but non-linear (R2<0.648; fig. 3c). This signal is again reduced when the divergent Emerald and Koorda populations are omitted from the analysis, suggesting no significant signal of isolation by distance in eastern Australia (Mantel r=0.20, P<0.066; linear regression R2=0.041; fig. 3d).
Structurama analyses revealed three distinct populations (K=3; Pr(K=3|X)=0.59; fig. 4b), with a similar geographical assignment of mites from sample locales as described for the diploid dataset. The majority of mites from sampling locales in eastern Australian states again cluster into a single large population (population 1). A second, smaller population was identified in eastern Australia (population 2), consisting of a small number of individuals from nine populations representing all states (QLD, NSW, VIC, TAS). However, the assignment of mites from these sample locales to population 2 were comparably less numerous than observed for the diploid dataset. The third population (population 3) appears to be dominated by mites from Western Australia. Again, the mites from the Emerald sample site clustered with the main population (population 1) despite other analyses suggesting it to be significantly divergent. GENELAND analyses were largely congruent, identifying three distinct populations (K=3; fig. 5). Mites representing all sampling locales in eastern Australia (QLD, NSW, VIC, TAS) formed a single large population, with mites from the Emerald sampling location being the only exception, instead forming a second distinct and isolated population. The third population identified consisted of mites from Western Australia only.
Discussion
Despite an unconfirmed report of A. tosichella reproducing parthenogenetically (thelytoky) (Slykhuis, Reference Slykhuis1976), the reproductive mode of the species is currently uncertain and poorly represented in the literature. Our results indicate that A. tosichella likely reproduces by arrhenotokous pathenogenesis based on a number of ‘arrhenotoky like’ features. First and most notably, our dataset revealed that all A. tosichella populations consist of both haploid and diploid individuals. Males and females could not be differentiated by morphology in this study; however, we can assume that males and females represent the haploid and diploid population constituents, respectively, based on previous studies of arrhenotokous pathenogenesis in eriophyoids and insects more generally (Maynard Smith, Reference Maynard Smith1978; Lester & Selander, Reference Lester and Selander1979; Helle & Wysoki, Reference Helle, Wysoki, Lindquist, Sabelis and Bruin1996). Based on this assumption, we observed a strong female-biased sex ratio within A. tosichella populations, with putative diploid females constituting ∼70% of mites across populations, a figure that appears consistent with previous eriophyoid studies (Sabelis & Bruin, Reference Helle, Wysoki, Lindquist, Sabelis and Bruin1996). Our dataset also indicated significant inbreeding within mite populations. Inbreeding and arrhenotoky are often closely associated in mites (Wrensch & Ebbert, Reference Wrensch and Ebbert1993), and inbreeding in many cases results in female-biased sex ratios.
Acari are characterized by a diversity of reproductive strategies, including diplodiploidy, halpodiploidy (arrhenotoky and parahaploidy) and thelytoky (Capinera, Reference Capinera2008). Our results are congruent with previous suggestions of arrhenotokous pathenogenesis being the ancestral mode of reproduction within the Eriophyoidae, whereby uninseminated females are capable of producing all male haploid progeny (Helle & Wysoki, Reference Helle, Wysoki, Lindquist, Sabelis and Bruin1996; Linquist & Oldfield, Reference Linquist, Oldfield, Lindquist, Sabelis and Bruin1996; de Lillo & Skoracka, Reference de Lillo and Skoracka2010). A female-biased sex ratio typically associated with haplodiploidy has been observed in a number of eriophyoid lineages (Borsa & Kjellberg, Reference Borsa and Kjellberg1996; Skoracka & Kuczynski, Reference Skoracka and Kuczynski2004; Ozman & Goolsby, Reference Ozman and Goolsby2005), and a haploid chromosome number n=2 has been observed among members of the family that have been karyotyped to date (Helle & Wysoki, Reference Helle, Wysoki, Lindquist, Sabelis and Bruin1996). While there have been few reports of alternative reproductive strategies among the Eriophyoidae (Marshall & Clayton, Reference Marshall and Clayton2004), descriptions are based on a limited number of species; and, therefore, alternate reproductive modes may exist in this highly speciose group (Wrensch & Ebbert, Reference Wrensch and Ebbert1993; Lindquist et al., Reference Lindquist, Sabelis and Bruin1996).
These findings are relevant to management of these pests. Pest species characterized by various reproductive modes differ in their colonization ability and the way in which they are likely to respond to control options such as pesticides (Hoffmann et al., Reference Hoffmann, Reynolds, Nash and Weeks2008). For example, parthenogenetic species and species reproducing by arrhenotokous parthenogenesis have a significant colonization advantage over strictly sexual species given that populations can be initiated from single individuals, whereas sexual species need at least one male and female to establish a new population. This may result in higher population growth rates compared to sexual species (Maynard Smith, Reference Maynard Smith1978; Bell, Reference Bell1982; Butlin et al., Reference Butlin, Schön, Griffiths and Martens1998), particularly if only females are produced under parthenogenesis or if there is a female bias. Parthenogenetic and arrhenotokous pathenogenetic species characterised by high mobility and fecundity may, therefore, have a high infestation potential and ability to spread associated pathogens. However, parthenogens are less likely to develop pesticide resistance due to comparatively slower rates of adaptation, particularly when resistance involves multiple loci as opposed to single mutational steps (Hoffmann et al., Reference Hoffmann, Reynolds, Nash and Weeks2008).
Nine polymorphic microsatellite loci were isolated from A. tosichella and used to assess genetic structure across 16 populations, encompassing cropping regions in six states of Australia (QLD, NSW, VIC, TAS, SA, WA). A two-step analysis of the microsatellite data was implemented to avoid biases associated with ploidy inconsistencies among sexes. Analyses of these datasets produced congruent results and indicated limited genetic structuring among A. tosichella populations in eastern Australia, despite separation of sampling locales of up to 1500 km. Overall findings suggest that gene flow among populations in eastern Australia, including Tasmania, is extensive and sufficient enough to homogenize microsatellite allele frequencies over broad distances.
Two genetically divergent and potentially isolated populations of mites were detected in this study: Koorda, the most westerly and only Western Australian sample included; and Emerald, the most northern sample from eastern Australia. Mite populations in the east and west of the country are separated by ∼3000 km, much of which is desert landscape, representing a significant barrier to gene flow. Carew et al. (2008) also found Western Australia to be genetically distinct at the mitochondrial level. Based on these findings, it is likely that A. tosichella was introduced to Western Australian via human vectors, subsequently diverging genetically over time.
The genetic isolation of the Emerald population should be interpreted with caution. This site is located in the northern reaches of the eastern Australian grain belt and ∼600 km north of the nearest sample population included this study (Toowoomba). Severe drought conditions limited mite collections in this region and mites were at a low abundance. This meant that samples from Emerald came from a single wheat head (all other sample populations in this study represented by mites from >2 heads separated by 20 m) and might represent a local mating group, perhaps with only one or a few foundresses (assuming arrhenotoky). As a result, it is possible that the Emerald genetic profile is not representative of the local population and a false signature of structure has been detected. Interestingly, Emerald did not cluster distinctively in the STRUCTURAMA analyses despite strong evidence of genetic differentiation provided by pairwise comparisons of F ST/ϕ PT, AMOVA, and PCA and GENELAND analyses. We expect that the STRUCTURAMA placement of Emerald to be artifactual, as clustering programs can sometimes infer spurious relationships for various reasons, including significant departures from Hardy-Weinberg equilibrium (Frantz et al., Reference Frantz, Cellina, Krier, Schley and Burke2009; Guillot, Reference Guillot2009; Guillot & Santos, Reference Guillot and Santos2009; Schwartz & McKelvey, Reference Schwartz and McKelvey2009).
While extensive gene flow is the most likely explanation for a lack of population structure in eastern Australia, it is possible that F ST reflects the colonization history of the species in Australia. Although we cannot be certain of the origin and timing of the species introduction in Australia (Frost, Reference Frost1995; Halliday & Knihinicki, Reference Halliday and Knihinicki2004), A. tosichella was most likely introduced during the last century via shipping of contaminated plant material. The introduction of A. tosichella may have resulted from a single cohort or founding population that successfully expanded its range over time to occupy all reaches of the wheat belt in eastern Australia. If the range expansion occurred recently and involved the movement of substantial numbers of individuals, this might explain the pattern of genetic homogeneity observed among mite populations in eastern Australia. Regardless, these results suggest that the mites have a high dispersal potential. The genetically divergent populations in Western Australia and Queensland might have arisen due to separate introduction events, but this needs to be confirmed with a more detailed phylogenetic analysis.
Although our findings indicate limited genetic structuring and extensive gene flow among mite populations in eastern Australia, they do not suggest panmixia. Both datasets indicate significant but weak differentiation between a number of populations (table 4). Given climatic conditions are known to be a major influence of mite population size, it is possible that populations may become locally reduced under extreme climatic conditions. In this case, apparent signatures of population structure might be detected due to founder effects when mite populations re-establish. We recommend that additional genetic assessments be conducted to determine if patterns of genetic structure in eastern Australia are temporally variable and associated with climatic patterns.
WCM are effective aerial dispersers (Slykhuis, Reference Slykhuis1955; Staples & Allington, Reference Staples and Allington1959; Harvey & Martin, Reference Harvey and Martin1988; Thomas & Hein, Reference Thomas and Hein2003; Liu et al., Reference Liu, Lee, Sears and Schaafsma2005; Coutts et al., Reference Coutts, Strickland, Kehoe, Severtson and Jones2008). Females are regarded as the dispersing stage in eriophyoid mites, although males and nymphs are found dispersing as well (Linquist & Oldfield, Reference Linquist, Oldfield, Lindquist, Sabelis and Bruin1996). The initiation of mite movement is influenced by a combination of factors, including population density and deteriorating host plant condition (Nault & Styer, Reference Nault and Styer1969; Thomas & Hein, Reference Thomas and Hein2003). Adult mites congregate at leaf edges and tips and attach themselves with their caudal sucker to the plant surface, standing in an upright position facing the wind before releasing. This upward stance is thought to help raise mites out of the laminar layer where wind speed decreases exponentially near the leaf surface (Sabelis & Bruin, Reference Helle, Wysoki, Lindquist, Sabelis and Bruin1996). WCM have also been observed forming chains of several individuals connected by their caudal suckers, which may lead to the aerial dispersal of groups of mites (Gibson & Painter, Reference Gibson and Painter1957; Nault & Styer, Reference Nault and Styer1969). In addition to aerial dispersal, A. tosichella may also be capable of dispersing via phoretic transport. Gibson & Painter (Reference Gibson and Painter1957) conducted a series of laboratory experiments and demonstrated that mites were capable of attaching to and moving via aphid vectors (Gibson & Painter, Reference Gibson and Painter1957). Phoretic transport via insect and human vectors has also been reported for a variety eriophyoid species (Michalska et al., Reference Michalska, Skoracka, Navia and Amrine2010); however, aerial movement is currently recognized as the predominant mode of dispersal for A. tosichella, and eriophyoid mites generally.
Our results suggest that mites might be capable of dispersing over large distances, given evidence of extensive gene flow across large geographic distances and nonsignificant results from our isolation by distance tests. While these patterns are likely to be driven primarily by natural mite movement, gene flow is likely to be influenced to some extent by human factors. The distribution of contaminated agricultural machinery, vehicles and vegetative material (e.g. hay and silage) all serve as potential vectors for broad mite translocation. This might also explain the lack of genetic differentiation between mainland and Tasmanian mite populations, as transoceanic dispersal via natural movement has not been reported for any eriophyoid species to date. Mite populations that appear to be isolated in eastern Australia might reflect recent colonization and founder events or areas of limited mite translocation. This could be tested with temporal surveys of genetic variation.
The findings reported here have significant management implications. Population structure and dispersal potential are important elements that need to be considered for pest control purposes. For instance, high levels of gene flow allows a more rapid spread of pesticide resistant alleles from population to population (Daly & Gregg, Reference Daly and Gregg1985; Denholm et al., Reference Denholm, Sawicki and Farnham1985; Slatkin, Reference Slatkin1987; Raymond et al., Reference Raymond, Callaghan, Fort and Pasteur1991; Endersby et al., Reference Endersby, McKechnie, Ridland and Weeks2006, Reference Endersby, Ridland and Hoffmann2008). Our results suggest that there is potential for resistance alleles to spread rapidly throughout eastern Australia.
Conclusion
In conclusion, this study has highlighted the likely mode of reproduction of WCM in Australia and indicated low genetic structuring among mites populations across the cropping regions. Western Australian populations of WCM appear to be genetically differentiated, perhaps due to historical reasons and/or colonization effects. Mites appear to have the capacity to disperse over long distances, potentially driven by a combination of natural movement and human vectors, which may help explain sporadic outbreaks of mites and associated virus damage in different areas. This study provides a spatial framework for future management of WCM and associated cereal pathogens in Australia.
Acknowledgements
The authors wish to thank Michele Schiffer, Peter Mangano, Dusty Severtson, Melissa Carew, Mark Blacket, John Roberts and Elise Furlan for assistance with mite collections and various laboratory tasks. This study was funded by the Grains Research and Development Corporation.