Introduction
The World Economic Forum estimates the cost of corruption to be more than 5 per cent of global GDP (US $2.6 trillion), and the World Bank believes over $1 trillion is paid in bribes each year (CleanGovBiz 2013). Of course, it is impossible to know with certainty what the actual figures are, given that corruption by its nature is usually clandestine, but there can be little doubt that corruption represents one of the most pressing public policy challenges faced by governments across the world. Indeed, there is now a broad consensus in academic research that corruption is almost always damaging (in contrast to an earlier belief that it could sometimes help bypass obstructive bureaucracy), but there remain fundamental disagreements about how it should be measured, what the most effective means to reduce its occurrence and impact are, and what level of priority it should be given, in comparison to, for example, the alleviation of poverty, conflict resolution and so on. In this review, we focus on the vexed question of measurement: if we are to stand any chance of developing effective anti-corruption policies, we need to have reliable indicators of both the extent and the location of corruption.
There have been several attempts to develop indicators for corruption. As Hawken and Munck (Reference Hawken and Munck2009, 21) have recognised, the task of measuring corruption – especially by developing cross-national data sets of broad scope – is laudable and welcome; unfortunately, however, variations in reported levels of corruption are as likely to be a product of prevailing corruption measures, and the methods that are used to create these measures, as they are to reflect actual levels of corruption. From a policy perspective, this issue is of signal importance. In 2008, the United Nations Development Programme (UNDP) Oslo Governance Centre published A User’s Guide to Measuring Corruption (UNDP 2008), which sought to identify the strengths and limitations of different approaches to measurement and to provide practical guidance on how policy-makers should use the indicators and data generated by corruption measurement tools.
The UNDP guide suggests an informal taxonomy that classifies corruption indicators by four categories: (1) the scale and scope of indicators; (2) what is actually being measured; (3) the methodology employed; and (4) the role that internal and/or external stakeholders play in generating the assessments. However, the key issue from the perspective of international agencies, such as the UNDP or the Organisation for Economic Co-Operation and Development and its Development Assistance Committee, is the need to develop actionable indicators that measure specific features of corruption and that are directly linked to policy decisions:
To put it plainly, there is little value in a measurement if it does not tell us what needs to be fixed. (UNDP 2008, 8)
Effective measurement is thus an essential starting point, but it will be argued in this review of existing approaches that the most commonly used attempts have been beset by conceptual, methodological or political problems (or a combination of all three) that constrain their utility as a guide to developing effective anti-corruption policies.
This article is developed in three parts. In the first, we explore perception-based measurements of corruption, which remain the most widely used, focusing in particular on conceptual and methodological issues. We argue that there is a gap between the concept of corruption and its measurement, resulting in outcomes that may be reliable, but not necessarily valid: that is, perceptions of corruption may reflect a reality, but that reality may not relate to corruption as opposed to other issues. In the second part, we explore non-perceptual approaches to measuring corruption, arguing that they also suffer from problems of definition, have a more limited scope and applicability, and do not lend themselves to the effective use of the kinds of mathematical models that have become increasingly common in the analysis of electoral fraud. In the final part, we examine the tension between the demands of policy-makers and anti-corruption activists on the one hand, and the motivations of academic researchers on the other. The search for actionable answers on the part of the former sits uncomfortably with the latter’s focus on the inherent complexity of corruption.
Perception-based measures
The dominant mode of measuring corruption since the mid-1990s has been perception-based via cross-national indices drawn from a range of surveys and expert assessments. This dominance has been reflected in measures like the Corruption Perceptions Index (CPI), the Bribe Payers Index and other aggregate indicators, such as the control of corruption element in the World Bank Group’s Worldwide Governance Indicators (WGI). Such indices have undoubtedly proven immensely important in raising awareness of the issue of corruption, as well as forming the basis of cross-country comparisons [Transparency International (TI) 2009]. Yet, despite their importance, it is now widely acknowledged that such measures are inherently prone to bias and serve as imperfect proxies for actual levels of corruption (Razafindrakoto and Roubaud Reference Razafindrakoto and Roubaud2006; Kurtz and Shrank Reference Kurtz and Shrank2007). At the same time, the lack of an authoritatively agreed upon definition of what counts as corruption remains a serious obstacle to measurement. In practice, specific indicators inevitably (even if implicitly) reflect particular definitions (Hawken and Munck Reference Hawken and Munck2009). This latter point is especially serious. By virtue of their different foci, these indicators (that all putatively refer to corruption) can allow for fundamentally different interpretations of substantive relationships.
Perhaps the most widely used approach to measuring corruption has been TI’s CPI. Published annually since 1995, the CPI:
captures information about the administrative and political aspects of corruption. Broadly speaking, the surveys and assessments used to compile the index include questions relating to bribery of public officials, kickbacks in public procurement, embezzlement of public funds, and questions that probe the strength and effectiveness of public sector anti-corruption efforts (TI 2010).
The CPI is a composite index, calculated using data sources from a variety of other institutions along with information from previous CPI indices. For example, 13 surveys and assessments published between 2011 and 2012 were used for the 2012 index (TI 2012).
Despite wide use, the CPI has become increasingly controversial, particularly in regard to its methodology and the use to which it has been put (see, for instance, Razafindrakoto and Roubaud Reference Razafindrakoto and Roubaud2006; de Maria Reference de Maria2008; Weber Abramo Reference Weber Abramo2008; Andersson and Heywood Reference Andersson and Heywood2009; Hawken and Munck Reference Hawken and Munck2009; Thomas Reference Thomas2010). As its title explicitly notes, the CPI measures perceptions and not, say, reported cases, prosecutions or proven incidences of corruption. Like the CPI, the World Bank’s WGI also include perception measures, in this case relating to the “control of corruption” (CC), where corruption is taken to be the exercise of public power for private gain (Kaufmann et al. Reference Kaufmann, Kraay and Mastruzzi2008; see also Thomas Reference Thomas2010).
One recognised limit of aggregate perception data is that most factors that predict perceived corruption, such as level of economic development, state of democracy, press freedom and so forth, do not correlate well with available measures of actual corruption experiences (Triesman Reference Treisman2007). The potential scale of the disparity between perception and experiences of corruption is starkly shown in a series of Eurobarometer studies of the attitudes of Europeans to corruption (European Commission 2006, 2008, 2009, 2012). The latest, conducted in September 2011, found that a strikingly high proportion of EU citizens (74 per cent, on average) saw corruption as a “major problem” in their country, occurring within local (76 per cent), regional (75 per cent) and national (79 per cent) institutions. In just five countries (Denmark, the Netherlands, Luxembourg, Finland and Sweden) did fewer than half of respondents agree. Yet, personal experience of corruption remained strikingly low, with an overall average of just 8 per cent of respondents having been asked to pay any form of a bribe for access to services during the preceding 12 months; in only four countries (Bulgaria, Lithuania, Slovakia and Romania) did more than 20 per cent report having been asked to pay a bribe (European Commission 2012).
More generally, reflecting the same pitfalls in survey research beyond Europe, Triesman (2007, 212) cautions, “it could be that the widely used subjective indexes are capturing not observations of the frequency of corruption but inferences made by experts and survey respondents on the basis of conventional understandings of corruption’s causes”. A recent detailed study of the relationship between the CPI and TI’s Global Corruption Barometer, which seeks to capture the lived experience of corruption through the eyes of ordinary citizens, has also shown persuasively that personal experience is a poor predictor of the population’s perceptions; furthermore, “the ‘distance’ between opinions and experiences vary haphazardly from country to country” (Weber Abramo Reference Weber Abramo2008, 5). In a similar vein, a detailed review of perceptual measures of corruption and experienced-based measures of corruption has shown that, while perceptions and experiences are highly correlated in general, the relationship between them is non-linear (Donchev and Ujhelyi Reference Donchev and Ujhelyi2009, 9–10). In practice, this means that measures like the CPI are better able to discriminate between countries in which citizens experience the lowest levels of corruption and worse at discriminating between those in which citizens experience higher levels (Donchev and Ujhelyi Reference Donchev and Ujhelyi2009, 35). Perceptions of corruption also appear to respond to the absolute level of corruption within countries, rather than the relative level (Donchev and Ujhelyi Reference Donchev and Ujhelyi2009, 18). This means that, even if the number of corruption incidents per person in the population is identical, a country with a larger population is more likely to have a worse perceived level of corruption. Moreover, general perceptions cannot differentiate between various types of corruption, nor between corruption in different sectors (e.g. judicial, financial, health and so forth) within countries. To the extent that the amount of corruption and the nature of corruption differ systematically between different sectors, this is an especially serious loss.
Since the CPI draws upon a series of surveys in order to generate the final index, it could theoretically offer insights into a wide variety of behaviours that could be called corrupt and a wide variety of situations in which corruption occurs. However, the surveys that the CPI is based upon have a far narrower frame of reference in practice, focusing primarily upon the perceptions of business leaders and country experts (Philp Reference Philp2006, 50; Andersson and Heywood Reference Andersson and Heywood2009, 752–753). One consequence is that corruption is most likely to be understood in terms of financial corruption that affects businesses – a focus which may serve to obscure the distinctions between different types of corruption and potentially even mask the effects of corruption (Knack Reference Knack2006, 2; Andersson and Heywood Reference Andersson and Heywood2009, 753; Kenny Reference Kenny2009, 328; Olken Reference Olken2009, 951).
Furthermore, while constituent surveys of the CPI probably over-represent business-related financial corruption, each survey has its own (implicit) understanding of corruption. Amalgamating responses into a single index may produce unhelpful conceptual conflation, even if this is not reflected statistically (Saisana and Saltelli Reference Saisana and Saltelli2012, 11). Since the aim is to produce a single measure of corruption perceptions, and thus the index includes non-financial measures, such conflation can have serious consequences. Indeed, the approach effectively gives greater or lesser emphasis to qualitatively different conceptualisations in the final ranking in proportion to the number of surveys that use a particular conceptualisation. A country may have a relatively low level of financial corruption coupled with a relatively high level of political corruption (vote buying, electoral fraud, etc.); yet, the extent to which each of these factors is reflected in the final score is ultimately determined by the frequency of each conceptualisation within the constituent surveys. Unfortunately, there is no guarantee that the frequency of any given conceptualisation is proportionate to its importance.
Like the CPI, the WGI use a composite approach based upon a series of other indices: control of corruption (CC), voice and accountability, rule of law, government effectiveness, political stability and regulatory quality. As Apaza (Reference Apaza2009, 140) has argued, the validity of applying the index rests on the ability of the individual WGI component indices to discriminate effectively between the six concepts and to be different from other measures of government performance. Recently, however, using both measurement and structural models, Langbein and Knack (Reference Langbein and Knack2010) have argued that the six indicators are not empirically distinct. To the extent that these indicators are assumed to be independent while not being empirically so, results may be substantively misleading. Moreover, analyses have shown that, while the indicators can provide a statistically reliable measure, “what they reliably measure is not so clear” (Langbein and Knack Reference Langbein and Knack2010, 365). Indeed, as Thomas (Reference Thomas2010, 39) has argued, “some of the constructs themselves are poorly defined and may be meaningless”. Similarly, the UNDP (2008, 26) commented that, “by aggregating many component variables into a single score or category, users run the risk of losing the conceptual clarity that is so crucial”. If users are unable to understand or unpack the concept that is being measured, their ability to draw out informed policy implications is severely constrained.
It is of note that the CPI and the WGI are published annually (although the latter are not presented in league table format). While TI has been explicit that its methodology was “not designed to allow country scores to be compared over time” (TI, 2011a), the annual publication of results inevitably invites precisely such comparisons (see also Treisman Reference Treisman2007, 220; Andersson and Heywood Reference Andersson and Heywood2009). This is an avenue of investigation that has been pursued by both TI itself in its press releases (see, e.g. TI 2007), as well as by academic researchers (Treisman Reference Treisman2007, 220; for specific examples of the CPI being used for comparisons over time, see Herzfeld and Weiss Reference Herzfeld and Weiss2003, Catrinescu et al. Reference Catrinescu, Leon-Ledesma, Piracha and Quillin2008 and Bussell Reference Bussell2011; for the WGI being used in a similar way, see Kaufmann et al. Reference Kaufmann, Kraay and Mastruzzi2009). Despite the caution against using the CPI for comparisons between time points, the fact that it happens makes the variability of the CPI (and other annual perception-based measures) over time an important topic in its own right. If the variability in countries’ scores between years is very marked, we may question whether the CPI offers valid measurements. After all, the CPI is a single measure, purporting to measure a single (latent) construct with a consistent scale range.
Similarly, the absence of any substantively important variation in the scores over time would indicate a poor, and potentially misleading, measure. Indeed, the annual publication of results in league table format places an emphasis on the idea that change actually exists, regardless of its specific cause. Each year, attention is inevitably drawn to those countries whose scores have changed. This attention allows regimes – including highly corrupt regimes – to trumpet their success when the ranking appears to be more positive, while glossing over or ignoring downward trends (Andersson and Heywood Reference Andersson and Heywood2009, 754). If no systematic change is happening, the CPI becomes less an advocacy tool for the fight against corruption and more a tool that can be manipulated for political ends by corrupt regimes.
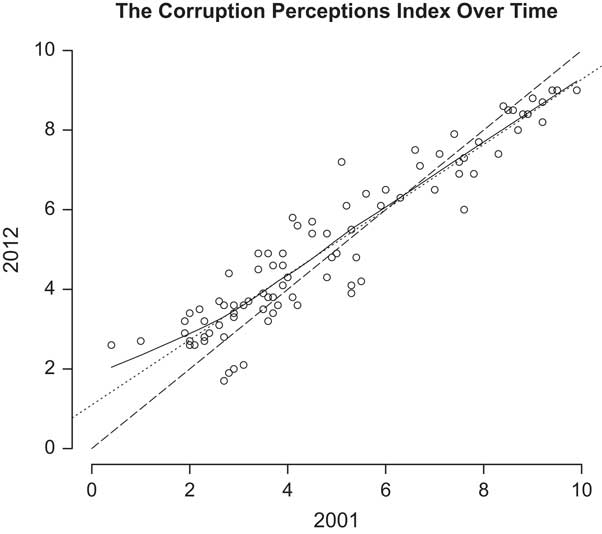
In order to test whether the CPI is capable of providing useful information over time, it is necessary to analyse a set of country scores for one year against those for another. However, it is important to note that, within the CPI’s methodology, an implicit “lag” exists, because country scores are generated each year using data that is up to 2 years old (TI 2011b). Given that the CPI is calculated yearly, this means that, in practice, scores are usually calculated using at least some of the same data as was used in the previous year’s score. In order to avoid these potential problems, we take an 11-year gap, focusing upon the scores reported in the 2001 CPI and the scores for the same countries reported in the 2012 CPI.Footnote 1 A plot of these data is shown in Figure 1.
Countries’ corruption perceptions index (CPI) scores in 2001 and 2012. The dotted line shows an OLS regression line fitted to the data. The dashed line shows the relationship when the y values are exactly equal to the x values. The solid line is a non-parametric (LOWESS) smooth line, which can take any shape in order to follow the data. The analysis shows all 91 countries from the 2001 CPI. Source: authors’ own calculation.
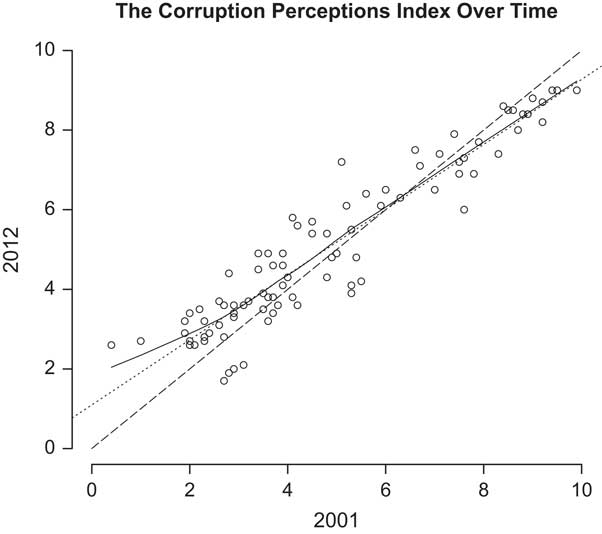
As is immediately apparent, there is a very strong linear relationship between 2012 scores and 2001 scores. Moreover, the OLS regression line, the y=x line, and the LOWESS smoothed line all lie within a very short distance from each other. This is further evidence of the strikingly strong interconnection between the 2012 and 2001 scores. In order to test the extent to which the 2001 scores can explain the 2012 scores, we conducted an OLS regression analysis with the 2012 values as the dependent variable and the 2001 values as the independent variable. This analysis showed that the 2001 scores explain around 89 per cent of the variance of the 2012 scores.Footnote 2
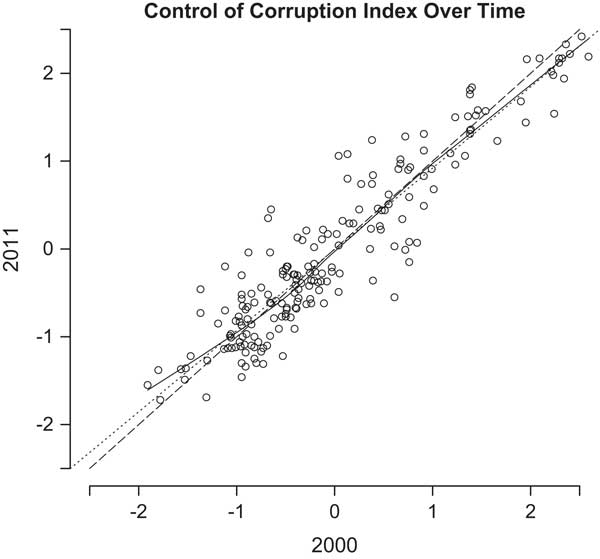
A parallel exercise using the CC index from the WGIFootnote 3 produces strikingly similar results (see Figure 2). In this case, there is a very strong linear relationship between 2011 and 2000 scores, and again the regression line, the y=x line, and the LOWESS smoothed line are all very close to each other. In this instance, the OLS regression analysis we conducted shows that about 86 per cent of the variance of the 2011 score is explained by the 2000 score.Footnote 4 This demonstrates remarkable consistency over time, especially given the inherent measurement error associated with perception-based measures. Indeed, these findings for both the CPI and the WGI suggest essentially no substantive change over time.
Countries’ worldwide governance indicators control of corruption scores in 2000 and 2011. The dotted line shows an OLS regression line fitted to the data. The dashed line shows the relationship when the y values are exactly equal to the x values. The solid line is a non-parametric (LOWESS) smooth line, which can take any shape in order to follow the data. Source: authors’ own calculation.
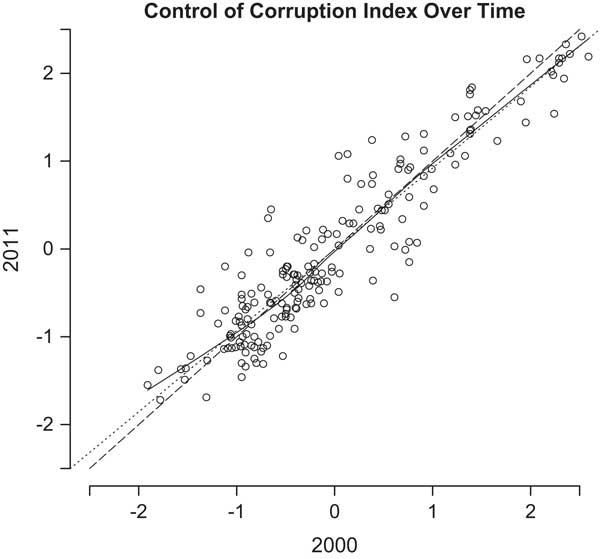
This lack of change, far from being comforting, suggests that observed fluctuations in the CPI and the WGI on a year-to-year basis are likely to be misleading, both in terms of policy discussions and as a resource for research. While it is the case that scores in these indices vary from year to year, and therefore so do positions in the rankings, these changes cannot sensibly be viewed as part of a systematic change. Indeed, only 10–15 per cent of the variance within the 2011 or 2012 scores is not directly explicable by the scores from 11 years before. This variance is the sum total of both the error variance from all sources and the substantive variance; thus, even if the error variance is zero (an implausible assumption), there is little room for substantively important changes. Thus, TI’s occasional assertions that some changes are (statistically) significant from one year to another are likely to be even more misleading in this context. Although some scores do move in a statistically significant way, this would be expected purely as a result of random error for 5 per cent of the cases. As the 2001 CPI featured 91 countries, and the 2012 index featured 174, somewhere between five and ten of the scores would be expected to be significantly different from the preceding year at the 0.05 level as a result of random chance, even if the true value had not changed at all. Taking a view over an 11-year period suggests that such changes could certainly be random fluctuations. This finding also suggests that there is no reason for such indices to be conducted on a yearly basis, save for the desire to generate publicity. Indeed, this analysis suggests once every 10 years would be more than sufficient.
It is noteworthy that, in May 2011, Global Integrity (an independent non-profit organisation that seeks to promote accountable and transparent government) decided to remove from its website the Global Integrity Index, which had ranked countries according to the effectiveness of their anti-corruption measures. It cited as part of the reason that it was:
a conscious attempt to reinforce a key belief that we have come to embrace after many years of carrying out this kind of fieldwork: indices rarely change things. Publishing an index is terrific for the publishing organization in that it drives media coverage, headlines, and controversy. We are all for that. They are very effective public relations tools. But a single number for a country stacked up against other countries has not proven, in our experience, to be a particularly effective policy making or advocacy tool. Country rankings are too blunt and generalized to be “actionable” and inform real debate and policy choices. Sure, they can put an issue on the table, but that’s about it. (Global Integrity 2011)
One implication of the foregoing discussion is that, for large aggregate indicators like the CPI or the WGI, a gap can be identified between the concept and its measurement (Andersson and Heywood Reference Andersson and Heywood2009; Langbein and Knack Reference Langbein and Knack2010). Particularly important is the finding that the indicators of the concept of corruption do not always relate systematically and reliably to how they have been defined conceptually (Arndt and Oman Reference Arndt and Oman2006; Langbein and Knack Reference Langbein and Knack2010, 351). Moreover, the cross-pollination of assessment criteria, a lack of transparency, the use of data from different and potentially incompatible sources, and the potential for a tautological relationship between the dependent and independent variables all pose serious methodological problems. Such methodological problems could potentially have a substantively significant effect, not only upon research findings, but also in regard to effective policy formulation.
Hawken and Munck (Reference Hawken and Munck2009) provide a detailed examination of the CPI and Consumer Confidence Index (CCI) between 1995 and 2009. Their paper focuses on two methodological choices that fundamentally affect the measures. The first is the type of source used to generate indicators. Five (nominal) classes of evaluators (i.e. sources) are identified:
[T]hose that rely on i) expert ratings by a commercial risk assessment agency, ii) expert ratings by an NGO, iii) expert ratings by a multilateral development bank (MDB), iv) surveys of business executives, and v) surveys of the mass public. (Hawken and Munck Reference Hawken and Munck2009, 8)
It is shown that some evaluators are stricter than others in their criteria, thereby generating a systematic margin of error both within and across countries and regions. Thus:
[a]s the analysis of indicators shows, a substantial amount of variation in reported levels of corruption is not attributable to variation in actual corruption or to random measurement error but, rather, is driven by the choice of evaluator and hence is an artefact of the method selected to measure corruption. (Hawken and Munck Reference Hawken and Munck2009, 12).
While in the paper the critique is focused primarily upon the CPI and CCI, the conclusion poses a challenge for all corruption measures. If different evaluators of the same phenomena produce different results here, they are likely to elsewhere, too. This problem does not have an easy solution and should caution those working with such measures to consider the ultimate source of the data to a far greater extent than is currently common. One putative solution to the problem, however, is to aggregate a large number of types of evaluators, thereby systematically reducing the impact of random noise in the data. This is the second methodological choice that Hawken and Munck (Reference Hawken and Munck2009) consider.
The process of combining multiple (weighted) indicators was put forward as a way to reduce the measurement error of the individual indicators. Specifically, Kaufmann et al. (Reference Kaufmann, Kraay and Mastruzzi2007, 557; 2008, 13) argued that, by putting different individual indicators into common units through a linear and additive aggregation rule, it is possible to measure corruption between countries much more accurately than any single measure could. However, this process “hinges on the assumption that the error in the indicators is random as opposed to systematic and independent across sources” (Hawken and Munck Reference Hawken and Munck2009, 13). To the extent that the evaluator of the raw data does have a systematic effect, such assumptions are unfounded.
Such potentially confounding methodological issues are not the only challenges posed by such use of amalgamated data. As Apaza (Reference Apaza2009, 141) has noted, by collapsing different data sources – often selected only on the basis of convenience rather than theoretical justification – the aggregation model is unable to offer any nuance on the nature, category or concept of corruption. To the extent that evaluating the nuances of corruption is theoretically relevant for analyses, this is a serious limitation. As a result, we cannot be sure of the underlying validity, i.e. what we are actually measuring. Even if a high correlation exists between corruption measures, this is by no means indicative of validity.
Similarly, Urra (Reference Urra2007) has identified three problem types that persist in the main aggregate measures of corruption: (1) the perception problem; (2) the error problem; and (3) the utility problem. The perception problem is the large margin of error created when subjective indicators are used to produce complex statistical constructions that can easily create an illusion of quantitative sophistication. The error problem refers to both the internal margins of error already contained within the various sources of corruption data and errors relative to the concept itself; thus, corruption research confronts not only sampling errors inherent to social science research, but also the fact that any proxy for corruption must be imperfect by definition. The utility problem refers to the gap between measurement and solutions – the criticism being that overly broad corruption assessments are difficult to convert into concrete anti-corruption initiatives.
Indeed, Zaman and Rahim (Reference Zaman and Rahim2008, 11) argue that perception-based measures are actually antithetical as a means of combating corruption, because factors that have little to do with underlying realities can strongly influence perceptions. This, therefore, becomes both a measurement and validity problem. While the reliability of perception-based measures may not be overly problematic (in the sense that they reliably produce the same or similar results at different measurement points), the validity problem remains. Thus, we cannot assume at face value that a reliable measure is actually a reliable measure of corruption. If the indicator primarily tracks something other than the actual level of corruption in a society, it would not be a valid measure of corruption itself.
Non-perceptual measures
If the main subjective measures of corruption suffer from a range of difficulties that make a straightforward interpretation difficult, the question naturally arises as to whether there are practical alternatives. Can we develop forms of measurement that will provide an evidence-based estimation of the level of corruption in countries using non-perceptual data?
One such attempt, focused on Italy, is by Golden and Picci (Reference Golden and Picci2005) who provide an analysis of “missing” physical infrastructure in each Italian region. In order to measure missing infrastructure, they compare existing infrastructure with the total monetary investment in each region. Infrastructure is missing to the extent that it should exist given a specific capital outlay, but in practice, does not. Golden and Picci attribute this gap to corruption. While the measure cannot specifically differentiate between corruption and inefficiency (Golden and Picci Reference Golden and Picci2005, 41–42), this is only a bias in the measure to the extent that (1) any inefficiency is genuinely not related to corruption and (2) some regions are significantly and systematically more or less efficient than others, again for reasons entirely unrelated to corruption. Ultimately, as Golden and Picci (Reference Golden and Picci2005, 42) note, such assumptions are plausible but cannot be proved. Notwithstanding that, the measure is a useful non-perceptual quantification of the scale of corruption within different Italian regions. Under the corruption measure, scores below 1.0 indicate the presence of “lost” infrastructure, while scores above 1.0 indicate “additional” infrastructure given the monetary outlay. Thus, in Umbria (index score: 1.78), there is 78 per cent more public infrastructure than there would have been had the government paid the (national) average rate (Golden and Picci Reference Golden and Picci2005, 52–53). Similarly, in Campania (index score: 0.36), there is 64 per cent less public infrastructure than would have been available had the government been able to purchase the infrastructure at the national average rate (Golden and Picci Reference Golden and Picci2005, 53).
In a similar vein, Olken (Reference Olken2009) constructed a “missing expenditure” measure of a road-building project in rural Indonesia by using engineers to estimate the prices and quantities of inputs for the road and comparing these to official village expenditures and the perceptions of the villagers themselves. Focusing on Latin American data, Seligson (Reference Seligson2006) studied victimisation surveys designed to gather information on specific government departments or officials. This information, which provides a measure of the first-hand, indirect exposure to corruption, can be compared with perceptions of the extent of corruption. In both Indonesia and Latin America, while the findings suggest perceptions do relate to the underlying extent of corruption, they are seen as a highly imperfect measure (Seligson Reference Seligson2006, 389–391; Olken Reference Olken2009, 963).
The EBRD-World Bank Business Environment and Enterprise Performance Survey, which examines the quality of the business environment, includes questions that probe firm managers’ estimates of the scale of unofficial payments, such as bribes paid to public officials “in your line of business” (Andvig Reference Andvig2005, 26; Andersson and Heywood Reference Andersson and Heywood2009, 756). However, while business firm-level data may be useful and would likely be much closer to tapping first-hand accounts of corruption, they remain an imperfect way to transcend the limitations of perceptions-based measures. Indeed, such questions continue to ask for perceptions-based responses, albeit ones that are ostensibly indirectly experience-based perceptions (Andvig Reference Andvig2005, 26). The International Crime Victim Survey also probes direct experience of corruption by questioning whether public officials have asked for or expected bribes from the respondent in the preceding year (see Svensson Reference Svensson2005, 23). While this again may be challenged, insofar as it is based upon what respondents remember and how they judged whether an official expected a bribe, it provides data that should reflect (even if not precisely indicate) the objective rate of corruption.
A different approach, which has occasionally been used within the United States, is to measure corruption through the rate of criminal convictions of public officials for corruption-related crimes (see, e.g. Goel and Rich Reference Goel and Rich1989; Glaeser and Saks Reference Glaeser and Saks2006). This approach has the advantage of providing hard data about proven instances of corruption and related crimes, but still suffers from a number of serious limitations that render it of more marginal utility from a comparative perspective. First, such measures make the assumption that an adequate list of crimes can be elaborated such that the measure is not solely dependent upon a very specific conceptualisation of corruption. If, for example, bribery is the only crime considered (as in Goel and Rich Reference Goel and Rich1989), the measure cannot be assumed to reflect wider corruption concerns. Second, such measures fail to capture the severity of corrupt actions. Indeed, under such a measure, an official convicted of taking a bribe of $500 is treated identically to an official convicted of taking a bribe of $5,000,000. Third, such measures assume that the probability of the same act being prosecuted does not vary between administrative districts. This is a significant problem within countries, as different public prosecutors may have different interpretations of the point at which it is in the public interest to proceed with a prosecution for unethical behaviour. Yet, a far larger problem is encountered when trying to construct such a measure on an international scale. Indeed, corrupt jurisdictions may deliberately avoid prosecuting corruption activities committed by those who retain the favour of the prevailing authorities. In such circumstances, the lack of convictions is, in fact, the consequence of corruption. Finally, such measures can create perverse incentives against reducing corruption: a concerted effort to tackle corruption will almost always result in more convictions for corruption-related crimes, at least initially, thereby suggesting a high rate of corruption in the country in question. From a public policy standpoint, this is at best a highly problematic consequence.
While such non-perceptual analyses remain relatively rare in many areas that we would include under the term “corruption”, they are becoming increasingly common in the analysis of electoral fraud. As Breunig and Goerres (Reference Breunig and Goerres2011, 535) note, such analyses have taken three main forms: (1) soliciting first-hand reports of experiences of procedural violations in a manner not dissimilar to the International Crime Victim Survey (see Svensson Reference Svensson2005, 23); (2) using regression-based approaches to predict the district-level expected vote for each candidate and subsequently investigate statistical outliers; and (3) attempting to exploit mathematical features of numerical distributions in an attempt to identify deviations from expected distributions under the assumption that there is no fraud. Of these approaches, the third has become increasingly common, especially in the last 5 years. The advantage to such an approach is easily elaborated: if a suitable model can be found, electoral corruption or malpractice can be detected reliably with little more than officially released data. This is especially important in those circumstances where detailed information at the sub-national level about previous electoral results and the voting public is not available (Beber and Scacco Reference Beber and Scacco2012, 211), as regression-based approaches cannot function adequately. Moreover, in authoritarian and quasi-authoritarian regimes, it is sometimes impossible or unadvisable to conduct requisite case studies and interviews to confirm corruption, which undermines the utility of individual reporting and regression-based models.
Several approaches have been taken to implementing mathematical models for the study of corruption. These have mostly been applied in the field of electoral fraud, in part because of the availability of data reporting the vote percentages for candidates, often by region or electoral district. An influential strand of this research has focused upon the application of “Benford’s law” to electoral returns. Benford’s law observes that, in many numeric distributions, smaller digits within the individual numbers themselves are more common than larger digits (Deckert et al. Reference Deckert, Myagkov and Ordeshook2011, 246). While this seems counter-intuitive, as we may expect individual digits within numbers to be uniformly distributed (Deckert et al. Reference Deckert, Myagkov and Ordeshook2011, 246), there are mathematical reasons for expecting such a relationship in at least some circumstances. Specifically, within electoral fraud evaluations, the focus has been upon so-called “second-digit Benford’s law” (2BL) tests, which apply essentially the same logic as the general Benford’s law specifically to the second digit of electoral return numbers (see Mebane Reference Mebane2006a, Reference Mebane2006b, Reference Mebane2011; Breunig and Goerres Reference Breunig and Goerres2011; see also Beber and Scacco Reference Beber and Scacco2012; but cf. Deckert et al. Reference Deckert, Myagkov and Ordeshook2011). The argument here is that, if votes are rigged, the “natural” processes that would be expected to generate Benford distributions in the second digit of electoral return distributions will not operate. This, in turn, leaves detectable differences between the observed and expected distributions, which are evidence of some form of fraud or mismanagement (Mebane Reference Mebane2006a, Reference Mebane2011).
However, the validity of 2BL tests has recently come under serious attack. Most notably, Deckert et al. (Reference Deckert, Myagkov and Ordeshook2011) argue that the use of exponentially distributed districts may not be ideal circumstances for such an application, and that the lack of any serious theoretical underpinning to 2BL tests means that it is difficult to know where it ought to apply. More damagingly, when applied to genuine electoral outcomes where first-hand reports indicate that fraud is known to have occurred, 2BL tests still produce, at best, seriously misleading results (Deckert et al. Reference Deckert, Myagkov and Ordeshook2011, 253–259). While this critique has been criticised by Mebane (Reference Mebane2011), who more than anyone developed the 2BL test, Deckert et al.’s conclusions remain a serious challenge to easy interpretations of 2BL evaluations.
Notwithstanding the noted problems of 2BL tests, attempts to formalise measures of electoral fraud and corruption based upon objective features of mathematical distributions have continued. In particular, efforts have been made to exploit human psychological biases towards certain numbers and patterns when creating fictitious electoral counts (Kalinin and Mebane Reference Kalinin and Mebane2010; Mebane Reference Mebane2011; Beber and Scacco Reference Beber and Scacco2012). This can be seen, albeit fairly weakly, in digit repetitions within numbers (Beber and Scacco Reference Beber and Scacco2012, 226–229). However, much more strongly, fraudulent electoral counts tend to systematically over-represent the number “0” in the final digit of counts (Kalinin and Mebane Reference Kalinin and Mebane2010, 6–7; Mebane Reference Mebane2011, 270–271; Beber and Scacco Reference Beber and Scacco2012, 224). While this may be a result of laziness on the part of electoral officials, Beber and Scacco (Reference Beber and Scacco2012, 229–230) argue that the specific relationships between party vote counts and total vote counts point away from benign rounding-off of electoral results. This relationship has been seen in several different electoral contexts where corruption is likely to have occurred (e.g. Russia, Senegal and Nigeria), but crucially not in situations in which we would not expect electoral fraud (e.g. Sweden) (see Kalinin and Mebane Reference Kalinin and Mebane2010; Beber and Scacco Reference Beber and Scacco2012). Interestingly, Kalinin and Mebane (Reference Kalinin and Mebane2010, 4–7) suggest that the frequency of zeros is actually by design as a way for officials to signal to members of the government that they are sufficiently loyal enough to the government to fix elections.
The application of mathematical principles to other areas of corruption research is far rarer, although some examples do exist. Indeed, Benford’s law itself (specifically first-digit Benford’s law) has been applied to the governmental economic data of European countries, with the results casting doubt on the integrity of economic reporting in Greece, Romania, Latvia and Belgium (Rauch et al. Reference Rauch, Göttsche, Brähler and Engel2011, 253). Whether financial data is more amenable to Benford-type analyses than electoral data remains open to question. However, the ability of such an analysis to highlight countries that, for the most part, also score poorly on subjective measures provides some argument in their favour.
Ultimately, given that corruption is a clandestine activity, objective measures must assume that deviations from an expected distribution are evidence of corruption, rather than being indicative of very specific local circumstances. Where the measures are better, this assumption is underwritten by a strong theory that can be used to justify the measure, although such theory is essentially absent for Benford-type analyses of electoral data (Deckert et al. Reference Deckert, Myagkov and Ordeshook2011; Mebane Reference Mebane2011). Indeed, evaluations of objective measures often fall back on exactly the same subjective data that the objective measures are supposed to be a substitute for – or worse, rely on innuendo and received wisdom about the level of corruption in a country. It may be more fruitful to compare new objective measures with bespoke perception-based surveys, which can focus in detail upon a specific geographical and sectorial area (see Olken Reference Olken2009). Unfortunately, it is only in rare certain circumstances that large differences between objective measures and corruption perceptions can be easily explained in terms of one measure being correct. Objective measures are at their most believable when they are backed by official investigations that are capable of detecting corruption first-hand.
While non-perceptual measures (of all kinds) have been gaining traction in recent academic research, they still suffer from some fundamental weaknesses. Many of these measures face similar problems to the perception-based measures discussed above: how to define corruption, distinguish between different types of corruption, define the seriousness of particular instances of corruption and apply a final ranking or score to cases. Moreover, the potential scope of genuinely objective corruption measures is narrower than subjective measures. All mathematical measures discussed here rely on access to detailed data that, in many sectorial areas, is unlikely ever to be made available. Moreover, sufficiently motivated corrupt officials can more easily develop counter-measures to this form of corruption measure, such as – in the case of electoral fraud – changing only the first digit of electoral counts and thus bypassing both 2BL tests and evaluations of last-digit frequency (see Beber and Scacco Reference Beber and Scacco2012, fn 30). Experience-based measures suffer less in this final regard, but they still require honest reports from people with first-hand experience; in the case of grand corruption, where specific oversight may more easily be avoided, such reports may simply not be forthcoming.
When two worlds collide: action versus analysis
In its Users’ Guide to Measuring Corruption (2008), the UNDP insists that, notwithstanding myriad problems, corruption can be measured. Their injunction is to “know your data”, but, given the difficulties generated by the large-n aggregate indicators as discussed above, they also argue in favour of localised indicators developed in-country by local stakeholders rather than international or external actors. Such metrics are, by some standards, quite limited: they have little or no international coverage, are often purely qualitative and may not be continued from year to year. However, highly localised indicators that are customised to national or sub-national needs have the significant advantage of being designed from the beginning to yield actionable data (UNDP 2008, 43).
Despite all the stress policy-makers and anti-corruption activists place on the need to develop actionable data, the record of achievement in this regard is questionable to say the least. In spite of a raft of anti-corruption initiatives and legislation at both national and international levels over the last 15 years or so – including the United Nations Convention Against Corruption, various international and regional anti-bribery conventions, conferences, agreements, a bourgeoning anti-corruption industry and even an international anti-corruption day – there are few signs in many countries that the scale of the problem is diminishing. Corruption remains as widespread today, possibly even more so, as it was when concerted international attention started being devoted to the issue following the end of the Cold War. Indeed, to the extent that the CPI and the WGI offer any insight at all into the level of corruption across the world, they suggest stasis at best.
How can we explain the failure to address one of the most pressing public policy challenges facing governments across the world? Our contention is that there are two main, inter-linked reasons. First, academic research has struggled to develop an adequate conceptualisation of corruption, which recognises the complexity of the concept, its rootedness in certain ways of thinking about the nature of politics, and its relationship to social and economic exchange – factors that call for a sophisticated understanding of why and when it occurs. There are genuine academic difficulties here, even if a great deal of research has ignored these in the search for quantifiable indicators of corruption that can then form the basis for statistical analysis. In this sense, the multifaceted nature of corruption makes relatively simple conceptualisation under a unified concept of corruption difficult and developing a set of unified indicators near impossible.
Second, in seeking “actionable answers” to the problem of corruption, policy-makers, anti-corruption activists and the anti-corruption industry have been reluctant to engage in what can be seen as arcane academic debates about nuance, complexity and specificity. Moreover, some parts of that industry have themselves been sucked into a politicisation of corruption, which compromises the policy process and subverts the basis for non-partisan programmes to address corruption. Policy therefore remains insufficiently informed by relevant research, while academe often misses opportunities to learn from natural experiments and the experience of policy implementation in the field. Both the academic and policy communities rarely recognise the internal political economy of anti-corruption – for example, how donor agencies struggle with delivering a “zero tolerance” approach to corruption that appeals to their domestic constituents in aid recipient countries characterised by systemic corruption, weak institutions and particularistic politics.
In anti-corruption programmes, which depend heavily on access to resources, there has been a powerful emphasis on demonstrating impact in order to justify continued investment. Corruption might thus be seen as a classic example of a “wicked problem” (Rittel and Webber Reference Rittel and Webber1973). Despite increasing research highlighting the inherent complexity of corruption, the “results agenda” creates incentives for policy-makers to favour simplistic anti-corruption programmes focused on outputs rather than outcomes and encouraging reliance on what is more easily measured but not necessarily the most impactful or the most transformative.
However, the problems of creating useful corruption measurements are also more explicitly theoretical; indeed, research “is limited by the lack of a rigorous conceptual framework since it is not clear how to identify a corrupt act or how to generate an aggregate corruption measure” (Foster et al. Reference Foster, Horowitz and Mendez2009, 2). Of specific note are the cultural asymmetries in understandings of corruption; thus, there exist cross-cultural asymmetries in deciding when an act is putatively corrupt and when it is not. This suggests that research exploring both subjective and objective indicators is best suited to sub-national studies, a methodological caveat that precludes using the same strategy for national-level and wider comparative measures (Golden and Picci Reference Golden and Picci2005). Given that most corruption takes place in local contexts, it is questionable why so many measures focus on the national level.
A possible alternative proposed by Johnston (Reference Johnston2006) is not to measure corruption across whole societies, but rather to focus upon transparent indicators of specific effects of corruption and the incentives that sustain them. Starting with specific agencies, different levels of government and official processes would, it is argued, be better suited to tracking change over time. Moreover, such an approach would allow for a far more nuanced view of corruption both within and between countries. Suppose that country “x” has a high degree of corruption within its police force, yet essentially no corruption within its health sector; and, suppose that country “y” has a high degree of corruption within its health sector and essentially no corruption within its police force. In this situation, the aggregate question of “which country is more corrupt” becomes not only meaningless, but actively unhelpful. Feasibly, both countries may have identical ratings on an aggregate country-level indicator (such as the CPI), and yet the lived experience of the citizenry, and crucially the ability of the country to respond to the corruption, varies wildly (van der Vleuten and Verloo Reference van der Vleuten and Verloo2012, 83). Corruption in the health sector may be a tragedy for ordinary citizens (for a particularly vivid example, see Rothstein Reference Rothstein2011, Chapter 3). Yet, without a reliable system of law, order and justice, a country’s ability to respond to corruption at all is minimal. However, it must also be noted that a possible pitfall of this can be the instrumentalisation of action indicators. Trumpeting a particular policy area or sector can create a reform illusion, where direct measurement of a particular area of corruption concern (e.g. civil service) is taken as a proxy for action more widely, with concomitant effects on perception.
Conclusion
This paper has sought to provide a review of different approaches to the measurement of corruption. Although both academics and practitioners have a shared interest in developing effective measurements, their motivations and rationale for doing so differ, with far-reaching implications. The implication of unhelpful measurements for both practitioners and – more importantly, citizens – is indeed serious. When decisions about aid spending or investment can be based upon perceived levels of corruption (Andersson and Heywood Reference Andersson and Heywood2009, 758; van der Vleuten and Verloo Reference van der Vleuten and Verloo2012, 81), there is a moral imperative that our measurement tools are as helpful as possible. Yet, there are also serious academic implications. If the goal of academe is to understand the world in which we live and to make it interpretable, it is important that our analyses reflect how the world actually is.
We have argued that both perception-based and non-perceptual approaches to measuring corruption suffer from some serious limitations. In the case of the former, the principal drawbacks are that perceptions are not necessarily a good reflection of either experience or reality, as they may reflect factors or concerns that are not necessarily about corruption and cannot distinguish between different types of corruption, nor between corruption in different sectors. Of particular note, we showed that there has been virtually no substantive change to two of the main perception-based measures of corruption over a period of more than a decade, a finding that seriously undermines their utility as analytic tools.
In regard to non-perceptual approaches, the key drawbacks relate to difficulties in developing measures that can be utilised across different jurisdictions – especially those where access to reliable data is problematic, which may itself be the result of corruption. Ultimately, for both perception-based and non-perceptual measures, the core issue is a gap between the very conceptualistion of corruption (how it is defined, how we distinguish between different types) and its measurement. Moreover, the focus on measuring corruption at the national level and producing league tables or other rankings is always likely to be misleading: corruption takes place in specific sectors and contexts – local, regional, national and increasingly, transnational – and that very variation is one of the key reasons that it is so difficult to develop appropriate measures. Yet, for the reasons outlined above, it is important that we continue to seek to develop useful and appropriate measurements of corruption. For now, that remains a Sisyphean task.
Acknowledgements
The authors are grateful for very helpful comments from the editor, Peter John, and the anonymous referees. This article also benefited from several discussions with Staffan Andersson, Liz Dávid-Barrett, Cees van der Eijk, Alena Ledeneva, Heather Marquette, Jan Meyer-Sahling, Alina Mungiu-Pippidi, Mark Philp, Bo Rothstein and Davide Torsello.