Discussions of the woes of governance in China almost never fail to criticize the mounting size of the party-state bureaucracy.Footnote 1 Before market reforms, the party-state apparatus was said to be “not only gigantic and unwieldy, but also highly stratified.”Footnote 2 Following reforms, the bureaucracy grew even faster. Its growth is reportedly “staggering” compared to other matured market economies.Footnote 3 “State sprawl” in the countryside triggered peasant burdens and protests.Footnote 4 Administrative bloat “ate up most available resources” and contributed to severe township debts.Footnote 5 Some argued that bureaucratic overstaffing represents weakened state capacity in the country.Footnote 6
Is China's public bureaucracy overstaffed?Footnote 7 Although the issue of bureaucratic bloat has been subject to popular censure in the scholarly literature and media, few have provided thorough empirical analyses of China's public employment size.Footnote 8 Previous studies, while laying important groundwork, have been limited to case studies of one or a few localities, or national-level descriptions based on publicly available statistical yearbooks and press reports. Yet, to evaluate objectively if the Chinese bureaucracy is overstaffed, we need to accomplish three basic tasks.
First, we need to specify the meaning of the generic term public employment in the contemporary Chinese context and in view of administrative reforms in the last decade. Providing such a definitional framework is necessary to situate China in comparative discussions. Second, we need to evaluate the range of sources available for measuring public employment size and to decide which is most appropriate for analysis. Third, we need to compare the Chinese bureaucracy with that of other countries and to disaggregate patterns of public employment growth within China. After all, size is relative. If one claims that China's bureaucracy is “too big,” then one needs to show that other national bureaucracies are indeed smaller.
This article aims to accomplish all three of the above. Additionally, by drawing on extensive fieldwork and interviews,Footnote 9 it clarifies the variance between bianzhi 编制 (formally established positions) and actual staffing size. It also identifies local permutations of the bianzhi system, including chaobian 超编 (exceeding the bianzhi), jiebian 借编 (borrowing bianzhi), hunbian 混编 (mixing bianzhi) and kunbian 捆编 (combining two bianzhi in one member of staff). An understanding of the public staffing system is important before interpreting and measuring Chinese public employment.
A few caveats are in order before proceeding. First, I refer to “cadres” in the title to reflect the common usage of the term “cadres” (ganbu干部) in the Chinese literature. However, later in the analysis, I show how the transformed meaning of cadres, following market reforms, has complicated the task of “counting cadres.” Second, while there are several dimensions to public sector size in the mainstream literature, my focus in this article is on China's public employment size.Footnote 10 An obvious reason for this is that bureaucratic overstaffing has been a prominent issue in social science and popular discussions. For decades, the central government has been trying to downsize public personnel. Public employment size has also been used by scholars to develop broader theoretical arguments, such as state capacity, corruption and political patronage.Footnote 11 That said, for those who are interested, I have elsewhere analysed the scale of public and administrative spending in detail.Footnote 12 Third, limited by space, I do not discuss regional variation of public staffing levels. There is in fact much theoretically interesting variation, but this is also pursued in a separate article.Footnote 13
The article begins by introducing the general definition of public employment and then provides a framework for the Chinese context. Next, it discusses some data sources available for measuring public employment, particularly previously unused ones, as well as each of their pros and cons. I suggest that the best available national data are those compiled by the Ministry of Finance and the Central Organization Department. The article then discusses in qualitative detail the public staffing system. Importantly, I explain why we need to distinguish between officially authorized and actual staffing levels, and use some new descriptive statistics to estimate the extent of chaobian. The following section compares China's public employment size to that in other countries. I find that China's net public employment size per capita is actually below the international mean. However, the level of public employment has steadily increased over the years, despite repeated downsizing campaigns. Furthermore, such expansion had been heavily concentrated at the sub-provincial levels and in the shiye danwei, what I call extra-bureaucracies.
Defining Public Employment in the Chinese Context
In order to place China in comparative light, this article employs the generic term “public employment” to refer to personnel employed by the public administration sector. Analysts face significant methodological challenges in measuring public employment across countries because there is no universal definition.Footnote 14 That said, most existing analyses of public sector employment exclude personnel in the military and state-owned enterprises and count only those working in public bureaucracies, including ministries, regulatory agencies and public service providers like schools and hospitals. The reason for this norm of definitional scope is that military and state-owned enterprises are managed very differently from public bureaucracies, and further, data on military personnel are generally lacking.
According to the common definition of public employment, then, who should be counted as a public employee in China? Is the Chinese concept of “cadres” equivalent to public employees? Is the more modern term “civil servants” equivalent to cadres and to public employees?
Let us first consider the meaning of cadres. As Doak Barnett explained in his classic study of the bureaucracy, the concept of cadre grew from the revolutionary movement, and cadres were seen as the leaders of the masses.Footnote 15 However, following the CCP's state-building efforts, the concept shifted beyond the revolutionary context and into one of bureaucratization. As such, Hung-Yung Lee wrote, “the current Chinese concept of cadre includes two analytically distinct categories: the political elite and the functionaries staffing the huge party-state apparatus.”Footnote 16 Much of the recent literature continues to use the term “cadres” because, as Barnett pointed out decades ago, this is a stratum of individuals distinguished from the masses by their power and authority.Footnote 17 During the socialist days, cadres broadly included officials in the Party and state organs, local commune and team leaders, and non-administrative personnel, but excluded military officials and workers in production units.Footnote 18
Modernization of the Chinese administration in recent years has refined the previously fuzzy and revolution-based concept of cadres. Most significantly, the passage of the Civil Service Law in 2006 created a formal category of public personnel known as civil servants (gongwuyuan 公务员). West European governments established civil services over a century ago.Footnote 19 In comparison, the Chinese civil service is in its infancy. Civil servants form the elite strata of functionaries in the party-state hierarchy. They usually assume administrative or leadership roles. The remaining public personnel are formally titled shiye renyuan (personnel of the shiye units 事业人员).Footnote 20 Civil servants and shiye personnel are each managed by a different pay and promotion scale. Nevertheless, in practice, as shown below, the line between civil servants and non civil servants remains blurred.
To answer the questions posed earlier, the generic term “public employee” is premised on the establishment of a politically neutral, modernized public administration. Thus, “cadres” is not synonymous with public employees, though their scope is roughly similar, as the former reflects a revolutionary setting unique to communist regimes like China and the former Soviet Union. “Civil servants” can be understood as an elite sub-group among personnel working in the party-state apparatus. Not all public employees in the contemporary context are civil servants.
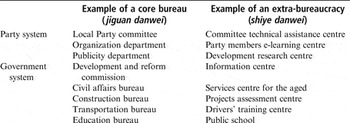
So who would count as public employees in the contemporary setting? We would include all personnel serving in the Party (dang 党), government (zheng 政), subsidiary (shiye 事业), and Party-run social (shetuan 社团) organs, but exclude the military and state-owned enterprises. To elaborate further, units in the Party and governmental hierarchies can be divided into two kinds: core bureaus (jiguan danwei 机关单位) and extra-bureaucracies (shiye danwei 事业单位).Footnote 21 Core bureaus are responsible for political, administrative and regulatory work. They are organizations that appear on formal organizational charts. Each core party-state bureau has a cluster of subsidiary extra-bureaucracies attached to them that perform a range of delegated tasks such as administration, public services provision and commercial activities.Footnote 22 Extra-bureaucracies can be fully or partially state-funded or wholly self-funded. It is thus the case that not all public employees in China are on the official state payroll.Footnote 23 Table 1 gives examples of bureaus and extra-bureaucracies.
Examples of Core Bureau and Extra-Bureaucracies
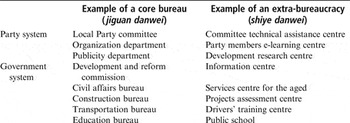
Source: City-level personnel bureau based in Jiangsu.
From a comparative perspective, the scope of Chinese public employment is unique in several respects. First, whereas political parties and bureaucracy are separated in matured democratic systems, the Chinese bureaucracy has two parallel lines of authority: the Party and the government. Thus, those who work in Party organs count as public employees. Second, the Party operates a number of social (or mass) organizations, like the Communist Youth League and Women's Federation.Footnote 24 Those who serve in these organizations are not members of an autonomous civil society; they are part of the bureaucracy. Third, not all public employees in China are state-funded. One can work for a bureau or extra-bureaucracy without receiving budgeted funds, or only a portion of them, for one's compensation. In these cases, the hiring unit has to generate funds outside budget allocations to finance the extra personnel.
Comparing Data Sources of Public Employment in China
Having defined the scope of public employment, we can now attempt to measure it. There are various data sources. Each provides a slightly different measure of “public employment.”
China Statistical Yearbooks
The most commonly used sources are the China Statistical Yearbooks (Zhonggguo tongji nianjian), published by the National Statistical Bureau, and the Labour Statistical Yearbooks (Laodong tongji nianjian).Footnote 25 These list the number of employees in broad categories of “Party, government and social organizations,” “education, culture and media,” “health, sports and social welfare,” and “social services.” While publicly available, these sources have shortcomings. They do not distinguish between publicly employed and privately employed personnel in each sector. So in “education, culture and media,” for example, private school teachers could be included and to count all the employees in this category as public employees would give an overestimate. Conversely, these sources can lead to underestimation. There are public bureaucracies and public employees in sectors like finance, real estate and transportation. They will be excluded from existing studies that employ the statistical yearbooks.
Statistics from the Central Organization Department
Another useful data source is the Organizational History Statistics (Zuzhishi ziliao), compiled by the CCP Central Organization Department. This provides a useful and reliable source on the number of “cadres” from the 1950s until 1998. In the Organizational History Statistics, the term “cadre” broadly includes non-worker-class personnel in the administrative and subsidiary sectors, as well as “technical workers” (jishu renyuan) in the bureaucracy. By checking this against other data sources, we can surmise that “technical workers” refer to low-level service personnel in the public bureaucracies, but not the workers in state-owned enterprises. This data source breaks down the number of cadres by region, rank, gender, Party membership and so on. However, a major drawback of this source is that it has not been updated since 1998.
Statistics from the Finance Authorities
The Ministry of Finance has two neibu (internally circulated) publications that contain statistics on public employment: the Local Financial Statistics (Difang caizheng ziliao) and City and County Financial Statistics (Dishixian caizheng ziliao). These two sources provide the most comprehensive coverage of public employment. Yet few have employed them. It should be noted that these two sources each measure a slightly different scope of public employment. The Local Financial Statistics measure “employment” (zhigong 职工) in the core and subsidiary units. Besides state-funded public employees, they include employees in “self-funded” (zishou zizhi 自收自支) extra-bureaucracies; these are units that are part of the party-state apparatus but do not receive any budgetary funding. On the other hand, the City and County Financial Statistics measure “fiscal dependents” (caizheng gongyang renkou 财政供养人口).Footnote 26 This refers to personnel who receive at least some wage funding from state budget allocations. That implies the Local Financial Statistics has a broader coverage than the City and County Financial Statistics.
Statistics by Local Personnel and Establishment Offices
At the provincial, city and county levels, some local personnel and establishment offices have issued internal publications on the bianzhi system and public employment. The benefit of these sources is that they typically list the number of bianzhi. This data source allows comparison of the number of officially established positions with actual levels of employment.
Other sources
Besides those sources listed above, previous reports also employed Chinese secondary literature, governmental directories and the state press. However, most of these sources date from the early 1990s. Bits of information gleaned from the state press are incomplete and lack reliability. Several books written by Chinese scholars claimed that the bureaucracy is grossly inflated, but with a surprising absence of systematic descriptive statistics and cross-national comparison.Footnote 27
The Bianzhi System versus Actual Staffing Levels
Central to analysing public employment in China is to clarify the bianzhi system. Simply put, the bianzhi is a system for determining the functions of government, the number of organs and the number of personnel employed in each organ.Footnote 28 Since 1949, bianzhi management has been rotated between Party and government in various bodies.Footnote 29 In 1991, central authorities created the central establishment commission and office (Zhongyang jigou bianzhi weiyuanhui bangongshi 中央机构编制委员会办公室), abbreviated here as the central establishment office. At the local levels down to the county, there is a parallel establishment office (bianban 编办for short) that manages the bianzhi.
In terms of staffing, every jiguan and shiye unit in the bureaucracy is allocated a bianzhi by the local establishment office. The bianzhi specifies the maximum number of officially established positions. It is divided into two types: administrative (xingzheng 行政) bianzhi and subsidiary (shiye 事业) bianzhi. In principle, the xingzheng bianzhi is reserved for administrative, planning or leadership posts, namely civil servants, whereas the shiye bianzhi applies to remaining public employees in the middle to low ranks such as technical workers, clerical staff and school teachers. According to personnel officials, xingzheng bianzhi is strictly controlled. The central establishment office decides a fixed quota for the entire hierarchy and then distributes this quota level by level. In contrast, shiye bianzhi is deliberately managed in a flexible system (dongtai guanli 动态管理).Footnote 30 The central government does not dictate a fixed number of shiye bianzhi for each level. Each province decides a criterion for itself. For example, in Shandong, a ratio system is used to determine the number of shiye bianzhi, such as X bianzhi for every Y number of patients treated by a public hospital.Footnote 31
The bianzhi functions as a staffing guideline and budgeting instrument. In terms of staffing, it provides a guide to the desired size of each public unit. For budgeting, bianzhi allows the finance authorities to determine the allocation of budgetary funds for personnel spending for each department.Footnote 32 In principle, the finance authorities should only take into account the bianzhi, and not the actual number of employees, when allocating funds. So, for example, if a bureau has a bianzhi of 15 but employs 25 personnel, the local finance bureau should only need to allocate funds to pay for 15 employees.Footnote 33 For the remaining staff, the bureau in question will have to appropriate its office budget (bangong jingfei 办公经费) or generate extra funds to finance them, typically from collecting fees and fines or by delivering profit-making services. However, in practice, there are instances where budgeting officials pay for personnel hired beyond the quota.
Chaobian: exceeding the bianzhi
Although the local establishment offices assign a bianzhi to every unit, they are often unable to enforce this guideline in practice. This leads to the notorious problem of chaobian, literally translated as exceeding the number of established posts. Chaobian is often cited but seldom explained. I asked local personnel officials for examples of it, which can take several forms.
The first kind of chaobian occurs when a unit reaches its bianzhi limit but continues to hire more. Hiring beyond the bianzhi can happen for valid and political reasons. There are numerous instances in which bureaucracies, especially public service providing units like schools and hospitals, need more personnel but do not have more bianzhi. There are also occasions when local leaders and department chiefs arrange positions for relatives and friends in the bureaucracy, thus forcing local units to chaobian.Footnote 34 Employees hired beyond the bianzhi are termed bianwai编外 (outside the bianzhi) personnel, and are typically funded using the hiring unit's self-generated revenue. As a local establishment office bureaucrat explained:
Bianwai personnel may or may not be on the state payroll. If the unit has its own income, it can use that income to feed the additional staff members. But our bianzhi control is stricter nowadays. Those who are not recognized by us [the establishment office] will also not be recognized by the finance office.Footnote 35
A second type of chaobian happens when a unit has not in fact breached its bianzhi, but claims that it has or inflates its bianzhi to extract more budgetary funding.
For example, a unit has bianzhi of 40. But when they submit a budget request, they claim that they have 60. So in this case, they chaobian by 20. Chaobian is something that happens when there is a failure of coordination between the Establishment Office and the Finance Bureau.Footnote 36
In a third situation, a public unit has its bianzhi cut during a downsizing exercise, and in consequence, there is chaobian even though the unit did not “over-hire.” Chaobian also results from central policies requiring local governments to absorb excess military personnel into local bureaucracies.
Historically speaking, for every round of organizational reform, the bianzhi will have to be compressed. A department may start with a 100 personnel, no chaobian. But with a new policy to reduce bianzhi, say by 10 per cent, chaobian will result.Footnote 37
Local governments have to absorb large numbers of demobilized military personnel (jundui zhuanye ganbu 军队转业干部). From 2005 to 2008, there was a major adjustment of military personnel. Each year, over 200,000 military cadres were transferred to local governments … These demobilized military personnel … 70 to 80 per cent of them enter core agencies to become cadres and occupy administrative bianzhi. So with each new batch of military personnel coming to us, there will be chaobian.Footnote 38
The case above is a warning not to jump upon chaobian as a sign of local corruption or bureaucratic bloat,Footnote 39 as such a phenomenon is sometimes a product of top-down downsizing and central policies rather than bottom-up overstaffing. There have been several rounds of bureaucratic downsizing in the post-Mao era. Each time, the bianzhi is cut but not necessarily the sum of personnel. When this happens, downsizing ironically creates chaobian. Moreover, it should be noted that existing bianzhi standards are too slow to adjust to growing and changing demands confronting local agencies and public service providers.Footnote 40 For example, officials in a county of Jiangsu reflected that the criteria for shiye bianzhi had not been updated for years and did not take into account a growing number of migrants when calculating the county's population. As a result, the bianzhi was set too low for public providers like hospitals to operate effectively, and chaobian became inevitable.Footnote 41
Bianwai personnel are not unique to the Chinese bureaucracy. Analogous situations are found in other countries. For example, in the European Union administration, although the number of civil service positions is fixed, fully budgeted and strictly enforced, agencies routinely hire additional “contract agents.” These agents are hired via three-year contracts which can be terminated if necessary, unlike civil servants, who are virtually impossible to fire.Footnote 42 Contract agents provide staffing flexibility and allow EU bureaucracies to get around formal hiring restrictions. A key distinction between the Chinese case and most bureaucracies, however, is that while contract agents are always paid by state budgets in the latter, Chinese local bureaus and extra-bureaucracies can generate extra-budgetary or taxless revenue (such as fines, fees, user-charges) to finance bianwai personnel and positions that are designated partially or wholly self-funded.
Many observers claim that chaobian is a widespread and serious problem in China. One author wrote that “chaobian could be as high as 50 per cent of formal bianzhi” and that “the number of chaobian personnel could easily reach several million.”Footnote 43 Others estimate the number of chaobian at around 600,000.Footnote 44 Such speculations are made without a clear basis and tend to suggest that chaobian is the result of local defiance against well-intended central policies.
A comparison of data on bianzhi and actual employment numbers can offer some solid indication of the extent of chaobian. Below, I compare two data sources on Fujian province in 2004. The first is the Fujian Organization and Establishment Yearbook (Fujian jigou bianzhi nianjian), published by the Fujian Provincial Establishment Office, which records the number of officially established posts. The second is the Local Financial Statistics, which records actual staff size by province, including those on the state payroll and those who are not. The comparison is summarized in Table 2.
Bianzhi, Actual Public Employment and Estimated Chaobian in Fujian Province, 2004

Sources: Total bianzhi and number of bianzhi filled from Fujian Organization and Establishment Yearbook; total public employment from Local Financial Statistics; estimated chaobian, author's calculation
According to the Provincial Establishment Office, the total bianzhi in Fujian province in 2004 was 863,102, while “the number of bianzhi filled” was 814,458. The latter term needs clarification. The bianzhi refers specifically to the maximum number of established positions. As we see in Fujian, they are not completely filled. But if bianzhi were still available, why would bureaus choose not to fill all of them? Bianzhi is valuable to local bureaucracies. Being included in the bianzhi lends public employees formal status and the privileges of a cadre (such as retirement funds). For the hiring unit, a bianzhi gives the right to bargain with the finance office for a bigger budget to pay wages. Hence, each department (and the establishment office) will usually try to keep some bianzhi vacant as “back-up.” This prepares them for when a new leader comes to office and demands new personnel to be added. Furthermore, in the event of downsizing, no one will have to be laid-off if there is surplus bianzhi.Footnote 45 That said, an excess of bianzhi does not mean that there is no chaobian. The finance authorities, as reflected in the Local Financial Statistics, recorded 1.2 million public employees in Fujian province. This implies that there are more than 300,000 public personnel who are bianwai (see Table 2). This presents a common paradox where there are surplus authorized positions alongside over-the-quota staffing.
In sum, the number of bianzhi and the actual staffing are not the same.Footnote 46 Hence, to measure China's public employment size in a meaningful way, we need to use data that gauges the latter rather than the former.
Other permutations of the bianzhi system
Besides the phenomenon of chaobian, there are other permutations of the bianzhi system that deserve elaboration. One of them is jiebian, meaning borrowing bianzhi. Here is an example of jiebian: a local education bureau has reached its bianzhi of 40 but needs more staff. Instead of hiring more using its funds, the bureau can “borrow” teachers from local public schools to work for it. The benefit of jiebian is that the borrowing unit will not breach its bianzhi and at the same time does not have to be financially responsible for excess personnel.Footnote 47 It is usually a higher-authority unit that borrows bianzhi from a subordinated unit. Another example I encountered is a county-level organization department borrowing bianzhi from the environmental protection bureau, which the latter could not resist as the organization department is a powerful bureaucracy that governs cadre appointments.Footnote 48 When understaffed, the lending unit is forced to employ bianwai workers, typically at its own expense.
Another common phenomenon is hunbian (mixing bianzhi). In theory, civil servants (who occupy administrative bianzhi) should work in core bureaus, and non civil servants (who occupy subsidiary bianzhi) should work in extra-bureaucracies. In reality, however, civil servants can sometimes work in extra-bureaucracies, and almost everywhere, there are shiye personnel who work in core bureaus and perform the same administrative tasks as civil servants, but do not share civil servants' formal status, privileges and pay scales. Why does this happen? As discussed, the CCP exercises tight centralized control over the number of administrative bianzhi. Thus, xingzheng bianzhi is scarce. To get around this, local bureaucracies have little choice but to use shiye bianzhi to fill spaces in the administrative units.Footnote 49 A problem with hunbian is that it creates a confusion of responsibilities within local bureaucracies. An even bigger problem is that shiye personnel who perform regulatory tasks do not have the legal authority to make or enforce administrative decisions and yet are tasked with such responsibilities.
A third permutation of the bianzhi system is kunbian (combining two bianzhi in one person). This describes a situation in which a public employee simultaneously occupies a xingzheng bianzhi and a shiye bianzhi. For example, a civil servant in a county legal affairs bureau occupied a xingzheng bianzhi in the agency and a shiye bianzhi in an extra-bureaucracy subordinated to the legal affairs bureau, the legal documentation centre. By doing so, he drew a civil service wage from the former position and bonuses from the legal documentation centre, which generated income. “To be honest, I made a tidy fortune,” he said. It appears, however, that this lucrative practice is being progressively phased out as part of local governments' rationalization efforts. The above-mentioned civil servant was eventually asked to choose among the two positions he held, and he chose to remain a civil servant because it was more secure.Footnote 50
Permutations of the bianzhi system reflect a broader trend of transition within China's public administration. In most public bureaucracies, it is easy to identify who a public employee is, which unit hired him or her, whether the position is authorized, and so on. Clarity of identities, roles and hierarchy is a defining feature of modern public bureaucracies, as Max Weber had pointed out.Footnote 51 In most public bureaucracies, such as the US, staff size is jointly determined by the personnel management office and budget office: departments submit a budget request indicating the number of full-time employees; the budget is sent to the legislature for approval and then enforced if approved.Footnote 52 China, however, is still in the process of creating a rational bureaucracy. Its budgeting processes remain immature and jumbled. As a World Bank report noted, “One of the unique features of the Chinese budgetary process, one which is left over from the planned economy, is that the budget drafting and staffing processes are disarticulated.”Footnote 53 Thus understood, various circumventions of the staffing system do not necessarily mean weak state capacity or loss of hierarchical control; they are necessary adjustments to cope with an obsolete bianzhi system and fast-changing demands on local bureaucracies.
How reliable are statistics on public employment?
Despite the transitional nature of China's public administration, we can and should still meaningfully discuss and measure public employment in the Chinese context. We need to provide a definitional framework for public employment in order to situate China in a broader set of cases and in the mainstream literature. Some may counter that existing data are not good enough to provide reliable measures. Indeed, the possibility of underestimation exists in even the best data sources because temporary and informally hired workers (linshigong 临时工) (such as drivers and janitors) are not included in official statistics.Footnote 54 Moreover, there are informal categories of substitute public employees, such as farmers-as-cadres (yi nong dai gan 以农代干),Footnote 55 which are even harder to count. Nevertheless, such difficulties happen not only in China but in all countries, including the US. In the American bureaucracy, there are seasonal workers and contractors who “do not appear anywhere in the statistics.”Footnote 56 Thus, reporting gaps in China are unlikely to skew comparative descriptive analysis to a point where we should give up trying. It is reasonable to regard available statistics in China as a measure of public employees who undertake substantive administrative and services tasks on a full-time and long-term basis. This measurement approach is consistent with international practices.Footnote 57
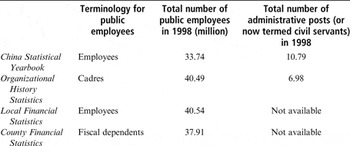
To obtain reliable statistics, we should also assess the strengths and limitations of different data sources and choose the most appropriate among them. To illustrate, in Table 3, I compare the measure of public employment from four data sources. Compared to statistics from the Organization Department and Ministry of Finance, the China Statistical Yearbook underestimated the total number of public employees by about 7 million. The figures reported in the Organizational History Statistics and Local Financial Statistics are roughly equal. The latter reported about 50,000 more public employees because it included all retired cadres. There were 2.63 million fewer public employees reported in the City and County Financial Statistics than Local Financial Statistics because the former excluded personnel in self-funded units. By comparing the available data sources, we can conclude that the Organizational History Statistics and Local Financial Statistics provide the most comprehensive and accurate measure of Chinese public employment. So, in the descriptive analyses that follow, we will use these two sources.
Comparing Public Employment Measures Across Data Sources
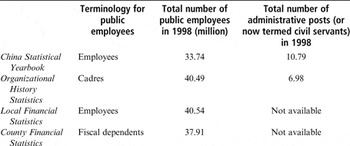
Note: As the Organizational History Statistics contains statistics until 1998, we compare statistics across sources in the year of 1998.
China's Public Employment Size in Comparative View
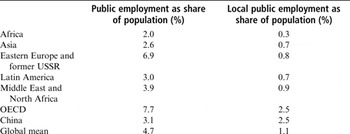
This section compares the public employment size in China to other countries.Footnote 58 The World Bank conducted an international survey of public employment using data from the early 1990s.Footnote 59 The findings are summarized in Table 4 and compared with Chinese statistics. Based on the Organizational History Statistics, public employment in China averaged 3.1 per cent of total population from 1990 to 1998, whereas local public employment as a share of population was 2.5 per cent. Compared to other countries, the net size of public employment in China is one-third below the global mean of 4.7 per cent. China's net public employment size per capita is 0.5 percentage points more than the average in Asia, roughly equal to Latin America, but less than half of Eastern Europe, the former USSR and OECD countries.Footnote 60 Even if the Chinese government had under-reported bureaucratic staff size by 100 per cent (which is a stretch), public employment size per capita in China would still be smaller than in the countries of Eastern Europe and the former USSR.
Comparing Public Employment Size in China and Other Regions
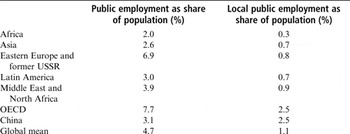
Sources: Schiavo-Campo et al. Reference Schiavo-Campo, De Tommaso and Mukherjee1997; author's calculation based on Organizational History Statistics.
However, China's local (provincial level and below) public employment size per capita of 2.5 per cent is among the highest in the world, more than twice the global average of 1.1 per cent. It outstrips the percentages of Africa, Asia, Eastern Europe, Latin America and the Middle East. Only the OECD countries had the same density of local public employment as China. Thus, it is clear that China's public employment is heavily concentrated among local governments compared to other countries. In fact, one may argue that given the complexity of policy-making in such a populous country, China's central government employment may be too small.
Distribution of Public Employment Growth
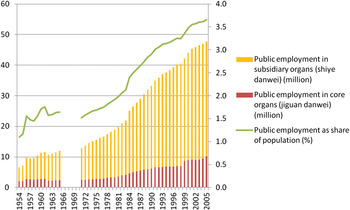
Following state establishment in 1949, the number of positions in the Chinese bureaucracy rose steadily, reflecting a process of bureaucratization. Then, in the reform era, from 1979 onwards, the absolute and relative size of public employment grew at a steeper rate. This is paradoxical since it might be expected that a socialist state apparatus would be larger and grow faster than one moving towards a free market economy.Footnote 61 In 1960, there were 11 million public employees, 1.7 per cent of the population. Thirty years later, in 1990, the number of personnel had jumped to 33 million, or 2.9 per cent of population. By 2005, there were 47 million functionaries staffing the entire party-state apparatus, according to the Local Financial Statistics.
Since 1980, the central government has initiated several downsizing campaigns to cut bureaucratic flab. The campaign of 1998, spearheaded by former Premier Zhu Rongji 朱镕基, was the most ambitious. Central-level ministries went from 49 to 20, and staff size was purportedly trimmed by half. The provincial and sub-provincial governments followed central orders in slashing personnel. It was said that provincial bureaucrats were cut by up to 47 per cent, and the reduction goal at the city and county levels was 20 per cent.Footnote 62 Yet, as Burns cautioned, we should not conflate official claims with actual results.Footnote 63 As is evident from Figure 1, the net number of public employees grew every year, even following 1993 and 1998, when two major streamlining programmes were implemented. Taking into account population growth, the per capita size of public employment increased from 1.5 per cent in 1972 to 3.7 per cent in 2005.
China's Growth of Public Employment, 1954–2005

Clearly, from Figure 1, the Chinese bureaucracy has grown and is still growing. It appears that instead of actually laying off cadres en masse, the Chinese government has “successfully” downsized by slashing the number of organizations and bianzhi. Footnote 64 As shown in Table 5, the number of units (including Party, government and subsidiary units) has steadily reduced over the years. By 2005, almost a third that had existed in 1995 were eliminated. As a result, the average bureaucracy hired twice as many employees in 2005 than ten years earlier, and the total number of employees undoubtedly grew.
Number of Units versus Number of Employees in the Party-State Bureaucracy

Source: Local Financial Statistics 1995 and 2005.
The majority of public employees, about 80 per cent, are hired by shiye rather than jiguan units. Public employment growth has been concentrated among extra-bureaucracies. As discussed in previous case studies, extra-bureaucracies were obliged to absorb excess staff from core bureaus, those made redundant from downsizing, demobilized military personnel, university graduates and the children of bosses in supervising agencies.Footnote 65 Unlike core agencies, which were limited to performing regulatory and planning tasks, extra-bureaucracies could operate in the market and enjoy quasi-monopolistic rights or competitive advantages in services provision.Footnote 66 They thus enjoyed greater flexibility in generating extra income and funding public personnel.
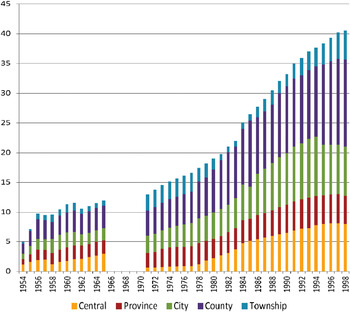
Figure 2 shows the distribution of public employment by levels of government: central, province, city, county and township. It uses statistics from the Central Organization Department, which divides staffing size by administrative levels. From 1954 to 1998, central-level public employment averaged 16 per cent of the total, provincial level 17 per cent, city level 22 per cent, county level 34 per cent and townships 10 per cent. On average, 66 per cent of public employment is at the sub-provincial levels, with county governments having the largest share. Since 1980, central-level staff size has grown from 12 per cent to 20 per cent. Provincial governments have seen a falling share of public employment, from 18 per cent in 1979 to 11 per cent in 1998. This could reflect a steady devolution of responsibilities from provincial to sub-provincial administrations. It could also result from tougher downsizing targets imposed on provincial governments than on sub-provincial administrations.
Public Employment by Levels of Government, 1954–1998

Public employment patterns at the township level deserve more elaboration. Township governments have seen the largest fluctuation in public employment size since the CCP took power.Footnote 67 They registered an average share of 9 per cent of total employment in the 1950s and 1960s, jumped in the 1970s, fell during the 1980s and early 1990s, and picked up again from 1996 onwards. There is likely to be more undercounting and miscounting of public employment among townships than at higher levels of government, which is confirmed by the unstable patterns. It is unclear whether the statistics on township employment include all or some village cadres. It is also unclear how “cadres” are defined at the township level, where concepts of organization and bianzhi are muddled even in recent times. Anecdotal evidence suggests that bureaucratic over-staffing is most severe among township governments. Unfortunately, data from the Central Organization Department do not extend beyond 1998. Following major rural tax reforms and administrative restructuring among townships in the last decade, it will be interesting to see whether and how staffing levels have changed at this level of government.
Conclusion
Is the Chinese public bureaucracy overstaffed? This is a deceptively simple question, yet it is an important one. The issue of public employment size is central to discussions that are significant in terms of both theory and policy about local governance, administrative reforms and state capacity. The Chinese public and media tend to view the bureaucracy as too big. Many scholars echo this popular view. The central government has tried repeatedly to slash the cadre corps. However, before we can draw informed conclusions about public employment size, we need to accomplish a few basic tasks. This article attempts to guide future efforts to measure public employment size. It defines public employment in the contemporary Chinese context; assesses the range of data sources for measuring public employment; and places China in comparative perspective. It shows that China's net public employment size per capita is not larger than most countries, but public employment has certainly been growing and such growth is concentrated among sub-provincial governments and in the extra-bureaucracies.
Thus, we urge caution in making ungrounded claims about bureaucratic size and in advocating draconian, indiscriminate streamlining. It is important to look beyond the appearance of size and at less apparent issues of structure and goals of governance.Footnote 68 For example, is the bianzhi system still relevant in the current market economy, where bureaucratic functions are changing rapidly and where agencies can generate revenue to fund their own positions? Is the distribution of public employment across levels of government aligned with the responsibilities of each level? Have central policies to downsize been matched by realistic strategies and financial resources to retrench excess cadres? So far, from my interviews, it appears they have not. Unsurprisingly, the outcome has been local circumvention of central policy and continued expansion of local bureaucracies. And finally, there is in fact wide variation in staffing levels across departments within any local government: some are clearly overstaffed, and some are understaffed.Footnote 69 Future research can benefit from paying more attention to basic measurement issues and by taking into account variation in public employment distribution and growth across regions and levels of government, and within each locality.