Introduction
Several anti-nutritional compounds have been identified that compromise the value of faba bean as a source of protein in human and animal diets. Among these are the glucosidic aminopyrimidine derivatives vicine and convicine (VC). These secondary metabolites accumulate at maturity in faba bean cotyledons and are hydrolysed by a native β-glucosidase, forming the aglycones divicine and isouramil. These aglycones cause the oxidation of glutathione in red blood cells, which can be harmful in individuals who cannot regenerate glutathione at normal rates due to deficient glucose-6-phosphate dehydrogenase (G6PD) activity (Arese et al., Reference Arese, Bosia, Naitana, Gaetani, D'Aquino and Gaetani1981). The resulting haemolytic condition, known as favism, can be severe and sometimes fatal. The population at risk is large (some 400 million individuals worldwide), and there is a coincidence between human populations with a high frequency of G6PD-deficient alleles and regions of the world where faba beans are consumed (Greene, Reference Greene1993).
Pyrimidine glycosides, particularly vicine, also have deleterious effects on chickens, causing decreases in food consumption, weight gain, egg weight and egg fertility, while increasing the fragility of erythrocyte membranes (Marquardt et al., Reference Marquardt, Campbell and Ward1976; Muduuli et al., Reference Muduuli, Marquardt and Guenter1982). The anti-nutritional effects of VC in faba beans used for food and feed have recently been and thoroughly reviewed (Crépon et al., Reference Crépon, Marget, Peyronnet, Carrouée, Arese and Duc2010).
VC are thermostable, but may be extracted by steeping beans in an acid bath or cooking with disposal of the steeping or cooking solution (Marquardt et al., Reference Marquardt, Muduuli and Frohlich1983). Extraction may be feasible in food preparation, but is too expensive for use in animal feed preparation. Furthermore, fresh beans consumed as a vegetable are unlikely to receive adequate treatment, leaving consumers at risk.
The isolation of a faba bean germplasm accession (‘line 1268’) with an order of magnitude less VC than the wild-type background (Duc et al., Reference Duc, Sixdenier, Lila, Furstoss, Huisman, van der Poel and Liener1989) offers the possibility for a reduction of VC in faba bean lines using plant breeding methods. The low VC (LVC) trait is inherited as a simple recessive Mendelian character (designated vc −) linked in the coupling phase in the studied background to the colourless hilum character (Gutierrez et al., Reference Gutierrez, Avila, Duc, Marget, Suso, Moreno and Torres2006). Thus, the possibility of exploiting vc − mutations within commercial plant breeding programmes should be straightforward. Some LVC cultivars have been released by INRA and marketed by RAGT.
After the activity on methods to purify (Marquardt et al., Reference Marquardt, Muduuli and Frohlich1983), quantify (Chevion and Navok, Reference Chevion and Navok1983) and rapidly screen (Olsen and Andersen, Reference Olsen and Andersen1978) materials for VC levels, attention has abated in recent years, and it has become difficult to procure reference standards suitable for quantifying VC. The first objective of our study was to adapt an efficient screening method (Lattanzio et al., Reference Lattanzio, Bianco and Lafiandra1982) for determining VC levels in faba bean seeds in spite of the lack of availability of commercial reference standards. This method was adapted by using spectral data and biochemical assays to confirm the identity of peaks attributed to VC in the final chromatograms. The second objective was to screen cultivars and germplasm of interest to our faba bean pre-breeding programmes.
Materials and methods
Plant materials
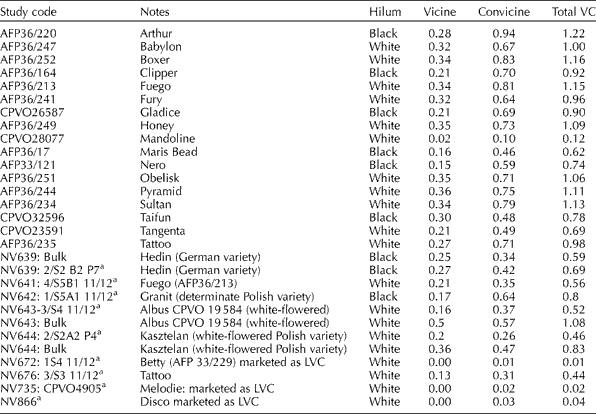
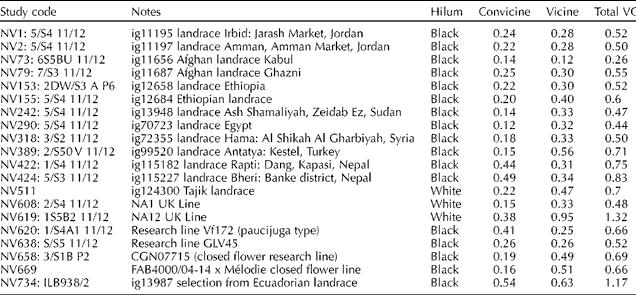
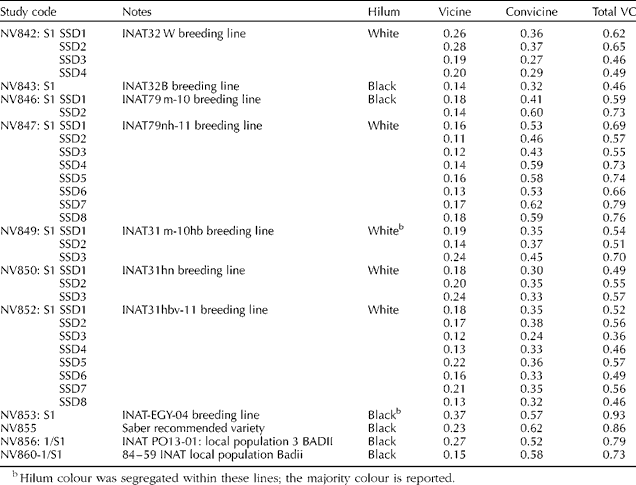
A total of 57 accessions were examined in this study (Tables 1–3). We examined 26 named commercial cultivars (Table 1), 17 cultivars sampled from a bulk of seed, six inbred lines derived by single-seed descent (SSD) from a selection of a cultivar and three cultivars where a bulk sample and a SSD sample were compared. In addition, we tested 20 inbred lines maintained on behalf of the UK Pulse Crop Genetic Improvement Network (Table 2). Finally, we included nine research lines from the L'Institut Nationale d'Agronomie de Tunisie (INAT) faba bean research programme. These included lines derived from landraces collected by Fayçal Ben Jeddi and two currently widely grown Tunisian varieties (Table 3). Six of the Tunisian lines were represented by more than one SSD line. We recorded any claims of LVC status and the seed hilum colour of these cultivars and lines.
Commercial cultivars included in this study

aThese results represent inbred lines derived by SSD from a selection within the named cultivar. All VC results are expressed as a percentage (by weight) of dry seeds.
UK research lines included in this studya
aAll results represent inbred lines derived by SSD. All VC results are expressed as a percentage (by weight) of dry seeds. All lines with a variety reference starting with ‘ig’ were supplied by ICARDA.
Tunisian research lines included in this studya
aAll results represent inbred lines derived by SSD. All VC results are expressed as a percentage (by weight) of dry seeds.
bHilum colour was segregated within these lines; the majority colour is reported.
Identification of l-3,4-dihydroxyphenylalanine and VC peaks by high-performance liquid chromatography
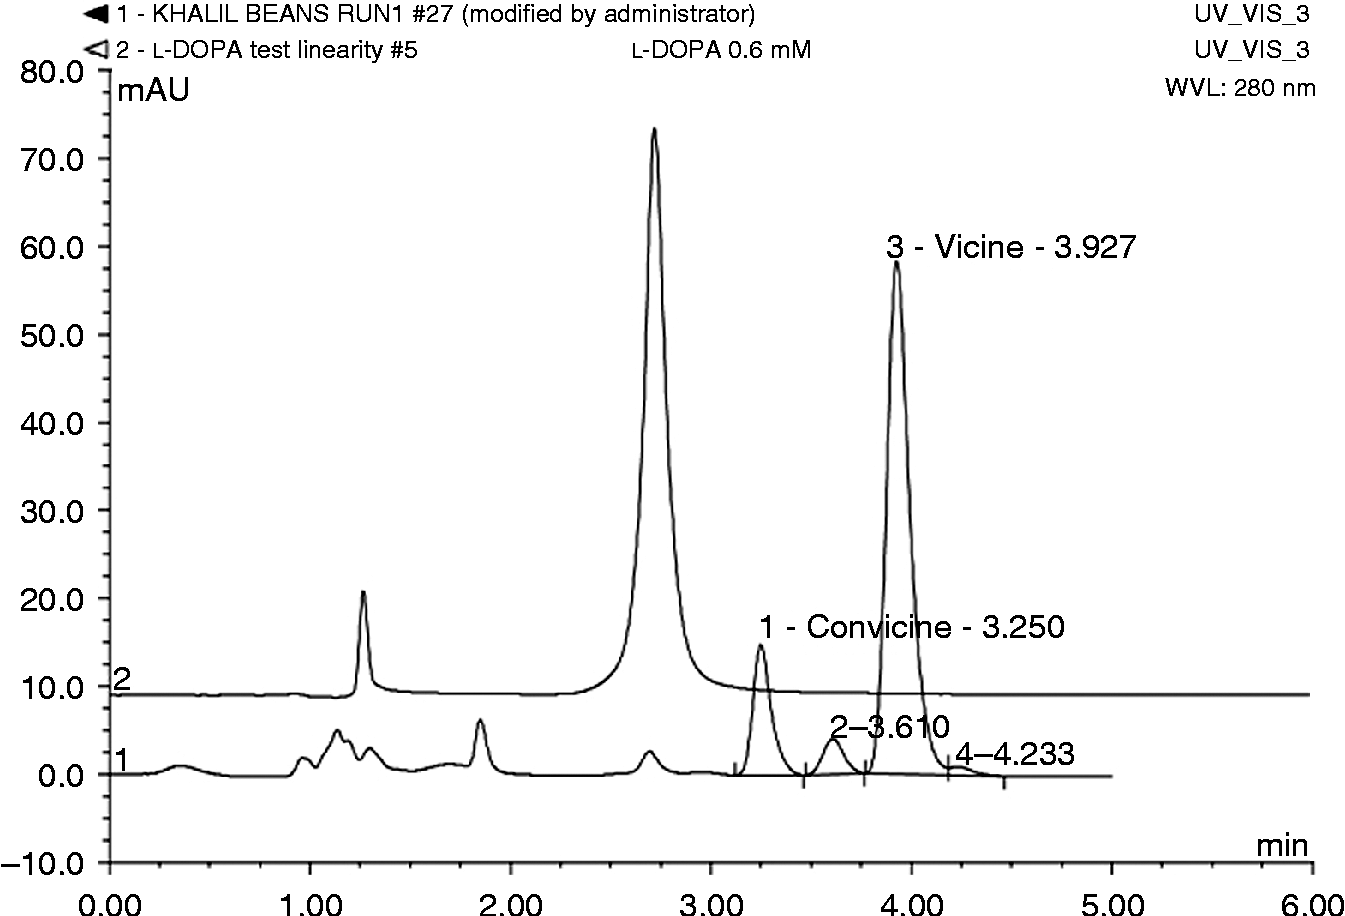
Crude methanolic extracts were prepared from faba bean flour using 70:30 methanol–water following the method of Arbid and Marquardt (Reference Arbid and Marquardt1985). The crude extract was reduced to a low volume and prepared for the high-performance liquid chromatography (HPLC) by passing it through a 0.45 nm disc filter. Our strategy for identification and quantification of l-3,4-dihydroxyphenylalanine (l-DOPA) and VC was based on the method published by Lattanzio et al. (Reference Lattanzio, Bianco and Lafiandra1982) involving HPLC separation of extracts on a reversed-phase column (C18) of l-DOPA, VC with UV detection at 280 nm. We used a Dionex Ultimate 3000 HPLC with a Phenomenex Sphereclone ODS II column (250 × 4.6 mm × 5 μm). We used 100% water as the mobile phase at a flow of 1.5 ml/min, which was monitored with a diode array detector recording at 229, 254, 280 and 400 nm. Peaks for VC were tentatively identified by comparing their retention times in chromatograms for the crude extract with the retention time of l-DOPA (Sigma Chemical Company) in chromatograms (Fig. 1). l-DOPA was chosen as a reference standard because (1) its chromatographic properties were included in the method published by Lattanzio et al. (Reference Lattanzio, Bianco and Lafiandra1982), (2) it may be present in immature faba bean cotyledons (Burbano et al., Reference Burbano, Cuadrado, Muzquiz and Cubero1995) and (3) purified l-DOPA is commercially available.
Overlaid chromatograms for the crude extract and the l-DOPA reference standard (monitored at 280 nm) showing the RRT for l-DOPA and VC. The RRT are consistent with Lattanzio et al. (Reference Lattanzio, Bianco and Lafiandra1982).
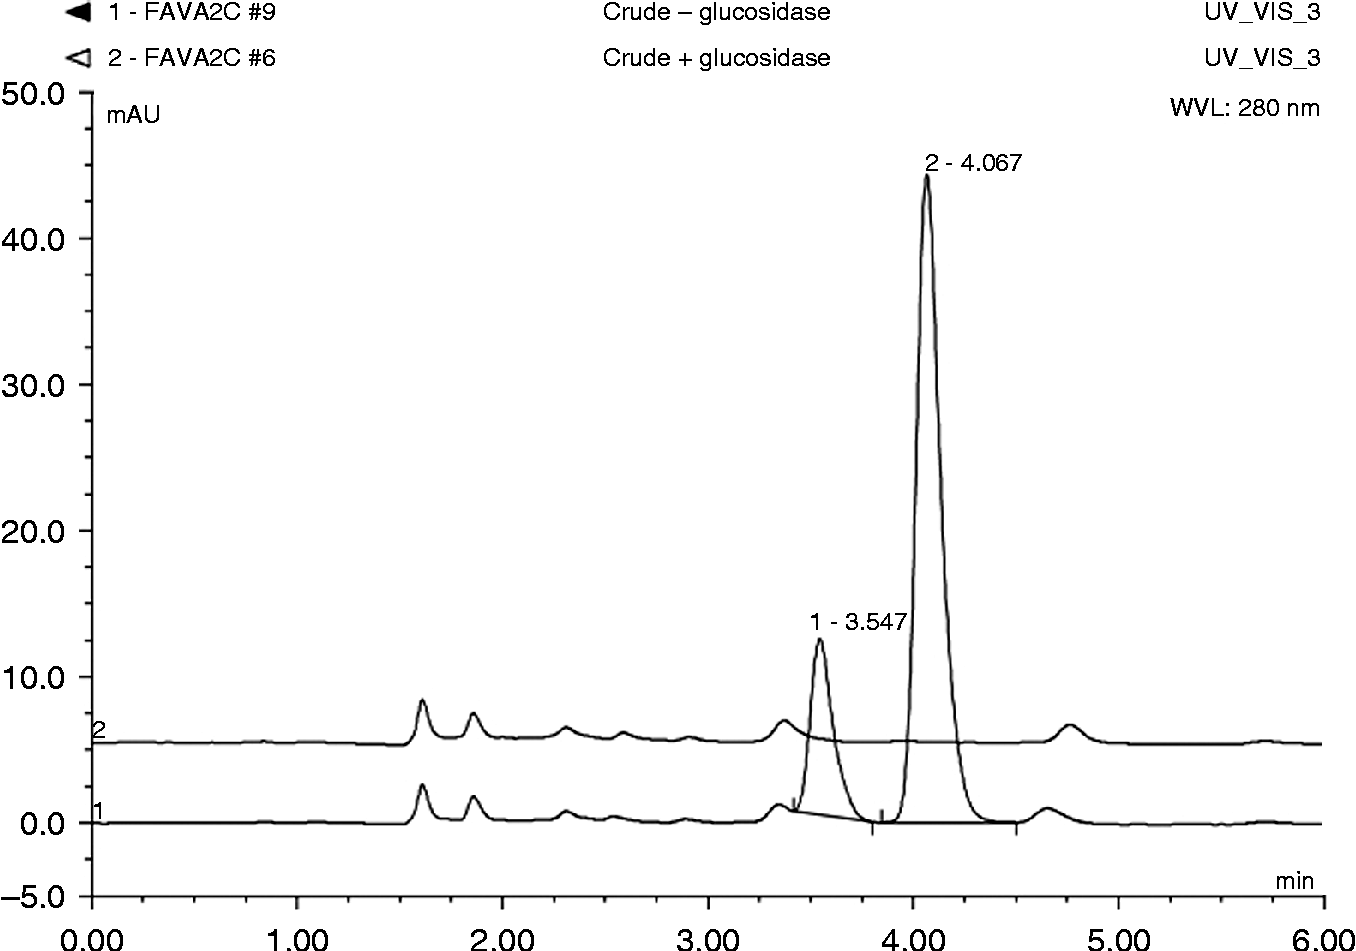
A β-glucosidase sensitivity assay was conducted as a further proof of identity of the peaks tentatively identified as VC. Eight paired 5 ml aliquots of the diluted crude extract, buffered to pH 6 with sodium acetate buffer, were prepared. One aliquot of each pair was treated with a freshly prepared β-glucosidase (Sigma Chemical Company) solution added and both aliquots were incubated at 65°C for 1 h (Brown and Morrall, Reference Brown and Morrall1996). The incubated solutions were prepared for HPLC by passing them through a 0.45 nm disc filter and analysed as above (Fig. 2).
Overlaid chromatograms for aliquots of the crude extract treated by β-glucosidase and untreated controls. Peaks tentatively identified as convicine (peak 1 at 3.547 min) and vicine (peak 2 at 4.067 min) are present in the untreated controls and absent in the treated aliquots, confirming their identity as glucosides.
A crude extract of bean flour (5 g to 50 ml water) was prepared for mass spectroscopy (MS) by centrifuging and 1 ml of the supernatant was diluted in 10 ml of methanol and water (50:50 by volume) and then filtered using a 0.45 μm filter. The diluted sample was infused directly into the mass spectrometer at a flow rate of 10 μl/min for a full-scan MS experiment with a mass range of m/z 50–500.
Rapid HPLC screening of germplasm for VC contents
At least five seeds of each accession were milled using a hammer mill fitted with a 1 mm screen. Duplicate 0.5 g portions were extracted with 10 ml distilled water by taking each sample through two cycles of suspension using a ‘vortex mixer’ and treatment in an ultrasonic bath at 40°C for 10 min. The extracts were filtered (Whatman no. 1) and made up to 100 ml with distilled water. A portion of this extract was passed through a 0.45 nm disc filter and analysed using the HPLC test system described above. l-DOPA reference solutions were prepared daily. Peaks were identified as VC by their retention time relative to l-DOPA.
Peak area data were recorded for chromatograms for l-DOPA reference solutions and for all ‘unknown’ extracts. The concentration of glycosides in bean flour was calculated according to equation (1).
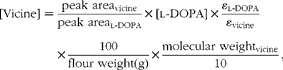 $$[Vicine] = \frac {peakarea_{vicine}}{peakarea_{l\hyphen DOPA}}\times [l\hyphen DOPA]\times \frac { \varepsilon _{l\hyphen DOPA}}{ \varepsilon _{vicine}}\times \frac {100}{flourweight (g)}\times \frac {molecularweight_{vicine}}{10}, $$
where [Vicine] is the concentration of vicine expressed as percentage by weight of flour ‘as received’; [l-DOPA] is the concentration of the l-DOPA reference solution (M); and ε is the molar extinction coefficient.
Convicine concentrations were calculated in the same way: εconvicine= 14,450, εvicine= 16,400, molecular weightconvicine= 305.24 and molecular weightvicine= 304.26 (Windholz et al., Reference Windholz, Budavari, Stroumtsos and Fertig1976).
Statistical analysis
The linearity of the test system's instrument response to l-DOPA was tested using nine solutions in the range of 0–12 mM l-DOPA, spanning three decades in concentration and correlation coefficients calculated in a Microsoft Excel. An analysis of variance for the data for technical and biological replications was used to calculate the reproducibility of the analytical method.
Results
A rapid and inexpensive method for extraction and HPLC analysis of VC from dry seeds
The chromatograms for the crude extract had peaks whose relative retention times (RRT), compared with l-DOPA, are consistent with those predicted for VC (Lattanzio et al., Reference Lattanzio, Bianco and Lafiandra1982). The RRT were as follows: l-DOPA, RRT = 1.00; convicine, RRT = 1.22 (1.17–1.24); and vicine, RRT = 1.44 (1.41–1.48) (Fig. 1). The spectral data for each eluting peak were inspected, which showed that the spectral maxima (λmax) for peaks eluting at RRT = 1.00, RRT = 1.22 and RRT = 1.44 are consistent with those reported for l-DOPA (280 nm), convicine (271 nm) and vicine (274 nm) (Windholz et al. (Reference Windholz, Budavari, Stroumtsos and Fertig1976)). When the chromatograms obtained for aliquots of a crude extract treated with β-glucosidase and those for the control portions were compared, the untreated controls had peaks consistent with VC (RRT = 1.22 and RRT = 1.44), while these peaks were absent in the portions treated with β-glucosidase, as shown in Fig. 2. This confirms that the peaks at RRT = 1.22 and RRT = 1.44 are glycosides, which is consistent with their identification as VC. Within the MS, the singly charged ions at m/z 305.1 and m/z 306.0 are consistent with protonated VC, respectively. MS/MS fragmentation of these ions yielded ions at m/z 143.1 and m/z 144.1, each consistent with the VC aglycones.
Supplementary Fig. S1 (available online only at http://journals.cambridge.org) shows that the HPLC Ultmate 3000 instrument used has a linear dose response to the reference standard, l-DOPA, within the examined range. The correlations between the concentration and the instrument response, measured by peak height or peak area, were high and positive (peak height: r= 0.998 and peak area: r= 0.999).
For both technical and biological replications, the standard error (SE) was low (technical replication: SE = 0.007 and biological replication: SE = 0.06). Taken together, these estimates were used to calculate the least significant difference detectable using this method as 0.25% (by weight in fresh material) for VC. This result suggests that the method is semi-quantitative and will safely discriminate between germplasm described as having a high or low VC content. Also consistent with the correct identification of VC peaks were the calculated near-background VC peak areas of the control lines ‘Mélodie’, ‘Disco’ and ‘Mandoline’, all marketed as commercial varieties with the LVC trait (Table 3), and these varieties are clearly distinguishable from high VC lines.
Variation in VC levels in UK and Tunisian germplasm
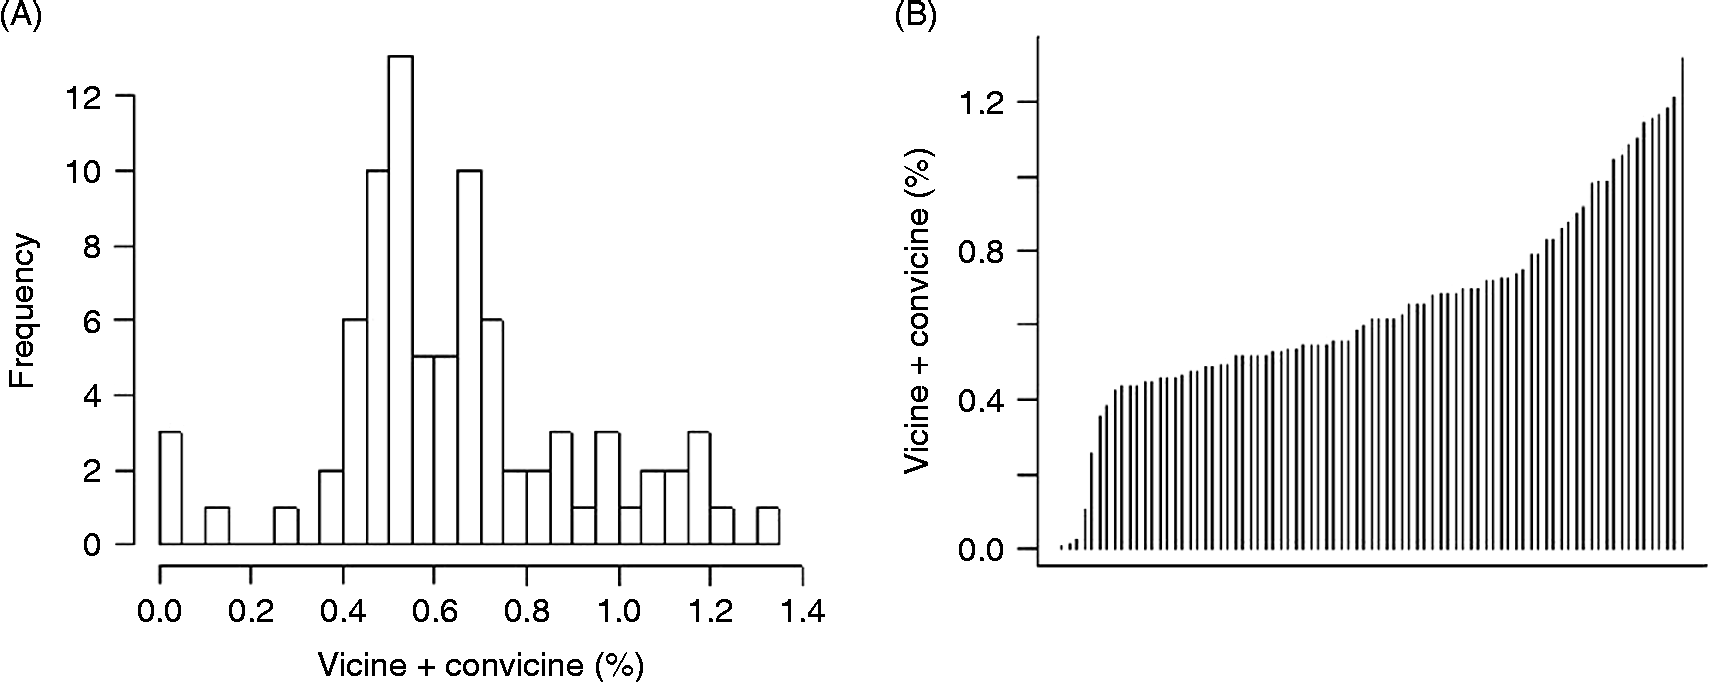
The concentrations, expressed as a percentage dry matter, among the lines studied ranged from 0.01 to 0.95 for vicine and from 0.01 to 0.54 for convicine, while total VC ranged from 0.01 to 1.32% (Table 3). The VC data follow a normal distribution, though the very low values (0.01% VC) were shown to be outliers by Grubb's test. The mean of the best-fit normal distribution was at 0.65 with a standard deviation of 0.27. The outliers correspond to the varieties within the panel that possessed the vc − mutation that therefore expressed VC at levels below the normal wild-type range. We will refer to the outliers as LVC and the remaining lines as HVC. Figure 3(A) shows the frequency distribution of VC values, while Fig. 3(B) consists of a histogram showing the VC contents of the panel ranked in ascending order. Aside from the control lines, which were expected to exhibit low VC values, only one other line – NV672, an inbred line derived from the spring variety ‘Betty’ – was LVC. The variation among HVC (or wild-type) lines was considerable, but as seed material for this study was not all sourced from a single multiplication and therefore corresponded to seed lots of differing age, this apparent variability may reflect the well-documented decline in VC contents during seed storage (Burbano et al., Reference Burbano, Cuadrado, Muzquiz and Cubero1995) as much as any heritable differences in capacity to accumulate VC.
(A) Frequency distribution of VC values and (B) histogram showing the VC contents of the panel ranked in ascending order.
Discussion
Efficient screening for VC contents
We have established through this study that three pieces of equipment are required to screen faba bean materials: a miniature mill capable of grinding small bean samples to flour, an ultrasonic bath and a HPLC instrument fitted with C18 columns and a UV detector. With automated sample loading, 40 samples can readily be extracted and run in sequence in a 24 h period, with HPLC running overnight. An alternative TiCl-based spectrophotometric method offers an even simpler alternative (Kim et al., Reference Kim, Hoehm, Eskin and Ismail1982), although in both cases, the limiting step is likely to be the milling and extraction steps, if only due to the volumes involved. Future investigations could examine the possibilities for miniaturization and/or automation of the extraction procedure or implementing extraction methods that use microwave ovens (Kaufmann and Christen, Reference Kaufmann and Christen2002).
Low frequency of vc − mutation in the UK
The fact that there are no documented claims for LVC in any current recommended winter or spring faba bean varieties in the UK seems to be supported by the lack of any evidence for this trait in any of the UK varieties that we surveyed. We did observe a vc − source from an inbred line derived from the spring variety ‘Betty’, an European Union Common Catalogue variety marketed as LVC by RAGT.
We must underline that our research lines derived through SSD from synthetic varieties are unlikely to reflect all the described characters of the commercial variety and infrequently may reflect few or none of its essential characters, where, for example, an off-type contaminant was used by chance to establish the derived line. The advantage of inbred lines over open-pollinated accessions in the context of trait genetics is that repeated measurements can be made on genotypically identical samples and heritable phenotypes mapped using classical genetic techniques (Cottage et al., Reference Cottage, Gostkiewicz, Thomas, Borrows, Torres and O'Sullivan2012). Nonetheless, this work establishes clearly that none of the currently recommended faba bean varieties available in the UK or Tunisia that we surveyed expresses the LVC trait. Any breeding efforts aimed at reducing the VC content of beans sold for the human consumption market or seeking to offer an ‘enhanced nutritional’ profile to the poultry feed market will need to start from crosses to one of the few established sources of the vc − mutation.
Previous surveys of VC contents in small samples of diverse faba bean varieties and accessions have reported some variation in relative amount, but values were always in excess of 0.3% dry matter in either whole seeds or cotyledons (Wang and Ueberschär, Reference Wang and Ueberschär1990; Jamalian et al., Reference Jamalian, Aylward and Hudson1977). This is consistent with our picture of broad variation within the wild type and germplasm harbouring the vc − mutations falling significantly below this level.
We did not examine large-seeded broad bean (Vicia faba L. ‘major’) varieties in this work. It would be interesting to establish whether the immature broad beans used as a fresh salad ingredient have significant VC levels.
Prospects for mapping the LVC trait
Gutierrez et al. (Reference Gutierrez, Avila, Duc, Marget, Suso, Moreno and Torres2006) have shown that the LVC trait is a simply inherited recessive character that segregates in a 1:3 ratio at F2, and Duc et al. (Reference Duc, Bao, Baum, Redden, Sadiki, Suso, Vishniakova and Zong2010) have shown that vc − is linked to the white hilum character (10.1 cM). Since the VC content of cotyledons is maternally expressed, the biochemical analysis of F3 single-plant progenies can be used as an accurate reflection of the expression of individual F2 genotypes. However, the LVC phenotype is non-trivial to select for, as it involves destructive sampling to infer the genotype of the previous generation, and in practice, breeders are somewhat reliant through early generations of selection on linkage to the white hilum character, which equally is maternally expressed and recessive. Thus, linked molecular markers tagging white versus black hilum and low versus high VC contents could be used to separately select, purify and maintain any one of the four possible genotypic combinations of these two traits if desired.
We note that all four LVC lines possess a white hilum, probably as a result of active selection on the white hilum surrogate character during early generations of their breeding (Tables 1 and 2). The white hilum character, which itself a consumer preference trait, is more commonly found in the studied germplasm dissociated from the LVC trait so that the linkage of these traits in specific backgrounds must not be confused with a general coupling phase linkage.
At the University of Helsinki, a recombinant inbred population of several 100 lines from a cross between Melodie (vc −) and ILB938 (VC) is under development. Data coming from a recent single nucleotide polymorphism (SNP) discovery and validation programme (Cottage A, Webb A, Gostkiewicz K, O'Sullivan DM, in preparation) have provided a tentative location for the hilum colour (Hc) locus, which gives an a priori region of interest in which markers can be targeted, but also have shown that ‘Mélodie’ and ‘ILB938’ segregate for no fewer than 252 SNPs. Our future efforts will now turn to the genetic mapping of the VC gene.
Supplementary material
To view supplementary material for this article, please visit http://dx.doi.org/10.1017/S1479262113000105
Acknowledgements
The authors gratefully acknowledge the Tunisian Ministry of Higher Education and Scientific Research for a short-term fellowship to K.K. and grant funding to D.M.O. from Defra via the UK Pulse Crop Genetic Improvement Network that has enabled the establishment and maintenance of a collection of inbred lines.