I. INTRODUCTION
Metal foams are cellular materials, which have many interesting mechanical and physical properties, such as high stiffness, high energy absorption during deformation, and very low specific weight. Aluminum (Al) is the most common metal used for metal foam manufacturing. The production methods of metal foams are divided into two fundamental routes: direct foaming of melts and indirect foaming of precursors.Reference Banhart1,Reference Banhart2 In direct foaming methods, ceramic particles are intentionally added into Al or its alloy melts as stabilizers. Subsequently, gas bubbles are created inside the melt by blowing air or inert gas, and the melt is foamed.Reference Banhart1 In indirect foaming methods, first a foamable precursor material is prepared. The precursor material is foamed later by heating up to the liquid state temperatures. One of the indirect methods described by Gergely and ClyneReference Gergely and Clyne3 is recycling of ceramic particle reinforced metal matrix composites as cast precursors by a melting and stirring a blowing agent into the melt during the gradual cooling process. As described in the patented study of Baumeister and SchraderReference Baumeister and Schrader4 precursors can be prepared by compacting mixtures of aluminum and blowing agent powders by powder metallurgy techniques (e.g., by hot pressing, extrusion or rolling). Foams are made by baking powder compact precursors to the liquid state hence the method is called powder compact melting (PCM). The stabilizers in the PCM foams are the solid particles originating from the oxide skins of the individual metal powders.Reference Banhart2,Reference Körner, Arnold and Singer5
PCM method, which was used in the current study, has some advantages. In this method, the precursors are prepared in the solid state. Segregation effects and brittle reaction products are lower when compared with liquid state processes. It is easier to mix different metal powders with aluminum powders to obtain powder blends representing different aluminum alloys. Lehmus and BusseReference Lehmhus and Busse6 suggested using low melting alloys, such as AlSi7, AlSi10, AlSi12, AlMgSiCu, and AlSiCu for foam production because of the low decomposition temperature of titanium hydride (TiH2), the most common blowing agent for Al. Decomposition means the release of hydrogen gas from TiH2, which takes place around 400 °C. To narrow the temperature gap between decomposition of TiH2 and melting of Al alloy, TiH2 can be heat treated.Reference Von Zeppelin, Hirscher, Stanzick and Banhart7–Reference Kennedy10 Matijasevic-Lux et al.Reference Matijasevic-Lux, Banhart, Fiechter, Görke and Wanderka9 showed that heat treatment of TiH2 in open atmosphere shifts onset temperature of decomposition up to 170 °C.
The idea of ceramic addition for stabilization in the liquid metal foaming method is also applicable to PCM method. Foaming takes place above the liquidus temperature of the compacted Al powders, and an enhancement in stabilization, foam structure, and mechanical properties can be anticipated. Kennedy and AsavavisitchaiReference Kennedy and Asavavisithchai11 added up to 3 vol% of ceramic particles to PCM Al foams and reported an increase in linear expansion of the composite foams. They showed that SiC addition decreased gravitational drainage and increased stability. Elbir et al.Reference Elbir, Yilmaz, Toksoy, Guden and Hall12 showed that SiC addition increased the compressive strength of the PCM Al foams. Kennedy and AsavavisitchaiReference Kennedy and Asavavisithchai13 found a similar result with 6 vol% TiB2 addition. They also used Mg and Al2O3 for PCM Al foam production and showed that the presence of Mg with the ceramic increases the stability of the composite foam.Reference Asavavisithchai and Kennedy14 Improved wetting of Al2O3 by the alloy matrix also decreased the drainage. In all these studies, the matrix was pure Al and the main motivation was to improve structural quality of the foam by adding ceramic particles.
Studies about the effects of ceramic particle addition on the mechanical behavior and cell structure of PCM Al alloy foams are limited. Esmaeelzadeh et al.Reference Esmaeelzadeh, Simchi and Lehmhus15 added up to 10 vol% SiC with different particle sizes to PCM AlSi7 alloy foams and showed that the linear expansion and the stability of the foams depend on the size and the amount of SiC particles. Increasing the amount and/or decreasing the particle size reduced the drainage but the cell structure became nonuniform. The compression strength of AlSi7 + SiC foams was lower than that of AlSi7 foams because of the heterogeneity of the cell structure. Haesche et al.Reference Haesche, Weise, Garcia-Moreno and Banhart16 added up to 5 wt% of either SiC or Al2O3 to AlSi11 and reported that ceramic addition was advantageous for both the foaming behavior and the stability of thixocast AlSi11 precursors. They obtained higher maximum expansion in the foam with an increase in the number of pores, lower drainage, and reduced collapse when the particle content was increased and the particle size was decreased. Excluding the structural quality and density of the foam, the main variables contributing to the mechanical properties are foam alloy composition and its metallurgical state.Reference Lehmhus and Banhart17–Reference Degischer and Kriszt19 Lehmhus and BanhartReference Lehmhus and Banhart17 produced PCM AlMg1SiCu (6061) foams and altered the metallurgical state of the matrix alloy by heat treatment. The average hardness of the metal matrix and compression strength of the foams increased up to 100%.
The purpose of this study is to combine the positive effects of ceramic particle addition and heat treatment, first on the stabilization and structure of the foams and latter on the strengthening of the foam alloy, respectively. To achieve this, 6061 and 6061 + Al2O3 foams have been produced by PCM method by adding 0, 3, 5, and 10 vol% Al2O3, and each foam has been characterized by metallography techniques, microhardness measurements, and compression testing.
II. MATERIAL AND METHODS
A. Materials
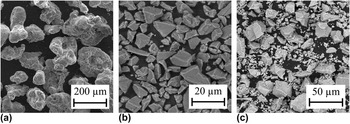
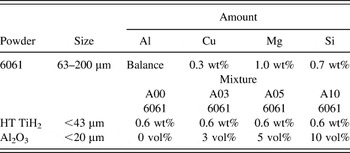
6061 powder was obtained by blending elemental powders of Al, Mg, Si, and Cu. The characteristics and amount of the materials used including Al2O3 and TiH2 are summarized in Table I. TiH2 was heat treated at 480 °C for 3 h and then added to the mixture. Particle size and morphology of the powders, 6061 blend, Al2O3, and heat-treated TiH2, are presented in Fig. 1. As seen in these scanning electron microscopy (SEM) images, the shape of particles in the 6061 blend is irregular and other powders have an angular shape.
SEM micrographs: (a) 6061, (b) Al2O3, and (c) TiH2 powders.

Characteristics and amount of powders used as starting materials.

(HT) heat treated.
B. Manufacturing of the foams
6061 foams and 6061-Al2O3 composite foams were manufactured by the PCM method. The metal powders (6061), ceramic powders (Al2O3), and the heat-treated blowing agent (TiH2) were blended in a tumbler mixer for 30 min. Compaction procedure started with cold pressing the powder mixture at 300 MPa to 20-mm diameter compacts, followed by hot forming and compaction at 400 °C with a pressure of 300 MPa to 27-mm diameter cylindrical precursors. The temperature and pressure was maintained for 30 min for a better densification of the compact. Hot-compacted precursors were foamed in a preheated standard chamber furnace at 780 °C in thin-walled AISI 310 stainless steel cylindrical tubes with a diameter of 29 mm and a height of 60 mm. The top and bottom of the tubes were closed with AISI 310 plates, and the plates were fastened by AISI 304 stainless steel bolts. Total foaming time was 6–8 min depending on the weight and composition of the precursor.
C. Heat treatment of 6061 and 6061-Al2O3 foams
To analyze the effect of heat treatment on the foams and to identify the peak hardness after age hardening, foam specimens under different heat treatment conditions, including as foamed, annealed, solution heat treated (SHT), and SHT followed by artificial aging for 2, 8, and 16 h, were prepared. SHT and aging temperatures were similar to conventional wrought 6061 alloy’s. The annealing process was conducted at 420 °C for 3 h. After completing dwell time, samples were slowly cooled to 260 °C, held for 1 h and finally cooled to room temperature slowly. At SHT process, samples were heated to 530 °C inside the foaming furnace for 100 min and subsequently quenched. The artificial aging process was conducted inside a drying furnace at 175 °C.
D. Macro- and microstructure of the foams
To make a comparison between the macrostructures of 6061 and 6061-Al2O3 foams with different amounts of Al2O3, the same weight precursors were foamed under the same heating conditions. Obtained foams were cut through the centerline into two by electron discharge machining (EDM). Longitudinal sections of the foams were photographed for visual observation of the macrostructure and also scanned to obtain digitized images for further processing. Images were first enhanced and converted to binary image, and then individual cells were identified and labeled with different colors using a Matlab image processing toolbox. Using the information extracted from image analyses, and taking the cells with an area ≥1 mm2 into account, distribution of cell numbers in terms of cell areas and eccentricity of cells was computed for various foams. The eccentricity of the cells was used to find out the degree of roundness of the cells.
Samples for microstructural examination of the cell walls were prepared by cutting off 5–10-mm thick slices from various specimens with a low speed diamond saw, embedding the parts in an epoxy resin and finally polishing. Observations were made both by light optical microscopy and SEM. Samples were etched with Keller’s agent to distinguish clean surfaces from grain boundaries, voids, ceramic, or dense oxide containing surfaces.
E. Microhardness and compression tests
Vickers microhardness (HV) measurements with a load of 25 gf for thin and 50 gf for thick cell walls applied for 10 s were performed at various locations of each specimen prepared as described in Sec. II. D. At least 10 acceptable indentations were used to determine the HV of each specimen.
Compression tests were carried out at room temperature with a universal testing machine (Model Z100, Zwick/Roell, Ulm, Germany) using a 100 kN load cell and a cross-head speed of 1.0 mm/min. Machine was programmed for unloading and reloading at selected deformations for determination of the elastic stiffness. Since the stiffness of the machine was much higher than the stiffness of the foam samples the displacement of the crosshead was used to determine unloading modulus and overall compressive strain. The solid skin of all the samples was removed by machining in a conventional lathe and h/d ratio of specimens was kept at a minimum value of two. The surfaces of the compression plates were cleaned and greased before each compression test.
III. RESULTS AND DISCUSSION
A. Macrostructure of the foams
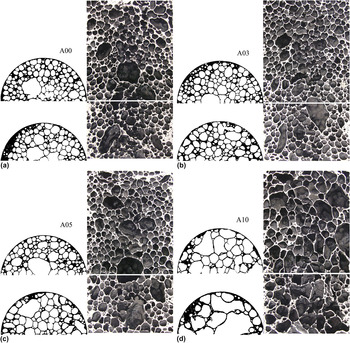
The effects of Al2O3 addition on the macrostructure of the obtained foams are presented in Fig. 2. When 3 vol% Al2O3 is added, the cell shapes and sizes are not affected significantly. When the amount is increased to 5 vol%, cells become larger, but there is still a fine structure, and except a few number of cells, the cell size is homogeneous. The structure significantly changes when an Al2O3 content increases to 10 vol%. The number of cells decrease and cell sizes become larger. The bottom of the foam is significantly denser. Cell walls are thinner and plateau borders are small at the top of the foam, which is an indication of liquid drainage by gravitational forces. At this point, the relative density of the composite foams needs to be considered. Relative density ρr is found by dividing the foam density ρ* by the density of matrix material ρs which is 2.7 g/cm3 for 6061 alloy. Using the rule of mixtures, densities of the matrix materials of the composite foams are calculated as 2.74, 2.76, and 2.83 g/cm3 for 3, 5, and 10 vol% of Al2O3 addition, respectively. This means that the relative densities of the foams are 0.211, 0.208, 0.206, and 0.201 g/cm3. Figure 2 also shows the cross-sections perpendicular to EDM cut surfaces at two different locations, close to the bottom and mid portions of the foams. The structures observed in A03 and A05 foams are more homogeneous when compared with A00 and A10 foams. Density gradient is observed in all foams, which is significantly high for A10 foams. Al2O3 addition apparently decreases the gradient as observed in macrophotos of A03 and A05 foams.
Cross-sections of 6061 and 6061 + Al2O3 foams showing the density difference and cell structure at the bottom and mid-portion: (a) A00: no Al2O3, (b) A03: 3 vol% Al2O3, (c) A05: 5 vol% Al2O3, and (d) A10: 10 vol% Al2O3 (diameters of the foams are 29 mm).

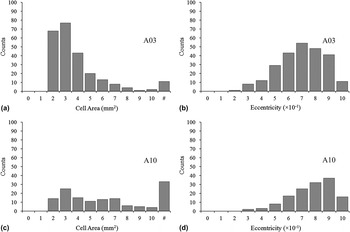
Distribution of the number of cells according to the cell area and eccentricity of the cells was determined by a Matlab image processing toolbox for all samples from A00 to A10, and the results for samples A03 and A10 are presented in Fig. 3. Total number of cells for A00–A10 foams are 231, 248, 215, and 141, respectively. The average cell area is close to 4 mm2 for A00 and A03 foams, 5 mm2 for A05 foam, and 8 mm2 for A10 foam. In Fig. 3, the designation “#” on the x-axis shows the number of cells bigger than 10 mm2 (≈3.6 mm equivalent diameter). The percentage of bigger cells to total number of cells is approximately 5–6% for A00, A03, and A05 foams and 24% for A10 foams.
Histogram showing the distribution of the number of cells according to the cell area and according to the eccentricity of the cells, for the samples (a, b) A03 and (c, d) A10.

The eccentricity is calculated by assuming each cell as an ellipse and then dividing the length of minor axis to the length of major axis of each cell. An eccentricity of 1 means the cell is circle shaped. The average eccentricity values are 0.65 for A00, A03, and A05 foams and 0.72 for A10 foam. According to the eccentricity data obtained from all the samples A00–A10 ceramic addition did not affect the shape of the cells significantly up to 5% and the major axes of the cells are oriented to the direction of foaming as seen in Fig. 2.
B. Microstructure of the foams
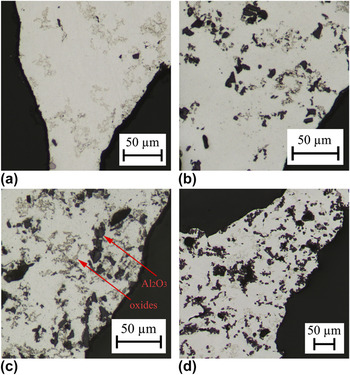
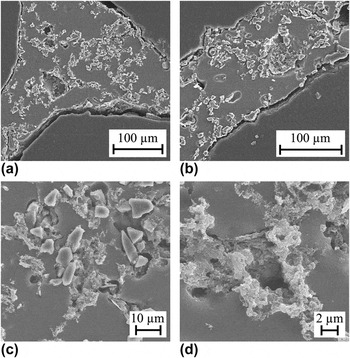
The microstructures of 6061 and composite foams are shown in Fig. 4. All the samples shown were subjected to SHT followed by artificial aging for 16 h. The distinctive features observed are light gray oxide clusters and dark ceramic particle clusters. There are no clearly visible Mg2Si precipitates even after etching meaning a complete solution in the matrix was achieved during SHT. The oxides were presumably covering the surface of the original Al and Mg powders in the blend and their content increased during the high temperature compaction of the precursor. The oxides are accumulated mostly around the grain boundaries. Most of the Al2O3 particles are fully embedded in the matrix and they are observed both on the grain boundaries and inside the grains. However, observations of the moderately etched cell edges also revealed poorly wetted Al2O3 particles as seen in Fig. 5. The figure shows the SEM micrographs of cell wall surfaces of A05 composite. In Figs. 5(a) and 5(b), the plateau border and the cell wall area are shown. A connected structure of ceramic particle clusters with oxide clusters covers the surface of the plateau and the cell wall. The idea of balancing cell wall thinning by the sucking effect of plateau borders of the foam can be theoretically achieved by building mechanical barriers between the approaching two liquid–gas interfaces as discussed by Körner et al.Reference Körner, Arnold and Singer5 If the still foaming melt were purely liquid, this would not be possible since liquids cannot transfer mechanical forces. KörnerReference Körner20 developed a numerical model to illustrate the underlying stabilization mechanism, a barrier effect for the liquid metal produced by particles confined in cell walls during foam formation. The solid particles in the melt induce a long-range interfacial force called the disjoining pressure, which stabilizes the foam. Figures 5(c) and 5(d) show oxides penetrating deeper into the cell wall supporting the idea of network structure of the oxides. Dudka et al.Reference Dudka, Garcia-Moreno, Wanderka and Banhart21 investigated oxide distributions in the PCM foams by sequential focused ion beam slicing and constructing tomographic imaging and found a complex hierarchical structure of the oxides supporting our observations. In addition to oxide clusters, composite foams have Al2O3 particles that act as a mechanical barrier, surface energy, and viscosity modifier, and therefore they improve the foam stability.
Optical micrographs showing the cell wall microstructure of the foams after SHT followed by artificial aging for 16 h: (a) A00, (b) A03, (c) A05, and (d) A10 foams.

SEM micrographs showing the cell wall microstructure of A05 foam after grinding, polishing, and moderately etching: (a) general view of the cell wall plateau, (b) Al2O3 particles and oxides on the cell wall along the cell edges, (c) Al2O3 particles and oxides sharing similar locations on the cell wall, (d) oxides penetrating to the depths of the cell wall.

C. Microhardness test
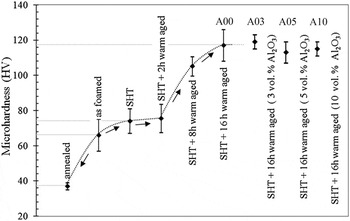
Microhardness tests were performed for specimens in different heat treatment states. Peak hardness of the 6061 foams was reached after SHT and 16 h of aging at 175 °C. Same heat treatment temperature and time was applied to composite foams. Figure 6 shows the hardness measurement results of 6061 and 6061 + Al2O3 foams. There is considerable variation of hardness values within the samples except the annealed sample, which was not SHT and quenched. Hardness of 6061 samples under foamed condition is very close to SHT and SHT + aged samples when aging time is <2 h. This shows that air cooling after foaming might act as SHT and quenching heat treatments. The scatter in the hardness values suggests a low and nonuniform thermal conductivity of the foams affecting the cooling rate of different sections of the foam in SHT quenching. The hardness of composite foams is very close to 6061 foams indicating the Mg content in the solution was not influenced by chemical reactions with Al2O3.
Microhardness of the foams after different heat treatments.

D. Compression behavior of the foams
The mechanical properties of the foams, which are significant for design and application purposes, are elastic modulus and strength. These properties can be found through compression testing. Precautions must be taken during the preparation of specimens for compression testing. First consideration is the solid skin that is present after removal from the mold. The solid skin can sometimes be as thick as 1 mm and forms a shell around the cellular structure. Second consideration is the foaming direction. Since the height of the compression specimen was about 60 mm to obtain a requisite h/d ratio, it was inevitable to have a density gradient and anisotropic cell structure in the foam body. In general, bottom of the foams were denser because of drainage and the cell dimensions were observed to be shorter in the transverse direction. The solid skin, density gradient, and direction of compression may affect the measured strength and compression stiffness of the foams. Solid skin also hides the macrodefects (e.g., very large cells) in the structure of the foams and causes erroneous calculation of density and measurement of the strength. Therefore, in this study, the solid skin and the top and bottom parts of the foams were removed by machining, and compression was done parallel to the foaming direction.
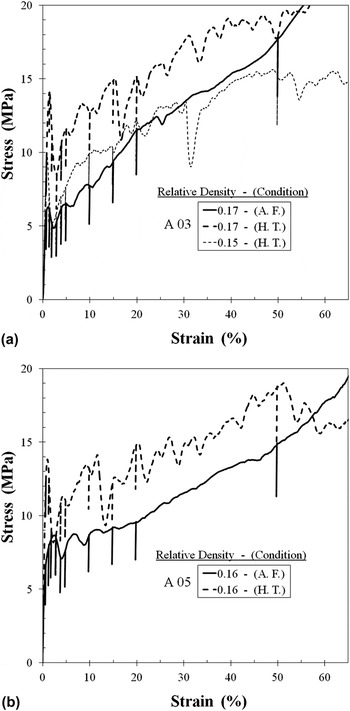
Foams with similar relative densities were used for comparison of the behavior after full heat treatment (SHT + 16 h aging). Compression curves of the 6061 foam sample (A00) and the composite foam samples (A03–A10) were obtained and those of samples A03 and A05 are presented in Fig. 7. Compression curves for the foams under foamed condition (solid lines) are relatively smooth. This is a typical behavior observed in ductile foams. An exception is A10 foam, which has a wavy curve. This can be attributed to the density of the foam and to the ceramic addition, which can affiliate brittleness to the metal matrix. The slight waviness observed in the compression curves of A03 and A05 foams suggests that the latter is more effective. The curves of heat-treated foams (dashed lines in Fig. 7) are different. First, they show a stress peak when strained up to 1–2%. There is a drop in stress after the peak followed by an oscillating curve where the stress raises moderately with increasing strain. The difference observed in the two groups of curves is an indication of different failure modes of the cells. In compression, closed cell ductile foams collapse plastically generally by bending and/or stretching of the cell walls. In the beginning, failure is localized in a band transverse to the loading direction usually at the upper section of the foam where the density is lower. With the increasing strain, the deformation band propagates throughout the foam and new bands may start to form at different sections at the same time. There is continuous rise in the stress with the strain since density of the foam is also increasing continuously with progressive compression. The measured deformations in foamed samples are a result of these interactions. A similar behavior is observed in heat-treated foams except this time some of the cell walls are broken and crumbled since the matrix have become relatively brittle. Fracture of the cell walls affects the deformation curve in two ways. At the beginning of the loading, cell walls start to bend and a sudden fracture occurs since the cell walls cannot deform plastically anymore. There is a drop in stress or softening until the fractured deformation band is densified and the foam continues to carry the load. This cycle continues progressively with increasing strain with a mixture of deformation modes in which cell walls bend plastically and crush in a brittle manner. When some portion of the cell walls crumble and fall off, they do not contribute to densification. Because of this, heat-treated foams tend to start densification later than the foams with the same relative density under foamed condition.
Compression stress–strain behavior of heat treated (HT) and as foamed (AF) 6061 and composite foams: (a) A03: 3 vol% Al2O3, (b) A05: 5 vol% Al2O3.

The elastic stiffness of the foam in compression, E*, was determined from the slope of the unloading lines (Fig. 7). Unloading lines at different strain levels starting from 0.85% up to 50% strain were measured. There was negligible change at strains up to 10%. At 20% and 50% strain, the values were higher since the density of the deformed foam had increased significantly. For all the specimens, elastic stiffness in compression was taken from the maximum value of the slope of unloading lines measured until 10% strain.
Gibson and AshbyReference Gibson and Ashby22 have explained some basic mechanical properties of the metallic foams related to the relative density, so-called the “scaling laws.” The unloading modulus of a closed-cell foam (E*) is related to the elastic modulus of the cell wall material (E s) and to the relative density of the foam (ρr = ρ*/ρs) according to
 $${{E^* } \over {E_s }} = C_1 \left[ {\phi ^2 \left( {{{{\rm{\rho }}^{\rm{*}} } \over {{\rm{\rho }}_s }}} \right)^2 + \left( {1 - \phi } \right)\left( {{{{\rm{\rho }}^* } \over {{\rm{\rho }}_s }}} \right)} \right]\quad ,$$
where  $\phi$ is the fraction of solid in the foam which is contained in the cell edges of the foam. The remaining fraction of solid is contained in the cell faces. C 1 is a parameter that is related to the topology of the foam and varies from 0.1 to 1.0 for different kind of foams.Reference Ashby, Evans, Fleck, Gibson, Hutchinson and Wadley18
If the fraction of solids in the cell edges is taken as 100%, then the foam is open cell and the relation can be written as follows:
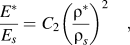 $${{{E^*}} \over {{E_s}}} = {C_2}{\left( {{{{{\rm{\rho }}^*}} \over {{{\rm{\rho }}_s}}}} \right)^2}\quad ,$$
where C 2 is again the parameter that is related to the topology of the foam and varies between 0.1 and 4 for different kind of foams.Reference Ashby, Evans, Fleck, Gibson, Hutchinson and Wadley18 To allow for comparison of the measured modulus with the results of this equation, the foam moduli measured were normalized by the cell wall modulus, E s = 70 GPa for 6061 foams. The cell wall moduli of the composite foams were calculated using the equationReference Ashby23:
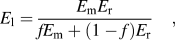 $${E_{\rm{l}}} = {{{E_{\rm{m}}}{E_{\rm{r}}}} \over {f{E_{\rm{m}}} + (1 - f){E_{\rm{r}}}}}\quad ,$$
where E l is lower bound elastic modulus of a composite material, E m is the elastic modulus of the matrix material (E Al alloy ≈ 70 GPa), E r is the elastic modulus of the reinforcement material (E Al2O3 ≈ 400 GPa), and f is the volume fraction of the reinforcement. Using this equation, E s values (E s = E l) for 3, 5, and 10 vol% Al2O3 reinforced matrices were calculated as 71.8, 73.0, and 76.3 GPa, respectively.
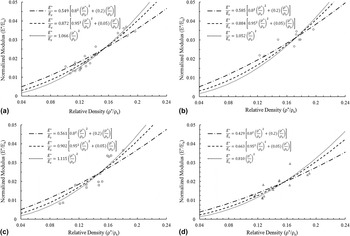
Figure 8(a) shows the normalized unloading modulus (E*/E s) versus relative density (ρ*/ρs) plots of 6061 foams. The lines on the plot belong to the correlations made according to Eqs. 1 and 2. For the relative density values ≤0.16, the scaling law for closed cell foams has a better fit to the experimental data. The correlations made are for  $\phi$ = 0.95 and 0.80, fraction of solids in the cell edges and remaining solid (1 −
 $\phi$) in the cell faces. However, overall data fit better to the correlations made by Eq. 1 with solid fraction of 95% for closed cell foams and Eq. 2 which is for open cell foams. For low relative density values the second linear term in Eq. 1 dominates, implying that cell face presence is more significant in the mechanism of deformation in closed cell foams. In Fig. 8(a), this behavior can be observed if the E*/E s values of the correlation lines below and above ρr = 0.16 are compared. When relative density is increased, values obtained from the model for open cell foams are higher.

The experimental data for composite foams were normalized by the E s values calculated from Eq. 4. Figures 8(b)–8(d) shows the normalized modulus versus relative density plots and the correlations made using Gibson and Ashby model.Reference Gibson and Ashby22 Experimental data fit better to the correlations made by Eq. 1 with solid fraction of 95% for closed cell foams and Eq. 2, which is for open cell foams.
Experimental data and the correlation equations between relative density and normalized modulus show that compression properties of the foams are close to the values expected from open cell foams. C 2 values obtained for open cell foam model are also close to each other for A00, A03, and A05 foams. This value is considerably low for A10 foams.
McCullough et al.Reference McCullough, Fleck and Ashby24 analyzed compressive stress–strain behavior of 6061 foams. The specimens they have used for compression test were cut from flat plates of Alulight foam. Their solid skin was removed. When testing was done in the longitudinal direction (perpendicular to the foaming direction) the experimental data of unloading modulus for the relative density range ρ*/ρs = 0.1–0.4 was approximated by
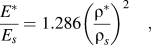 $${{{E^*}} \over {{E_s}}} = 1.286{\left( {{{{{\rm{\rho }}^*}} \over {{{\rm{\rho }}_s}}}} \right)^2}\quad ,$$
which is close to the values obtained for A00, A03, and A05 foams. The test could not be performed in the foaming direction since the height of the panel was only 9 mm including the solid skin. Therefore, they have used small cuboid foam specimens and dimensions were 15 × 10 × 7.5 mm. The reason for the difference in the correlations can be due to the geometry and lower height to thickness ratio of the specimens they used. In addition, it may be necessary to compare the results in the same relative density range, which was maximum 0.2 in this study.
According to Gibson and AshbyReference Gibson and Ashby22 the compression strength of a closed cell metallic foam σcs is related to the yield strength of the cell wall material σy by:
 $${{{{\rm{\sigma }}_{{\rm{cs}}}}} \over {{{\rm{\sigma }}_{\rm{y}}}}} = {C_3}\left[ {{\phi ^{1.5}}{{\left( {{{{{\rm{\rho }}^*}} \over {{{\rm{\rho }}_s}}}} \right)}^{1.5}} + \left( {1 - \phi } \right)\left( {{{{{\rm{\rho }}^*}} \over {{{\rm{\rho }}_s}}}} \right)} \right]\quad ,$$
where  $\phi$ is the fraction of solid in the foam which is contained in the cell edges of the foam. C 3 is a parameter that is related to the topology of the foam and varies from 0.1 to 1.0 for different kinds of foams.Reference Ashby, Evans, Fleck, Gibson, Hutchinson and Wadley18 For open cell foams, the scaling law can be written as:
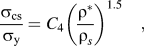 $${{{{\rm{\sigma }}_{{\rm{cs}}}}} \over {{{\rm{\sigma }}_{\rm{y}}}}} = {C_4}{\left( {{{{{\rm{\rho }}^*}} \over {{{\rm{\rho }}_s}}}} \right)^{1.5}}\quad ,$$
where C 4 is a parameter and varies from 0.1 to 1.0.Reference Ashby, Evans, Fleck, Gibson, Hutchinson and Wadley18 The yield strength of the cell wall material, 6061 can be estimated by using the microhardness measurement results. As shown in Fig. 6, hardness of as foamed samples is approximately 65 kgf/mm2. After SHT and aging, this value increases to 118 kgf/mm2. Lehmus and BanhartReference Lehmhus and Banhart17 studied the effects of heat treatment on the aluminum foams with a similar chemical composition. The maximum hardness they have found after SHT and aging is HV ≈ 100 ± 15 kgf/mm2 which is consistent with the values obtained in this study. Assuming the yield strength of the cell wall material, σy, is equal to HV/3, and the yield strength of 6061 foams can be found to be 215 MPa after foaming and 385 MPa after full heat treatment. These values were used to normalize the measured compression strengths of the foams.
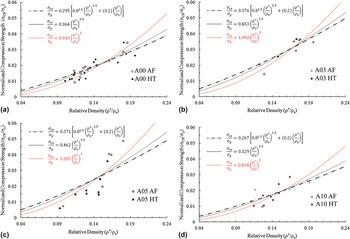
Compression strengths (collapse strength) of the foams were determined from the initial peak of the deformation curves. When the peak was not significant, values were taken from the maximum stress value of the flat portion of the curves at strains <3%. Correlation curves together with the normalized experimental data of 6061 and composite foams are given in Fig. 9. Microhardness measurements have shown that ceramic addition does not change the strength of the matrix alloy significantly. Therefore, the same solid yield strength values were used for composite foams. Best fits to the correlation equations are achieved by assuming that foams were open cell. Although scaling law specifies that normalized compression strength is proportional to  ${\rm{\rho }}_{\rm{r}}^{1.5}$ some of the experimental data showed a better fit when it is proportional to
 ${\rm{\rho }}_{\rm{r}}^2$.
Normalized compression strength–relative density for (a) A00 foams, (b) A03 foams, (c) A05 foams, and (d) A10 foams (AF: as foamed, HT: heat treated).

As seen in the correlations presented in Figs. 8 and 9, for the same relative density, stiffness values of A00, A03, and A05 foams are close to each other and these foams are stiffer than A10 foams. Compression strength of A10 foams is lower than the others because of the imperfect cell structure and high-density gradient observed in these foams. When the relative density is above 0.15, A05 foams have higher strength values than predicted by the correlation equations. The results show that foams behave essentially as open cell foams. Figures 4 and 5 show that while a fraction of ceramic particles are embedded inside the metal matrix some of them are pushed to the interface between the gas and the liquid during foaming and solidification. In addition, as seen in Fig. 4, the particles are not distributed evenly but are found as clusters in the aluminum matrix. This probably decreases the extent of strengthening effect expected of composite foams by ceramic addition.
IV. CONCLUSIONS
The role of Al2O3 particle addition on the structure, hardenability, and mechanical properties of closed cell PCM 6061 foams can be summarized as follows:
(1) Foam macrostructure changes with Al2O3 addition. 3 and 5 vol% ceramic particle addition decreases drainage, but image analyses with Matlab show that it does not change the number of cells and the roundness of cells significantly. 10 vol% ceramic addition, however, decreases the number of cells, increases drainage, and causes an inhomogeneous cell size distribution. 24% of the cells are larger than 3.6 mm in diameter. This value is lower than 6% for other foams.
(2) Al2O3 addition does not affect hardenability of the foams. Both 6061 and composite foams can be hardened by heat treatment. Hardness values of the foams increases from HV 66 ± 9 (after foaming) to HV 117 ± 9 (fully hardened).
(3) Collapse stress and unloading modulus of the foams increases nonlinearly with relative density. Al2O3 addition does not affect the collapse strength of the foams significantly because only a portion of the ceramic particles are embedded in the aluminum matrix. Rest of the ceramic is pushed out on to the cell walls and poorly wetted. However, for the same relative density, unloading modulus increases with 3 and 5 vol% ceramic additions.
(4) Experimental results and correlations relating to the unloading modulus and compression strength of the foams with the relative density shows that the contribution of the cell faces to the mechanical properties of the foams are low hence, the foams behave mechanically as open-cell foams.
ACKNOWLEDGMENTS
This work was supported in part by the Turkish State Planning Agency (DPT-03K120250) and Bogazici University Scientific Research Projects (BAP-07A603D).