1 Introduction
The last decade of the 20th century was characterized by the reincorporation of the study of inequality to the core of economic analysis. Academic interest in distributive issues has since had two different objectives: on the one hand, the analysis of economic inequality as an endogenous variable (trying to explain distributive patterns) and, on the other hand, its study as an exogenous variable (analysing its impact on other variables such as economic growth). This paper adopts the first perspective and tries to describe and explain the evolution of inequality in Portugal over the 20th century.
There are not many analyses of long-term Portuguese inequality. In a recent paper, Lains et al. (Reference Lains, Gomes and Guilera2008) estimated and analysed the evolution of Portuguese wage dispersion between 1944 and 1974. This paper, however, provides an estimation of top incomes and wealth shares from 1936 onwards as the main empirical basis of the analysis.
Historical estimation of top income and wealth shares (TIS and TWS) from fiscal sources is a frequent strategy to measure long-term inequality, given the scarcity of other sources of information that could provide better and more comprehensive indicators, such as household budget surveys (see Atkinson and Piketty Reference Atkinson and Piketty2007). Although TIS are a partial measure of inequality, Leigh (Reference Leigh2007) demonstrated that they may constitute a good proxy for global income inequality for the second half of the 20th century. The new indicators of long-term Portuguese economic inequality presented here may contribute to increase the number of countries for which information on TIS and TWS is available.
The Portuguese TIS presented in this paper show a decrease in inequality during the Second World War, which was then compensated for in the early 1950s. In contrast, TWS remained unaffected by the conflict and grew continuously until the mid 1950s. From the mid 1950s till the early 1980s, both TIS and TWS declined sharply. Finally, during the 1990s, TIS increased again.
This is not the only estimation of Portuguese TIS. Alvaredo (Reference Alvaredo2008, Reference Alvaredo2009) provided an alternative series, which has some differences from ours. Appendix 2 of this paper analyses these differences and shows that they are a result of a more critical study and discussion of the sources in our case, which is accompanied by greater transparency in the treatment of data and also a more accurate and balanced interpretation of the results.
The study of the Portuguese case has an intrinsic value, because it allows an analysis of the distributive impact of the two features which, according to economic theory, are essential to an understanding of the evolution of inequality: political regimes (dictatorship vs. democracy) and economic growth. In this regard, in 1926, a military coup put an end to the Republican period in Portugal and established a dictatorship that lasted till 1974. This was characterized by intense political repression and a significant lack of public liberties. This long dictatorship also prohibited labour unions and any kind of workers’ movement in order to keep wages down, a situation which should have increased income inequality. In spite of this, from the mid 1950s onwards, inequality, measured through both TIS and TWS, began to diminish. After the Revoluçao dos Cravos of 25 April 1974, which marked the end of the dictatorship and opened the democratic era, TIS and TWS continued falling, but at the same pace as during the pre-democratic era. Finally, the last years of the 20th century were characterized by an intense increase in TIS. At first sight it would seem that, contrary to what could be expected, political variables were not decisive in determining distributive patterns in Portugal throughout the 20th century.
The other main characteristic feature of recent Portuguese history was the country’s rapid economic growth during the golden age of capitalism. Portugal, following the south European pattern, was catching up quickly with the core European countries during most of the 20th century (Lains Reference Lains2003a). These new TIS and TWS series, jointly with the estimation of global wage inequality between 1944 and 1974 by Lains et al. (Reference Lains, Gomes and Guilera2008), point to the fact that structural change was the main force driving the evolution of income inequality during the transition from an agrarian economy towards an industrialized and service-oriented one.
The remainder of this paper is structured as follows: section 2 presents the data and methodology used; section 3 shows the main results; section 4 tries to account for the causes behind the inequality trends and section 5 concludes.
2 Data and methodology
The methodology used to derive TIS and TWS is based on the pioneering paper by Piketty (Reference Piketty2001) and involves estimating the TIS and TWS of the richest fractiles of the population. Information on individual incomes and wealth comes from tax return statistics, structured in different income and wealth brackets. To obtain the different TIS and TWS, the number of tax units and their incomes or wealth is divided by the total reference population and the total reference income or wealth, respectively. The estimation of income and wealth thresholds and the income and wealth belonging to each fractile is calculated by assuming that incomes and wealth are distributed according to a Pareto function.
2.1 Top Income Shares
The main basis for the estimation of TIS is Portuguese income tax, which underwent significant transformations after the first attempt to introduce it, in the context of the failed fiscal reform in 1922. The ambition and complexity of this reform, the prevailing administrative weakness, government instability and tax evasion are some of the factors that may explain the complete failure to implement the tax system in that year. In 1929, a commission headed by Antonio de Oliveira Salazar designed a new fiscal reform aimed at producing a simpler system, one that was more likely to be applied. The main concern of the reformers was to increase public revenues in order to be able to balance the government budget, which had been out of control since the First World War (Leitao 2001)Footnote 1.
The new fiscal system did not imply a complete change with respect to the previous one, and was characterized by the existence of several taxes for specific types of income. These different taxes were applicable to the «normal» or presumed returns of taxpayers, and not to the actual figures as in modern fiscal systems. The sum of all the returns assessed by the specific taxes was then taxed again by the imposto complementar (complementary tax) with progressive rates. More specifically, the returns taxed by the imposto complementar were the sum of the assessed returns in the contribuiçao predial (land tax), imposto sobre a industria agrícola Footnote 2 (agricultural industry tax), contribuiçao industrial (industrial tax), imposto profissional (professional tax) and imposto sobre a aplicaçao de capitais (capital tax). The imposto complementar had two sections: section A for individuals and section B for entities. The replacement of the imposto pessoal (the failed personal tax system established in the 1922 reform) by the imposto complementar was a step backwards in terms of modernizing the design of the Portuguese fiscal system, but it had two positive features: it introduced a soft personalization and, most importantly, it was fully implementedFootnote 3.
This system remained effective until the 1958-1965 fiscal reform, which was intended to introduce real income assessment and to leave behind the «normal» or presumed income tax system. Nevertheless, it maintained the prevailing fiscal structure, that is to say, separate taxes for different kinds of incomes and a superposed tax over them all: the imposto complementar. This reform was drawn up by a commission headed by Teixeira Ribeiro, who some years later denounced the move away from the principles established in the reform, such as the return determination system, which, in some cases, ended up being characterized again by the «normal» or presumed income assessment (Ribeiro Reference Ribeiro1968).
Later, the new constitution approved in 1976 set out the principles that should characterize the Portuguese fiscal system under the new democracy. However, although these principles contradicted the existing tax structure, the necessary fiscal reform was not implemented until 1988. This reform was guided by three principles: equity, efficiency and simplicity. The previous system was completely abandoned. The taxation of personal incomes became entirely covered by one single tax: the imposto sobre o rendimento. This tax has two sections, the IRS (imposto sobre o rendimento das pessoas singulares) for individuals, which has been used for our estimations, and the IRC (imposto sobre o rendimento das pessoas colectivas) for entities. The IRS is direct, personal and based on real returns assessment. This latter reform allowed Portugal to join the group of countries with a modern fiscal system.
As regards tax rates, these have always been progressive, although they have changed significantly since the first personal income tax was established. The tax rate structure evolved in two different directions. On the one hand, the number of marginal rates decreased from almost 200 during the 1930s to between four and five during the 1990s. On the other hand, the top marginal tax rate increased rapidly after the mid 1940s. It was 4.97 per cent until 1945, rose to 30 per cent between 1946 and 1963, to 45 per cent between 1964 and 1975 and to 80 per cent between 1976 and 1981, after the Revoluçao dos cravos, during the period in which the extreme left ruled the country. Finally, in 1989, it was fixed at 40 per cent. The effects of the second process (the increase in the top marginal tax rate) have been much more intense than those of the first one (the decrease in the number of marginal tax rates) and, as a consequence, Portuguese personal tax has become increasingly progressive since its introduction.
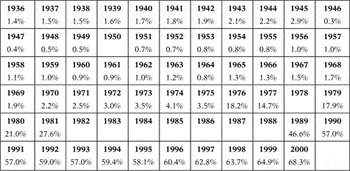
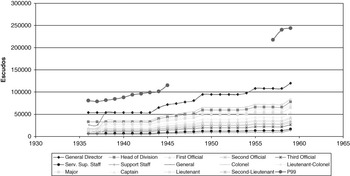
The establishment of an income tax was a slow and progressive phenomenon in most countries over the 20th century. At first, it usually covered a small fraction of the total population, which increased subsequently. In this regard, the Portuguese experience is not an exception. As shown in Table 1, the population covered by the income tax increased from 1936 to 1945, then fell substantially in 1946 (from 2.91 to 0.39 per cent) and, from then on, increased continuously, reaching 68.3 per cent in 2000. This coverage level has allowed the yearly estimation of the top 0.5 per cent income share for the whole period under study. In contrast, there is no information on the top 1 per cent share between 1946 and 1956, and the top 5 and 10 per cent can only be calculated from 1976 onwards, when the coverage increased significantly. In addition, in the Portuguese case, the problem of the low coverage of the income tax is made worse by the exemption for public servants and military personnel from the tax. This exemption, however, is probably not a serious problem for the estimation of the upper TIS presented in this paper, because, as may be seen in Figure 1, those groups’ incomes were not high enough to be included within the top 1 per cent income group. The statistical information published by the Portuguese Ministry of Finance on the income tax returns also varied across time. In order to estimate TIS, the best possible statistical information would be the total returns assessed for each tax unit, distributed among different income brackets. Unfortunately, this information is not available for the whole period studied and a number of adjustments have been necessary in order to obtain a homogeneous series.
INCOME TAX COVERAGE IN PORTUGAL (1936-2000)

Source: Estatística das contribuçoes e impostos and population censuses.
YEARLY INCOMES OF DIFFERENT PUBLIC EMPLOYEES AND MILITARY PERSONNEL AND AVERAGE INCOMES OF THE RICHEST 1 PER CENT GROUP IN PORTUGAL
Source: Oliveira Marques (Reference Oliveira Marques1991) and Batista et al. (Reference Batista, Martins, Pinheiro and Reis1997).

From 1936 to 1945, there is information on the number of tax units, classified into different brackets according to the tax paid. In order to obtain TIS, it has been necessary, first, to classify the information according to the income assessed by each tax unit, rather than to the taxes paid. This was achieved by dividing each bracket threshold by its corresponding tax rate. The second step involves estimating the total amount of income assessed in each bracket. This was done by assuming that the returns were Pareto distributedFootnote 4.
From 1946 to 1963, the statistics published by the Ministry of Finance regarding the imposto complementar give information on the total incomes of all tax units, classified in different income brackets. In addition, for each bracket, there is information on the number of tax units. This is the information needed for the construction of the series, so no adjustment is necessary.
From 1964 to 1981, the statistics published have the same structure, but the concept of income is now taxable income, that is, total income less deductions. There were six kinds of deductions, regulated by the articles 3, 28, 29, 30, 84 and 91 of the complementary tax code. Sixty-eight per cent of deductions were due to article 29 and associated with family circumstances (a personal deduction, a deduction per partner and per number of children). A further 27 per cent of deductions were due to article 28 and were associated with different circumstances, such as different specific taxes paid, social contributions paid by workers, interests and debt obligations, pensions paid by taxpayers and half of the remunerations received by wage-earners. The remaining articles were of minor importance and only accounted for 5 per cent of the total deductions. There is, however, no clear way of knowing how the deductions were distributed among tax units. Were they regressive or progressive? The description of deductions in the tax code is too generalist and does not allow deductions to be added to taxable income. Here, it has been assumed that they were distributed in the same way as before 1963, when there is information on both total income and taxable income distributed among different bracketsFootnote 5. It must be stressed that deductions were quantitatively very important (about 60 per cent of taxable income).
Between 1982 and 1988, statistical information is too aggregated, and does not distinguish between different income brackets. This prevents the estimation of TIS for most of the 1980s. Finally, from 1989 onwards, the official statistics give the same information as between 1946 and 1963. Again, no adjustment is necessary.
The number of income brackets in which tax statistics are classified also varied across time. Until 1945 there were nine income brackets, while between 1945 and 1963, this number rose to thirty-one. Between 1964 and 1976, the number of brackets decreased again to sixteen, falling further to twelve in the period up to 1979 and to eleven up to 1981. During the last period, from 1989 onwards, the number of income brackets was fixed at twenty. In general, although more brackets allow better estimations (less dependent on Pareto assumptions), the number of income brackets over this period is sufficient to guarantee the robustness of the estimations.
Once a homogeneous series for the total income of taxpayers, distributed in different brackets according to their income, has been obtained, the income shares of the top fractiles (P90, P95, P99, P99.5, P99.9, P99.95 and P99.99, equivalent to the top 10, 5 and 1 per cent income shares, etc.) can be estimated. To this end, the first step involves defining the number of tax units that formed the top fractiles. The unit of taxation of Portuguese income tax is a married couple or a single individual. In order to estimate the total reference population, the number of married women has been subtracted from the total population aged 20 years or above. This information has been taken from the Portuguese population censuses, which were published decennially during the period under study. The values between census years have been obtained through linear interpolation.
The following step consists of estimating the income threshold of each fractile, that is, the income of the poorest member of each fractile, and then estimating the amount of income above each fractile’s income thresholdFootnote 6. Finally, this amount must be divided by the total reference income.
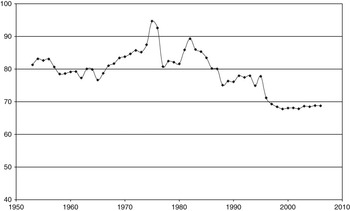
The total reference income should have been obtained from the national accounts, by subtracting from the personal sector income (PSI) those concepts on which income tax was not leviedFootnote 7. However, in the case of Portugal, the information needed to make this adjustment is not available for the whole period under study and, therefore, it has been necessary to take the PSI as the total reference income. PSI figures for 1953-1994 are from Pinheiro (Reference Pinheiro1997) and, from 1995 onwards, from the national accounts published online by the INE (National Statistics Institute). Before 1953, PSI figures are not available, and it has been assumed that, between 1936 and 1952, the average PSI/GDP ratio was the same as in the period 1953-1962 (80.36 per cent)Footnote 8. Thus, GDP data from Batista et al. (Reference Batista, Martins, Pinheiro and Reis1997) have been used to estimate yearly figures of PSI between 1936 and 1953, and a continuous series has been obtained by equalizing the values of PSI in the years in which there is a change of source (1953 and 1995), and by rescaling the series for the previous years (Figure 2).
RATIO PSI/GDP
Source: Pinheiro et al. (1997), Batista et al. (Reference Batista, Martins, Pinheiro and Reis1997) and INE online statistics.

In several years, the scarcity of data prevents us from estimating some TIS and, in these cases, the criteria established by Leigh (Reference Leigh2007) are adopted, that is, the missing data are linearly interpolated if the number of missing years is four or fewer (p. 10)Footnote 9.
The tax statistics have some discontinuities causing some breaks in the series. First, from 1945 to 1946, the characteristics of the statistical information published changed, as described above. However, the adjustments introduced in the estimation have minimized any potential distortions due to this change, and the different series estimated are fairly stable. Second, between 1963 and 1964, the fiscal system was redesigned. As a consequence, between 1963 and 1965, the data show a short but intense increase in the TIS, which may be attributable to the regulation changes in income tax. Finally, between 1982 and 1988, there is a gap in the series and the major changes in tax regulation codes that took place at the time, prevent any comparison between the level of the TIS in 1981 and 1989. Actually, TIS of 1980 turn out to be clearly understated when compared with the estimate of the top 10 per cent provided by other sources such as the Household Income and Expenditure Survey (HIES)Footnote 10. In sum, there are two significant discontinuities in the series (1963 and 1982-1988), which must be corrected in order to estimate long-term coherent series.
In order to have a consistent long-term view of the evolution of TIS, these discontinuities have been dealt with according to the following criteria. First, given that figures for 1965 are more reliable than those of 1963 (before the fiscal reform), the TIS levels of 1963 have been assumed to be the same as in 1965 and have been projected backwards accordingly.
Second, given that the TIS for 1980 are clearly understated, we have taken the values provided by HIES as the top 10 per cent of income shares of 1980. The top 10 per cent income share levels of 1990 have also been modified in the same way to make them comparable with the previous years. The remaining TIS for 1980 and 1990 have been adjusted to the level of the top 10 per cent TIS. To estimate TIS after 1989, the TIS levels of 1990 have been projected backwards and forwards according to the growth rates of the different TIS. As for 1965-1980, we have kept the 1965 value, from fiscal sources, and TIS between 1965 and 1980 have been adjusted by applying the growth rate of the different TIS corrected by the ratio (fiscal TIS 1965 − HIES TIS 1980)/(fiscal TIS 1965 − fiscal TIS 1980)Footnote 11.
As noted above, Appendix 2 compares our estimation of TIS with that of Alvaredo. These two estimations have three major differences: the method used to add deductions to taxable income, the total reference income and generally increased transparency in the treatment of the original data in our estimation. All these differences suggest greater reliability in the case of our series.
2.2 Top Wealth Shares
The methodology used to derive TWS is the same as that used to estimate TIS. The information on the individual stock of wealth is taken from the Imposto sobre sucessoes e doaçoes (estate tax). This tax was levied on the stock of wealth above a minimum threshold left by the decedents. In practice, this tax mainly assessed real estate with cadastral values (Valerio Reference Valerio1994). In spite of this, during the period studied, most wealth was in the form of real estate, and thus, this source would be a good proxy of the total wealth left by decedents. The Portuguese tax authorities published detailed information for estate tax returns from 1936 to 1982. However, after this year, the reported information became too aggregated to allow the estimation of TWS. The characteristics of the statistical information published until 1982 are almost constant over time, and the source reports the number of taxpayers distributed in different wealth bracketsFootnote 12. The total reference wealth is the total wealth declared by the decedents, and the total reference population is the number of dead people over the age of 19 years. This last piece of information was taken from the Portuguese population censuses, and figures between censuses have been obtained through linear interpolation.
The coverage of the source is very high throughout the whole period under analysis. It was above 60 per cent of deceased people till the mid 1950s, and increased from then on, to fluctuate between 80 and 90 per cent since the mid 1960s. These high coverage rates indicate that almost all the decedents who left some legacy to their heirs were covered by this tax.
The source provides the total wealth of the decedents minus tax exemptions, distributed among different wealth brackets. The tax statistics also provide information on tax exemptions and people exempt from paying taxes, classified into different brackets according to their wealth. These have been added to the taxed wealth and individuals and the resulting figures have been used to estimate the series.
With regard to the cadastral valuation of real estate, the possible distortions that could be introduced by this system would not be very significant because wealth underestimation would affect both the numerator and the denominator (total reference wealth) and the possible biasing effects would be counterbalanced.
The sample of observations from the estate tax is clearly biased in terms of age. The usual way to correct this is the estate multiplier method, which involves dividing the sample into different age groups and dividing each of them according to its mortality rate. Unfortunately, Portuguese tax sources do not provide the age of the decedents, and the measures of inequality presented refer to the deceased and not to the living population. Given that, in general terms, people tend to increase their wealth throughout their lives, the estate tax observations are likely to miss the relatively young and poor people and, then, to understate the level of the TWS. In this regard, other case studies show ambiguous outcomes on the possible distortions derived from the non-application of the estate multiplier method. In France and Sweden, the age bias of this kind of sample has had a minimal impact on wealth concentration estimations, whereas in the United Kingdom, it was sizeable (Piketty et al. Reference Piketty, Postel-Vinay and Rosenthal2006; Roine and Waldenström Reference Roine and Waldenström2007; Atkinson et al. Reference Atkinson, Gordon and Harrison1989).
3 The facts
Several different periods may be distinguished in the evolution of Portuguese TIS and TWS. First of all, the Second World War seems to have had a significant impact on TIS. Although Portugal was neutral during the war, the conflict may have eroded TIS until 1945. Subsequently, the situation changed and by the early 1950s, TIS had recovered their pre-war values. In contrast, TWS remained unaffected by the conflict, following an increasing trend that lasted at least until the mid 1950s. The second period was characterized by a significant decrease in both TIS and TWS. After several years of relative stability of TIS and increasing wealth concentration, from the late 1950s onwards both magnitudes fell substantially until 1981. Finally, the third period, from 1989 onwards (for which there is no information on wealth shares), was again characterized by an increase in TIS. The next paragraphs describe these changes in more detail.
3.1 Top Income Shares
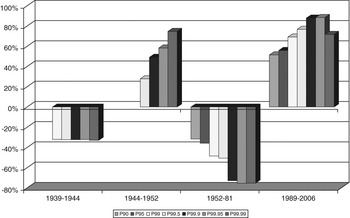
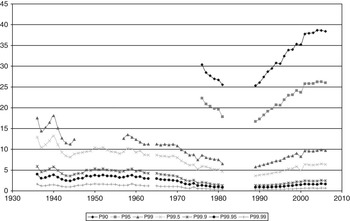
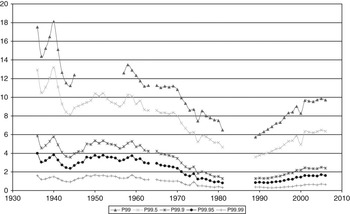
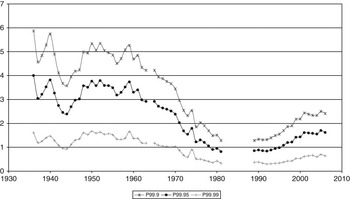
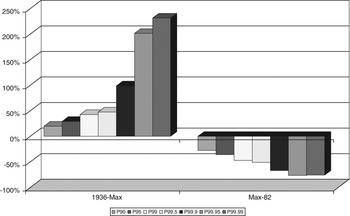
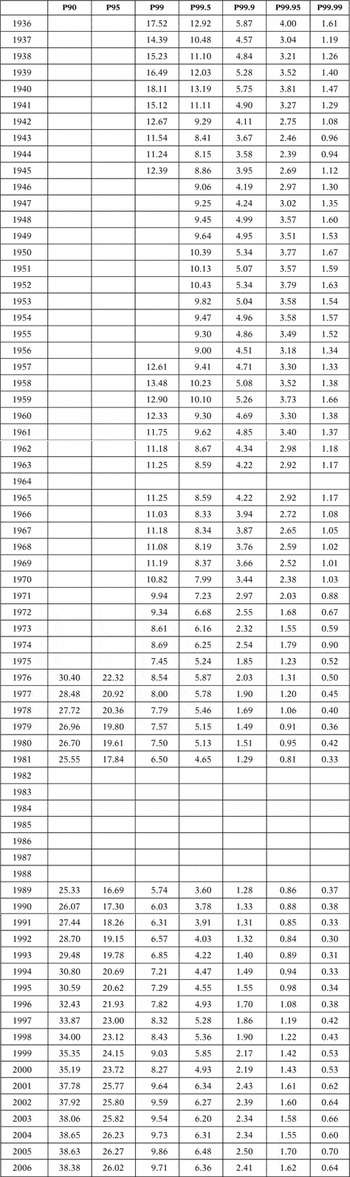
As can be seen in Figure 3, TIS fell by 30 per cent between 1939 and 1944. This decrease was quite similar for all the fractiles for which information is available (top 1 per cent and above). The recovery of TIS after the Second World War also affected all fractiles, but was more intense for those located at the end of the income distribution. This meant not only an increase in inequality between the very rich and the rest of the population, but also a wider dispersion within the richest 1 per cent. Later, from the early 1950s to the early 1980s, TIS declined considerably. The decrease between 1952 and 1981 was again higher for those fractiles located at the end of income distribution, that is, there was a process of income convergence within the richest 1 per centFootnote 13. The lack of statistical data makes it impossible to discern what happened between 1981 and 1989, but, after this parenthesis, TIS increased until the end of the period under study. To observe these trends in more detail, Figures 4, 5 and 6 show the evolution of different TIS from 1936 onwards. Indeed, once the shock of the Second World War had been overcome, the most outstanding feature of the different figures is the huge decline in TIS that took place from the late 1950s to the 1980s and its increase during the last two decades.


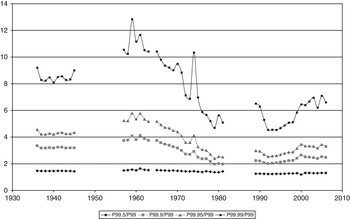
Figure 7 shows different ratios that reveal how many times richer (on average) tax units from the upper percentile of each ratio were than tax units from the lower one. The top 1 per cent is taken as reference because it is the largest share for which information is available for almost all years. Increases in the different ratios indicate an increasing dispersion among the very rich and vice versa. As can be seen in this figure, the different ratios evolved in the same direction. There was a relative stability until the mid 1940s, while from then to the late 1950s there was a process of slight divergence; however, data for this period are not complete and it is only possible to compare 1945 with 1957. From the early 1960s to the late 1970s there was a significant convergence process. From the late 1980s to the early 1990s the ratios fell and they increased again until 2005. The ratio P99.99/P99 is perhaps the most appropriate for characterizing the dispersion between the very rich. Until the mid 1940s the top 0.01 per cent was around eight times richer than the top 1 per cent, and in 1959 this ratio reached its historical maximum (12.8). From then onwards, it began to fall dramatically, and in 1979, the top 0.01 per cent was only 4.7 times richer than the top 1 per cent. Nevertheless, in 1974, this ratio peaked at almost 11, during a short but intense rise-and-fall movement that could be related to the major political changes of that yearFootnote 14. In 1989, the ratio was 6.5, it fell to 4.5 in 1992 and it increased again to 7 in 2005.

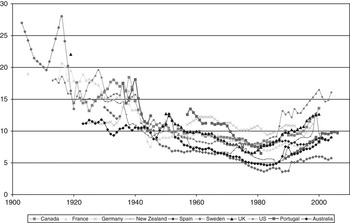
Figure 8 compares the top 1 per cent income shares of nine developed countries with the new series. As may be seen in the graph, there is a common long-term decline in the series until the mid 1970s. It can also be seen that the shock of the Second World War provoked a significant decline in the top 1 per cent income shares of most countries. However, unlike what occurred in other countries, TIS in Portugal, Australia and New Zealand recovered their pre-war values in the early 1950sFootnote 15.

After the mid 1970s, whereas TIS increased in the Anglo-Saxon countries, they remained more or less stable in other countries (Piketty and Saez Reference Piketty and Saez2006). Once again, Portugal seems to have bucked this stylized trend because, at least from the late 1980s onwards, TIS in Portugal clearly increased.
The comparison of TIS levels among the different countries may be more problematic because of the disparity in the tax systems and their accuracy. Taking this into account, it seems that Portugal was a «member» of the high TIS group until the 1970s, but it became a low TIS country from the 1990s onwards. In this regard, contemporary Portugal has usually been included among those European countries with a higher degree of inequality (Rodrigues Reference Rodrigues1999). However, TIS seem to indicate that the very rich are not at the root of this phenomenon, and that it may, instead, be a poverty-related issue, because the Portuguese TIS have been low in comparative terms during the last two decades.
3.2 Top Wealth Shares
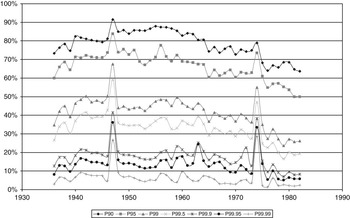
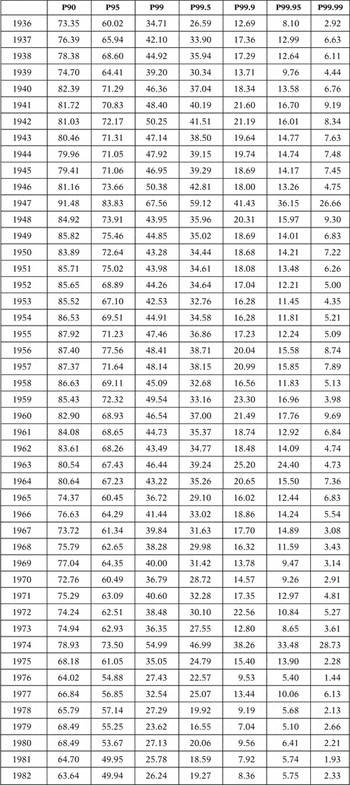
As may be seen in Figure 9, the evolution of TWS may be divided into two different periods. Until the mid 1950s or the early 1960s (depending on the share), they increased considerably, especially in the case of the richest fractiles. This is consistent with both a process of increasing inequality between the very rich and the rest of the population and a process of wealth divergence within the very rich group. The situation changed subsequently and TWS declined continuously until at least 1982. The decrease in the TWS was again more intense in the case of the richest fractiles, that is, there was a process of decreasing inequality between the very rich and the rest of the population and also a process of wealth convergence within the very rich group.

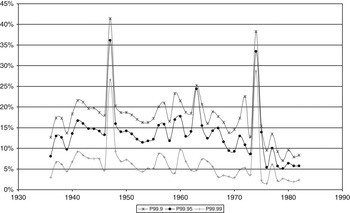
Figures 10 and 11 show the yearly evolution of TWS, which followed an inverted U-curve with maximum values of wealth concentration during the mid 1950s and early 1960s. These figures also show two short but very intense increases in TWS in 1947 and 1974, which can be explained by the impact that the death of a few very rich individuals may have had on this kind of estimation. In this sense, in both 1947 and 1974, two extremely rich citizens died in the district of Lisbon, which explains these two peaksFootnote 16.


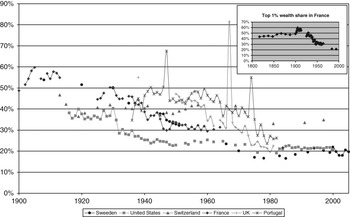
In the case of wealth concentration, the Portuguese experience is somewhat exceptional in a comparative perspective, as may be seen in Figure 12. In most other countries (with the partial exception of Switzerland), there was a long-term decline in wealth concentration throughout the 20th century, whereas in Portugal, it increased till the mid 20th century to decline afterwards. However, from a longer-term perspective, the evolution of wealth concentration in France throughout the 19th and 20th centuries also followed an inverted U-curve. Accordingly, the evolution of Portuguese wealth concentration might fit the pattern of the most industrialized countries, although with a half-century delay.
TOP 1 PER CENT WEALTH SHARE
Source: Roine and Waldenström (Reference Roine and Waldenström2009) for Sweden; Kopczuk and Saez (Reference Kopczuk and Saez2004) for the United States; Dell et al. (Reference Dell, Piketty and Saez2005) for Switzerland; Piketty et al. (Reference Piketty, Postel-Vinay and Rosenthal2006) for France; Atkinson et al. (Reference Atkinson, Gordon and Harrison1989) for the United Kingdom and Table A2.

4 Behind the facts
It is not possible to offer a complete account of the reasons behind the detected trends in Portuguese TIS and TWS here. However, some general considerations may serve as a guide for a future research agenda. Most studies related to TIS defend the idea that the main explanation for the decline of TIS until the 1970s was associated with the shocks of the two World Wars and also with the role of progressive taxation and other public policies. As noted above, Portuguese TIS began to decline in the 1950s, and the Salazar regime was not as committed to the implementation of progressive policies as other developed countries. Thus, we may look for alternative explanations to understand the evolution of TIS, such as the impact of the extraordinary economic growth of the post-war decades.
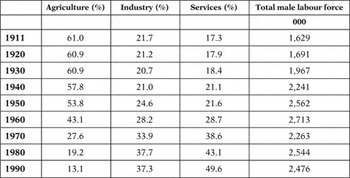
In this sense, one of the main features that differentiated the periods after 1950 from the previous decades in Portugal was the rapid structural change from an agrarian economy to an industrial and service-oriented one, as may be seen in Table 2. The original Kuznets hypothesis relates the process of structural change to the existence of an inverted U-curve in the evolution of income inequality. However, income inequality can be measured in different ways. A measure of income inequality with high population coverage is likely to follow an inverted U-curve during the transition from an agrarian economy to a modern one, for the reasons argued by Kuznets (Reference Kuznets1955). In this sense, Lains et al. (Reference Lains, Gomes and Guilera2008) have confirmed the existence of an inverted U-curve during the Portuguese dictatorship econometrically (with a maximum value in 1959) through the estimation of wage inequality. In contrast, a partial income inequality measure, such as TIS, is likely to show a decline in inequality during this process of transition and for the same reasonsFootnote 17. This is due to the fact that, although the progressive transition of the labour force to better paid jobs could increase inequality within the lower classes (which were more homogeneous in terms of their incomes at the beginning of the process), it may also increase the share of incomes accruing to the bottom fractiles, a process which might prevent top income share increases. This seems to have been the case in Portugal, at least till the 1980s (if the fluctuations associated with the Second World War are excluded). TIS would only increase again after the early 1990s, when the process of structural change was almost complete.
MALE LABOUR FORCE (1911-1950) AND TOTAL EMPLOYMENT (1960-1990)

Sources: Lains (2003b, p. 15) for 1911-1950 and Valério (2001, p. 164) for 1960-1990.
Another event, which may help to explain the decline of TIS from the high levels of the first half of the 20th century, is the skilled labour-intensive growth process experienced by most countries. A larger share of increasingly skilled workers is required for the economy to continue growing and these workers have to be remunerated accordingly. The outcome of this process is the increasing income share of the middle classes that has characterized the mass consumption society, and must also have contributed to the erosion of TIS. In this regard, this process would have a higher incidence once a country has already overcome the first stages of the Kuznets curve, and it would increase the period of time of declining TIS.
Compared with the effects of structural change, political factors seem to have had a minor impact on Portuguese TIS and TWS. During most of the dictatorial period, TIS and TWS declined. In addition, it is surprising to see that the evolution of the different TIS and TWS was not especially sensitive to the profound political and social changes that occurred after the Revoluçao dos cravos of 25 April 1974 and the transition to democracy. TIS and TWS declined during the early years of the democratic era, but at the same pace as during the pre-revolutionary period. This finding is highly relevant from the point of view of Portuguese history, since the country’s upper classes did not seem to have been particularly damaged by the revolutionary process. What is more, during the democratic era, a decrease of TIS through the political channel might have been expected. Once the population obtained a political voice, a more progressive political agenda might have tended to redistribute income and thus reduce TIS. However, just the opposite happened, suggesting a situation of imperfect democracy, with forces such as lobby interests limiting the strength of voters’ demands.
5 Concluding remarks
This paper has presented a new long-term series for the evolution of TIS and TWS in Portugal from 1936 onwards. The Portuguese case study may help to enlarge the current comparative inequality database developed with the methodology established by Piketty (Reference Piketty2001). Available comparative information regarding income inequality has been compiled since the 1950s (Deininger and Squire Reference Deininger and Squire1996), but the methodologies used differ across countries and over time, which seriously limits the consistency of the studies based on these databases. In contrast, TIS and TWS are all estimated from tax sources, following the same methodology, and, in many cases, they provide information for the whole of the 20th centuryFootnote 18.
TIS in Portugal declined during the Second World War and recovered during the post-war period, whereas TWS increased till the mid 1950s. From the mid 1950s to the early 1980s TIS and TWS declined sharply, and then, during the last decade of the 20th century, TIS increased again. This pattern is quite similar to the experience of other countries: the decline of TIS during the «Golden Age» has been observed in most other cases, and their increase during the last two decades seems to put Portugal on a par with the experience of the Anglo-Saxon countries.
The reasons behind the trends observed in Portuguese TIS and TWS remain poorly understood. Here, it has been suggested that the factors governing the evolution of TIS were economic and not political. In this sense, during most of the dictatorship, the TIS declined, and the transition to democracy seems to have had a minor impact on TIS trends. On the other hand, the rapid structural change that occurred from the 1950s onwards seems to be a key factor in an understanding of the Portuguese distributive pattern.
Appendix 1
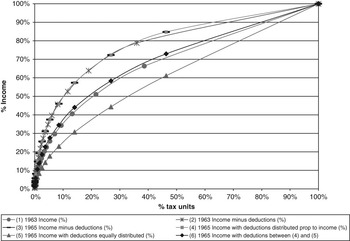
Figure A1 shows the distributional functions of the incomes of the different tax units under different hypotheses in 1963 and 1965. The vertical axis shows the percentage of income (relative to the total income assessed) accumulated through tax units, which are shown in the horizontal axis. The first function (1) shows the distributional function of total incomes in 1963, whereas the second function shows the distributional function of taxable incomes in the same year. As may be seen in the graph, when deductions are subtracted, the distributional function moves upwards. This implies that deductions were progressive to income. For 1965 information is only available for taxable income, which is shown in the third function. This has almost the same shape as taxable income in 1963. In order to allocate deductions among the income of different tax units for 1965, two different scenarios have been simulated and compared with the situation in 1963. The fourth function shows the distributional function of incomes when deductions are allocated proportionally to income, whereas the fifth function shows the distributional function when deductions are equally distributed among all tax units. Not surprisingly, the third and fourth functions have exactly the same shape, because the fourth function is the outcome of allocating deductions in a proportional system. On the other hand, the fifth function swung downwards in line with the progressive character of the deductions. As may be seen, the distributional function of total incomes for 1963 is between these two last scenarios. The sixth function is the arithmetic average of the proportional (4) and progressive (5) scenarios and has been the alternative chosen to allocate deductions for its proximity to the total income function of 1963 (1).
ALLOCATION OF 1964-1981 DEDUCTIONS
Source: Own elaboration from Portuguese tax statistics.

Appendix 2
This appendix analyses the reasons why two series, which were estimated with the same sources and methodology, show different outcomes. There are four main differences between our series and those of Alvaredo: the reference income definition, the method used to add deductions to taxable income, the transparency in the treatment of the sources and the adjustment of TIS levels in order to have long-term consistent series.
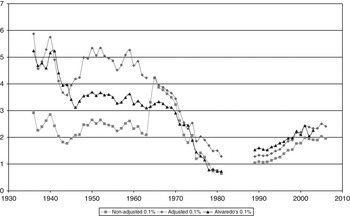
Alvaredo’s reference income is defined as wages and salaries from National Accounts net of effective social security contributions, plus 50 per cent of social transfers, plus 66 per cent of unincorporated business income plus all non-business, non-labor income reported on tax returns. He is able to estimate this figure from 1989 onwards, that is around 60 per cent of total GDP, which is the percentage he applies backwards to calculate the total income reference. The difference between our 80.36 per cent and Alvaredo’s 60 per cent is the reason why his series have persistently higher levels than our non-adjusted ones, as may be seen in Figure A2. Some inconsistencies should, however, be highlighted here. As seen in Figure 2, the ratio PSI/GDP falls intensively between 1989 and 2000 from 76 to 65 per cent of GDP. It is difficult to believe that the income reference estimated by Alvaredo remained constant around 60 per cent. Finally, given the high variability of the PSI/GDP ratio from the mid 1960s onwards, it is not reasonable to assume a constant rate for this period. Taking all these facts into account, our method of defining the total income reference seems more appropriate.
TOP INCOME SHARES: ALVAREDO VS. GUILERA
Sources: Table A1, Guilera (Reference Guilera2008) and Alvaredo (Reference Alvaredo2008).

From 1964 to 1981, to add deductions to taxable income, Alvaredo (Reference Alvaredo2008) adds family deductions proportionally to population and the others proportionally to income. This does not constitute an important difference between the two methods. However, if we compare Alvaredo’s series with our non-adjusted ones, in our series, a sizeable discontinuity appears between 1963 and 1965 (see Figure A2). It could seem that this discontinuity was associated with our inappropriate method of adding deductions to taxable income, but the real cause of this discontinuity is the fiscal reform of the mid 1960s. This major fiscal reform is totally ignored by Alvaredo (Reference Alvaredo2008), and it is the reason behind the discontinuity in our non-adjusted series. What is more surprising is that Alvaredo’s series are fairly stable during the 1960s and this is due to the fact the he does not show all the information available. Tax sources allow yearly income shares above the top 0.5 per cent to be estimated and, with the parentheses of 10 years, also the top 1 per cent. Alvaredo, however, only shows the TIS above 0.1 per cent. In fact, Alvaredo’s table A, column 4 illustrates that he could also have estimated the top 0.5 and 1 per cent income shares. If those income shares had been estimated, the discontinuities would have appearedFootnote 19.
Finally, the levels in our series have been adjusted in 1963, 1980 and 1990 in order to correct the discontinuities of our series (see text). The break of the 1960s does not appear in Alvaredo’s series for the reasons explained above. The discontinuity of the 1980s in Alvaredo’s series is not adjusted, and this leads to unrealistic results when they are compared with the alternative sources available such as HIES. Whereas HIES show a slight decrease in the top 10 per cent income share, Alvaredo’s series show a sizeable increase in TIS during the 1980s.
The differences between the two estimations indicate the improved reliability and long-term consistency of our series compared with those of Alvaredo.
Appendix 3
Top income and wealth shares.
PORTUGUESE TOP INCOME SHARES (%)

Source: See text.
PORTUGUESE TOP WEALTH SHARES (%)

Source: See text.