INTRODUCTION
Studies on the relationships between plant attributes and environmental variables have been recommended in the evaluation of crop genetic resources (Frankel Reference Frankel, Brown, Frankel, Marshall and Williams1989). The adaptation of landraces is achieved through a highly polymorphic plant community, where population fitness is achieved by the different responses of individuals in the population. The presence within such populations of different responses to environmental challenges, their different timing and severity, might explain their yield stability (Ceccarelli et al. Reference Ceccarelli, Grando and van Leur1987). Thus, the value of landraces is mainly attributed to the wide range of genetic resistance against biotic and abiotic stresses, inducing a high degree of adoption in a low-input agricultural system. In addition, they are characterized by both a broad range of genetic variability, contributing to the protection of biodiversity, and a wide phenotypic variability of useful traits for exploitation in breeding. In addition, some of the landraces are in many cases strongly related to the tradition, heredity and specific needs of the local people. These landraces are usually cultivated by older farmers living in marginal regions, and may thus be at a risk of becoming extinct.
Several early studies of inbreeding in Cucurbita (Cummings & Stone Reference Cummings and Stone1921; Cummings & Jenkins Reference Cummings and Jenkins1928) found that the effect of inbreeding Cucurbita maxima was negligible on yield. Erwin & Haber (Reference Erwin and Haber1929) concluded that the inbred lines of Cucurbita pepo, Cucurbita moschata and C. maxima may be developed without any serious impairment of growth and productiveness. Doijode & Sulladmath (Reference Doijode and Sulladmath1983) reported variable effects of inbreeding on the fruit characteristics of different lines of C. moschata, without noticeable inbreeding depression. On the other hand, Sinnott & Durham (Reference Sinnott and Durham1922) reported that many inbred lines of C. pepo had reduced vigour. Borghi et al. (Reference Borghi, Maggiore, Boggini and Bonali1973) supplemented that most of their inbred C. pepo lines were less vigorous than hybrids. Schuster et al. (Reference Schuster, Haghdadi and Michael1974) found that the greatest depression in C. pepo due to inbreeding was for seed yield. Fruit yield, seed protein and oil content were less affected. Chekalina (Reference Chekalina1975) self-pollinated C. pepo and C. maxima and concluded that most inbred plants had reduced fruit set.
More recently, Kohn & Biardi (Reference Kohn and Biardi1995) using progeny array data from four allozyme loci, electrophoretically inferred severe inbreeding depression in two natural populations of Cucurbita foetidissima. Cardoso (Reference Cardoso2004) self-pollinated a C. moschata cultivar for four successive generations and ascertained a linear reduction of mean weight, fruit length and seed production (number and weight of seeds per fruit) with the increase of homozygosity. However, inbreeding did not affect seed weight and germination. Ferrari et al. (Reference Ferrari, Stephenson, Mescher and de Moraes2006) compared the first generation of selfed progeny to outcrossed progeny of the wild gourd C. pepo ssp. texana, in order to assess the variation in blossom volatiles due to the mating system, and observed that self-pollination reduced the total volatile production and changed the relative composition of individual compounds released by blossoms. Jóhannsson et al. (Reference Jóhannsson, Gates and Stephenson1998) observed indications of inbreeding depression in most measures of reproductive output after one generation of selfing in C. pepo ssp. texana. Specifically, outcrossed progeny produced significantly more male flowers and fruits than selfed progeny. Moreover, the pollen produced by outcrossed plants performed faster pollen tube growth in vitro and sired significantly more seeds under conditions of pollen competition than the pollen produced by selfed plants. The same results were obtained by Stephenson et al. (Reference Stephenson, Hayes, Jóhannsson and Winsor2001) examining the effects of four ascending order inbreeding coefficients on sporophytic and gametophytic performance in C. pepo ssp. texana.
In a series of studies conducted with C. pepo ssp. texana with a range of homozygosity levels, Hayes et al. (Reference Hayes, Winsor and Stephenson2004, Reference Hayes, Winsor and Stephenson2005a, Reference Hayes, Winsor and Stephensonb, Reference Hayes, Winsor and Stephensonc) found severe inbreeding depression that varied with environmental conditions (Hayes et al. Reference Hayes, Winsor and Stephenson2005b). Inbred individuals produced significantly fewer fruits than outcrossed individuals, characterized by a significantly lower proportion of seed germination (Hayes et al. Reference Hayes, Winsor and Stephenson2005a). Inbred plants also produced significantly fewer staminate flowers and marginally smaller and fewer pollen grains per flower, which grew significantly slower in vitro than the pollen grains from outcrossed plants (Hayes et al. Reference Hayes, Winsor and Stephenson2005a, Reference Hayes, Winsor and Stephensonc). Moreover, inbred plants suffered a higher rate of damage by cucumber beetles and had a higher incidence of aphid-transmitted viral diseases than outcrossed plants (Hayes et al. Reference Hayes, Winsor and Stephenson2004; Stephenson et al. Reference Stephenson, Leyshon, Travers, Hayes and Winsor2004). In the same fields, however, outcrossed plants had higher rates of infection by the beetle-vectored bacterial pathogen, Erwinia tracheiphila (Ferrari Reference Ferrari2006).
Breeding landraces is a strategy used to improve yield and yield stability in a less favourable agricultural system with lower inputs. Such a breeding strategy, focusing on the use of pumpkin landraces as a source of genetic diversity under low-input conditions, was undertaken with great success in Cuba in the 1990s after a severe energy crisis, as a response to the reduction of artificial irrigation and the cessation of applications of agrochemicals (Ríos Labrada et al. Reference Ríos Labrada, Soleri, Cleveland, Cleveland and Soleri2002). Focusing on the breeding procedure is the most powerful means of achieving higher and more stable yields, where crops are subjected to environmental variability. In order to raise yields, two approaches may be followed: the first is based on increasing the yield potential, while the second lies on better exploitation of the adaptive features of genotypes (Acevedo & Fereres Reference Acevedo, Fereres, Hayward, Bosemark and Romagoza1993).
Despite being a cross-pollinated species, squash seems to maintain crop vigour in agronomic performance such as yield and resistance to biotic or abiotic stress. More recent investigations, however, have demonstrated that inbreeding depression may occur in Cucurbita species. Following the contribution of Acevedo & Fereres (Reference Acevedo, Fereres, Hayward, Bosemark and Romagoza1993), the aim of the present study was to investigate the variance in the agronomical and horticultural performance in a winter squash landrace (C. moschata Duch.), due to the increase of homozygosity. In addition, the evaluation on the basis of yield potential of F=0·50 lines (i.e. S 1 lines), along with four winter squash landraces representing elite germplasm of the Greek Gene Bank C. moschata collection, is discussed.
MATERIALS AND METHODS
Mating procedure
As source material, seeds from a C. moschata winter squash landrace (coded as XKA109/07, registered in the Greek Gene Bank Cucurbita spp. collection), were collected at Galatisa village (40°28′031″N, 23°16′217″E, 360 m asl) of Chalkidiki prefecture, Greece. Seeds were grown in the experimental field at the Agricultural Research Centre of Northern Greece (ARCNG) in the area of Thermi-Thessaloniki (40°32′139″N, 22°59′551″E, 12 m asl) during the summer of 2000. The soil was a sandy loam soil with pH 7·2, organic matter content of 9·5 g/kg, N-NO3 18·2 mg/kg, P-Olsen 60 mg/kg and K 60 mg/kg. Plants were outcrossed in order to produce an initial population of F=0 plants (S 0 population). Then three F=0 progenies were phenotypically selected for different fruit shapes, in order to found three maternal families. In the summer of 2001, self-pollinations and outcrossed matings were performed and the first selfed (F=0·50) and outcrossed progeny (F=0) were produced, respectively. During the summer of 2002, an additional set of self-pollinations and matings to full-siblings was performed, in order to produce F=0·75 and 0·25 progenies, respectively. Thus, the whole procedure succeeded in each family to breed lines with four ascending orders of inbreeding coefficients (F=0, 0·25, 0·50 and 0·75).
Field experimentation
In the summer of 2003, four lines with ascending values of the inbreeding coefficient from each selected family were arranged in randomized blocks with four replicates consisting of five plants each, in the experimental field at ARCNG. Seeding was performed on 8 April 2003 and transplanting on 5 May 2003, using a 2·0×1·5 m spacing. The harvest was carried out on 25 September 2003, when almost all the fruits in the field had turned into the characteristic deep orange skin colour of the landrace and the seed was mature enough.
In 2004, the three F=0·50 lines extracted from the landrace were evaluated along with four elite winter squash landraces (coded as GR018/99, GR151/99, GR231/99 and GR293/99), resistant to Fusarium oxysporum (Tsivelikas et al. Reference Tsivelikas, Koutita, Anastasiadou, Skaracis, Traka-Mavrona and Koutsika-Sotiriou2009), derived from the Greek Gene Bank. According to previous experimentation, the three F=0·50 lines also proved to be resistant against two isolates of F. oxysporum (F. oxysporum f.sp. melonis and F. oxysporum f.sp. radicis-cucumerinum) in trials in planta (Koutsika-Sotiriou et al. Reference Koutsika-Sotiriou, Traka-Mavrona, Tsivelikas, Mpardas, Mpeis, Klonari, Lebeda and Paris2004). An R-7 honeycomb trial was established using 12 plants per entry (Fasoulas & Fasoula Reference Fasoulas and Fasoula1995). Honeycomb designs ensure effective soil-heterogeneity control to compare different entries by allocating each entry systematically and uniformly according to a hexagonal arrangement on the entire field. Hence, plants of the same entry are placed in the corners of equilateral triangles, while plants of each entry are always surrounded by plants of all other entries. Seeding was carried out on 15 April 2004 and transplanting on 17 May 2004, with plants spaced 2·30 m apart (0·2 plants/m2) according to honeycomb methodology, which encompasses evaluation and selection at the level of the individual plant grown at a critical distance in the absence of competition (Fasoula & Fasoula Reference Fasoula and Fasoula1997). The harvest was carried out on 25 September 2004, when almost all the fruits in the field had turned into the characteristic deep orange skin colour and the seed was mature enough.
Estimation of water stress tolerance
In addition to field trials, a separate experiment was conducted in order to test the effects of inbreeding on water stress tolerance. For this purpose, a three-factor experiment, arranged according to a split-plot design with two replications, was used. Seeds from the four lines of each of the three families were sown on 16 June 2003 and seedlings were transplanted on 1 July 2003 in plastic pots of 10-litre capacity containing a mixture of 5:2:3 (by volume) peat moss, perlite and sterilized sand, respectively. The pots of each family were randomly placed under a glasshouse and a drip-irrigation system was used, supplying water at a constant rate of 4 litres/h to each pot. The irrigation was adjusted in order to supply water for 30 min every day (i.e. 2 litres/pot). On 1 August 2003, the irrigation was ceased randomly for half the plants of each family, while remaining steady for the other half, rendering irrigation-family treatment combination as the main plot treatment. Lines with ascending values of the inbreeding coefficient were randomized within each irrigation-family main plot. In total, six plants for each different treatment combination were used. After 15 days with no irrigation and regular irrigation, respectively, the second leaf from the top of each plant was removed and leaf discs of 5 mm in diameter were incised.
For the evaluation of water stress tolerance, the method of ion leakage was used (Sheppard et al. Reference Sheppard, Franssen and Cape1995). Specifically, for the estimation of stability of cell membranes through the method of ion leakage, four leaf discs of each plant were separately bulked for each treatment combination (a total of 4×6=24 discs). The discs were rinsed, blotted and immersed into test tubes containing 10 ml deionized water and gently vortexed for 15–20 s. The tubes were then covered and placed at room temperature for 24 h. Then, the electrical conductivity of each solution was measured with a conductivity meter. In order to determine the total potential amount of ion leakage, the cell membranes were totally destroyed by autoclaving the solutions. The tubes were then placed at room temperature again for 24 h and the electrical conductivity of each solution was measured. The initial conductivity values were expressed relative to the final values measured after the membranes' destruction. Relative leakage of electrolytes from leaf discs was used as a parameter of membrane damage due to water stress. Lines characterized by low relative values of ion leakage were regarded as more drought tolerant.
Evaluation procedure
A number of agronomical and horticultural characteristics were determined. Total and commercial yield, total and commercial fruit number and the mean weight of commercial fruit were determined. In addition, the days from seeding till the opening of the first female blossom, the size of pollen grains and the seed weight were measured as traits related to vegetative growth. To measure pollen grains, a single male flower was collected from each plant in the field and pollen was sprinkled onto Petri dishes and separately bulked for each treatment. After dehydration (45°C for 2 weeks), the Petri dishes were placed in a refrigerator at 4°C. Over the next 2 weeks, pollen from each separate treatment was treated according to Louveaux et al. (Reference Louveaux, Maurizio and Vorwohl1970). The perimeter and area of 30 pollen grains per treatment were measured under a microscope using an image analysis system and Olympus DP – Soft 3 software. Fruit dimensions (obtaining the ratios equatorial/polar length for fruit and seed cavity), the thickness of mesocarp, the dry matter (g/kg fresh weight), total soluble solids (using the Brix method as described by Southgate (Reference Southgate1976)) and the pH of fruits were determined. The data for total and commercial fruit number as well as for days needed to female blossom were transformed using the square root transformation, in order to meet statistical assumptions.
Data analysis
Data from the field assessments were analysed using a general linear model with family and inbreeding coefficients as fixed effects and blocks as random effects. For the experiment on drought tolerance, the effects of irrigation treatment were considered as fixed effects. A polynomial with equal-spaced x-values was fitted through the four equally ascending values of the inbreeding coefficient (F=0, 0·25, 0·50 and 0·75) in order to examine the different trends of each family with inbreeding. Thus, the linear, quadratic and cubic components of each family with the ascending values of the inbreeding coefficient were calculated and the significance of each model coefficient was estimated. In order to assess the mean inbreeding depression, individual replicate values for each line separately were standardized by the respective mean value at F=0. For this reason, the ratio w ijs/w i.. was calculated, where w ijs is the value of the jth replicate of the ith family at the corresponding inbreeding coefficient (F=0·25, 0·50 and 0·75) and w i.. is the mean value of the ith family at F=0. In order to stabilize variances, the ratio was logarithmically transformed and an appropriate analysis of variance was applied for each individual characteristic.
For the honeycomb trial, the total yield of each individual plant within each entry was determined, followed by mean separation among entries using t-test for independent samples after the analysis of variance. In addition, a methodology for accurate whole-genome phenotypic evaluation using the analysis of crop yield potential was applied (Fasoula & Fasoula Reference Fasoula and Fasoula2002, Reference Fasoula, Fasoula and Kang2003). Based on the total yield of each individual plant within each entry, the analysis of crop yield potential for each of the entries was carried out according to the partitioning into three genetic components (Fasoula & Fasoula Reference Fasoula and Fasoula2000, Reference Fasoula and Fasoula2002). The first component of crop yield comprises genes ensuring high yield potential per plant. These genes are assessed by the genotype's progeny mean ( ). The second component comprises genes controlling tolerance to the biotic and abiotic stresses. These genes are assessed by the genotype's progeny standardized mean (
 ). The third component comprises genes controlling responsiveness to inputs. These genes are assessed by the genotypes standardized selection differential
 , where
 is the mean yield of the selected plants within the genotype, and exploit favourable growing conditions. In that case, corresponded to 0·25 selection pressure and was the mean yield of the three highest-yielding plants per entry.
RESULTS
Inbreeding effects on traits associated with yield potential
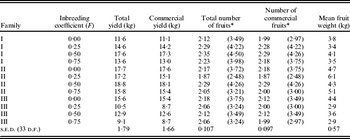
The mixed model analysis of variance revealed significant differences for all the traits that contribute to yield potential of the plants (Table 1). In particular, marked main effects were revealed for both the fixed factors, family and inbreeding coefficient. Family II was significantly different from families I and III, exhibiting higher total and commercial yield, as well as higher fruit mean weight (Table 1). There were significant differences between the levels of inbreeding coefficients for all the traits associated with yield potential except for fruit mean weight. In most cases, the mean performance of the F=0·50 lines was significantly better than the F=0·25 and 0·75 lines (Table 1). On the contrary, in Family III, one generation selfed progeny generally produced a lower total commercial yield than the respective original populations (Table 1). Lines at F=0·75 performed worst for almost all the traits associated with yield potential, except in the case of Family I in which the F=0 line ranked last among all the progeny lines of the family (Table 1).
Treatment means of traits associated with the yield of C. moschata squash

* Means for total and commercial fruits have been transformed to square root. Back transformed values are presented in the brackets.
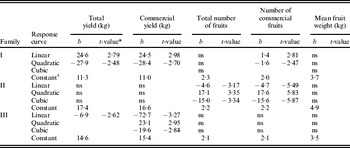
Significant family×inbreeding interactions were also obtained (Table 2). Trends within each family indicated an increase in all yield components at F=0·50, where two of the families (I and II) exhibited their highest values (Table 1).
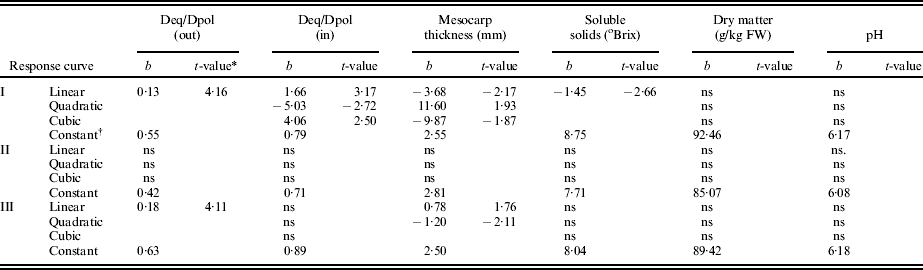
Actual model coefficients for traits associated with the yield of C. moschata squash and the significance of components of the response curves of each family to ascending levels of inbreeding

* t-values above 2·15 are significant at P<0·05 and those above 2·98 are significant at P<0·01.
† Constant terms for the cases of non-significant (ns) responses represent the means of the respective family.
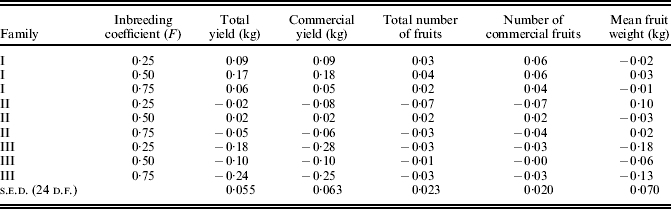
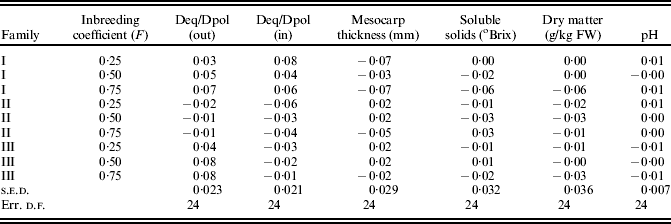
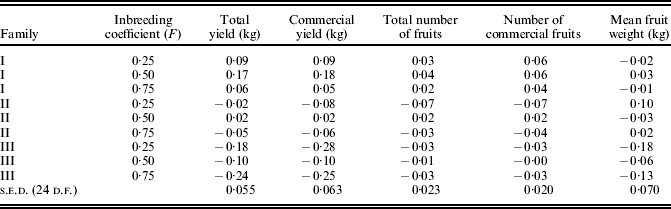
All the traits associated with yield potential showed low levels of inbreeding depression (Table 3). However, inbred lines of Family III were those that revealed a relative high amount of inbreeding depression. In contrast, all inbred lines of Family I as well as the F=0·50 line of Family II exhibited inbred vigour (log(w ijs/w i..)>0), outperforming the values of all the other lines significantly in most cases (Table 3).
Log inbreeding depression values for traits associated with the yield of C. moschata squash
Inbreeding effects on traits associated with vegetative growth
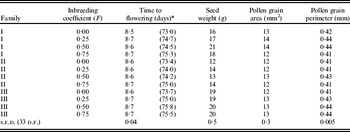
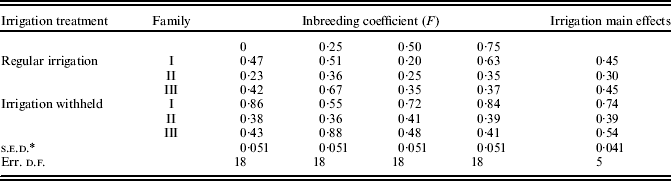
The analysis of variance of vegetative traits revealed marked main effects. Significant differences were observed between families, with Family II exhibiting significantly lower seed weight and smaller pollen grains in comparison with the other two families (Table 4). Family II also showed the best response to drought tolerance, characterized by significantly lower relative values of ion leakage than the other two families, irrespective of the inbreeding coefficient (Table 5).
Treatment means of traits associated with the vegetative growth of C. moschata squash

* Means for time to flowering have been transformed to square root. Back transformed values are presented in brackets.
Relative electrolyte leakage of different C. moschata squash families under different watering regimes
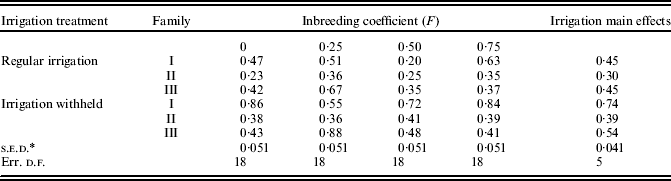
* The s.e.d. was computed using the appropriate error terms from the ANOVA table according to the experimental design described in the text.
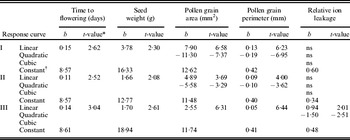
There was a positive linear regression in every family between the time to flowering and the inbreeding coefficient (Table 6). Outcrossed progeny (F=0) was significantly earlier than inbred progeny for the opening of the first female blossom, even after a slight increase of the inbreeding coefficient corresponding to the first generation of full-sib mating (F=0·25). Unlike days to flowering, in most cases outcrossed progeny exhibited a significantly lower seed weight and smaller pollen grains than selfed progeny. On an average, seeds derived from lines with F=0 weighed significantly less than seeds derived from F=0·75 lines, while the pollen grain size was significantly smaller in comparison with the second generation of selfed progenies (Table 4). A positive linear regression was found for Family III between the inbreeding coefficient and seed weight as well as the pollen grain size (Tables 4 and 6). For the other two families, in most cases the quadratic component was predominant, with an increase up to F=0·50 and a subsequent decline for F=0·75 progeny (Table 6).
Actual model coefficients for traits associated with the vegetative growth of C. moschata squash and the significance of components of the response curves of each Family to the ascending levels of inbreeding

* t-values above 2·15 are significant at P<0·05 and those above 2·98 are significant at P<0·01.
† Constant terms for the cases of non-significant (ns) responses represent the means of the respective family.
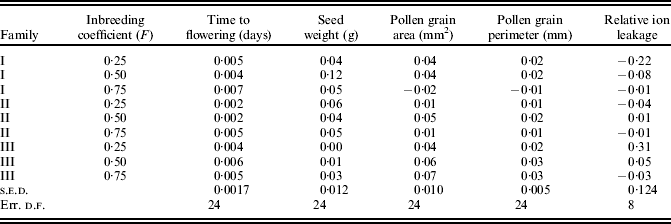
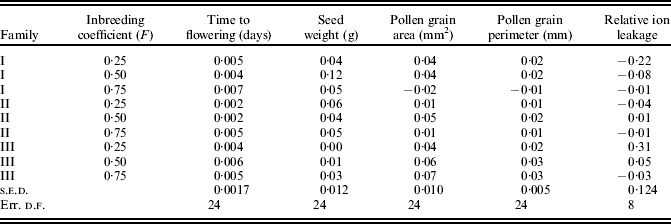
The magnitude of inbreeding depression for the traits associated with vegetative growth was negligible in most cases (Table 7). However, time to flowering was the exception; all the inbred lines of all of the three families took longer from seeding till the opening of the first female blossom than their respective F=0 lines (Table 7). For all the other vegetative traits, the relative performance of all the inbred progenies was at least the same or even better than that of the respective F=0 lines (Table 7).
Log inbreeding depression values for traits associated with the vegetative growth of C. moschata squash
Inbreeding effects on traits associated with horticultural characteristics
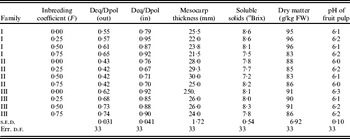
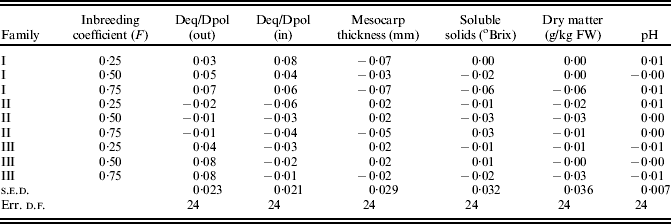
For horticultural characteristics, the differences were constrained only to the morphological traits of the fruits. In particular, significant main effects were obtained for the ratios equatorial/polar length of fruit and seed cavity (Deq/Dpol (out) and Deq/Dpol (in), respectively) and for mesocarp thickness. Fruit quality traits, i.e. total soluble solids, dry matter and pH, exhibited no difference among families or among the different orders of inbreeding coefficients (Table 8).
Treatment means of the horticultural traits of C. moschata squash

Deq/Dpol: equatorial/polar length of fruit and seed cavity.
FW: fresh weight.
Family II showed more variability for the morphological traits than the other two families, with lower equatorial/polar ratios for fruit and seed cavity as well as higher values for mesocarp thickness (Table 8). A linear regression was observed between Deq/Dpol of the fruit and the increase of inbreeding coefficients in Families I and III (Table 9), implying a reduction of fruit length with the increase of homozygosity.
Actual model coefficients for the horticultural traits of C. moschata squash and the significance of components of the response curves of each family to the ascending levels of inbreeding
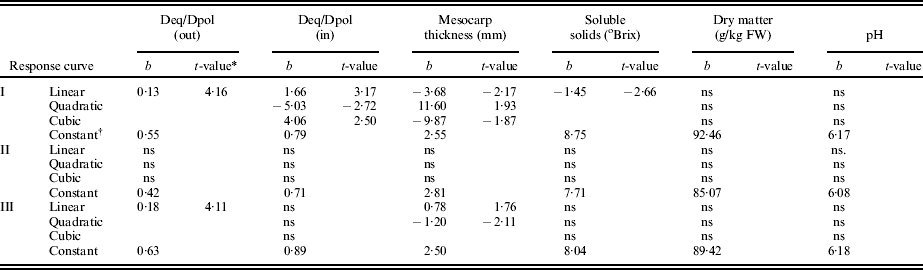
Deq/Dpol: equatorial/polar length of fruit and seed cavity.
* t-values above 2·15 are significant at P<0·05 and those above 2·98 are significant at P<0·01.
† Constant terms for the cases of non-significant (ns) responses represent the means of the respective family.
FW: fresh weight.
The magnitude of inbreeding depression for horticultural characteristics was relatively low. The higher values corresponded to the morphological traits of the fruit, mainly due to the reduced fruit length with inbreeding coefficient, while for fruit quality traits inbreeding depression was considered negligible (Table 10).
Log inbreeding depression values for the horticultural traits of C. moschata squash
Deq/Dpol: equatorial/polar length of fruit and seed cavity.
FW: fresh weight.
Genetic analysis of crop yield potential
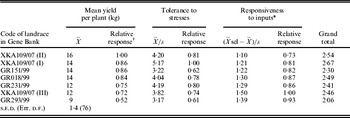
The ranking of the three F=0·50 lines extracted from the landrace and the four selected landraces of winter squash after evaluation in the R-7 honeycomb trial is given in Table 11. The F=0·50 line, corresponding to Family II, exhibited a higher mean yield per plant and out-yielded two of the four tested landraces significantly. The same line was also the most productive of the 12 lines that were tested in the previous year's field experiment (see Table 1). In addition, the partitioning of crop yield potential to the three components, summed for two of the three F=0·50 lines, the higher totals for relative values than any other entry tested (Table 11).
Evaluation of seven C. moschata squash entries (three F=0·50 lines and four landraces) and the importance of three components

* corresponds to a selection pressure of 0·25 and is the mean yield of the three highest-yielding plants per entry.
† The response expressed as a proportion of the highest response.
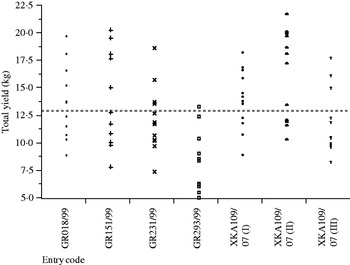
A graphical representation concerning the mean yield and stability parameter of each genotype over the cropped area is provided by the scatter plot of the actual individual yields per plant against the seven genotypes (Fig. 1). Bartlett's homogeneity test of vari-ance showed that there were no significant differences between the variances of the seven genotypes (T=4·36, P>0·05 (d.f.=6)). A deliberately excluded outlier plant of the GR018/99 entry appeared as an extreme value that was more than twice the mean yield of the entry and nearly twice the yield of the next highest yielding plant, and thus, having a profound effect on the estimated variance for this entry.
Scatter plot showing individual yield per plant against the seven genotype levels in the honeycomb field trial. The horizontal dotted line is the overall mean for the whole experiment.

DISCUSSION
The extent of genetic diversity available within landraces is useful for breeding purposes in different ways. These include: the release of the highest yielding lines as varieties, the utilization of superior lines as parents in crossing programmes, the evaluation of multi-lines for a better understanding of the relationship between genetic heterogeneity and stability and finally through the evaluation of lines exhibiting specific stress responses (Ceccarelli et al. Reference Ceccarelli, Grando and van Leur1987). The aim of the present study was to reveal superior lines from a landrace through inbreeding. For this reason, a number of breeding lines corresponding to four ascending orders of the inbreeding coefficient (F=0, 0·25, 0·50 and 0·75) were developed.
Significant differences between the levels of inbreeding coefficients were obtained for most of the yield components. First generation selfed progeny (i.e. S 1 lines) performed best in terms of total and commercial yield, as well as for total and commercial fruit number. In addition, two of the three F=0·50 lines proved to be particularly high-yielding when evaluated in the comparative R-7 honeycomb trial along with four elite winter squash landraces selected from the C. moschata collection in the Greek Gene Bank. First generation selfed progeny from Family II were found to out-yield all the other progeny tested (two lines and four landraces). In contrast, lines after the second generation of selfing (F=0·75, i.e. S 2 lines) exhibited the lowest values for all traits associated with yield potential. According to Bernardo (Reference Bernardo2002), the selection among S 1 families is always more efficient than the selection among sub-families within an S 1 family. Data from maize breeding programmes have revealed that among seven recurrent selection methods, the S 1-progeny method presented the highest estimated heritability percentage, proving its effectiveness for that kind of material (Lamkey & Hallauer Reference Lamkey and Hallauer1987).
A similar pattern for fruit set and other quantitative traits in squash was obtained by Chekalina (Reference Chekalina1975), who reported that one generation of inbreeding did not reduce fruit set or impair other traits, while inbreeding depression was noted in second and third generations of selfing. In contrast, Stephenson et al. (Reference Stephenson, Hayes, Jóhannsson and Winsor2001), working with a range of inbreeding coefficients comparable to the present study, reported a generally significant negative linear regression for most measures of reproductive output even with a slight increase of homozygosity. A significant linear decrease with the inbreeding coefficient was also obtained by Cardoso (Reference Cardoso2004) for fruit mean weight. Assessing the mean performance of different orders of inbreeding for the three families in the present study, no such linear regression was revealed for any of the yield components. However, an individual significant linear trend was estimated for Family III, assessing the total yield with an increased inbreeding coefficient.
Among the vegetative vigour traits, the time to female blossom was the one for which inbreeding depression effects were revealed clearly. In particular, within each independent family the number of days before the opening of the first female flower increased linearly with the inbreeding coefficient. A similar positive linear regression between the days taken to first female flower emergence and the inbreeding coefficient was obtained by Hayes et al. (Reference Hayes, Winsor and Stephenson2004, Reference Hayes, Winsor and Stephenson2005a).
Outcrossed progeny exhibited significantly lower values for seed weight, pollen grain area and pollen grain perimeter than selfed progeny. First generation selfed progeny performed best, with values differing significantly from all the other outcrossed and inbred progeny. In comparable studies of inbreeding depression, Cardoso (Reference Cardoso2004) observed a significant linear decrease among seed yield per fruit and inbreeding coefficient, while Schuster et al. (Reference Schuster, Haghdadi and Michael1974) found the greatest inbreeding depression for the same trait. Seeds produced from open pollination are likely to be sired by pollen from unrelated plants and should therefore have an inbreeding coefficient F=0. When F=0, the seeds produced by inbred mother plants in the present study weighed significantly more than seeds produced by S 0 mother plants. This suggests that S 0 mothers were less vigorous and reveals maternal effects associated with inbreeding vigour. Similar maternal effects were seen for the size of pollen grains. Although pollen translates and transcribes a large proportion of its genome during development, germination and pollen tube growth (Tanksley et al. Reference Tanksley, Zamir and Rick1981; Willing & Mascarenhas Reference Willing and Mascarenhas1984), it is not directly subject to inbreeding because of its haploid genome. Consequently, if inbred plants perform better than outcrossed plants with respect to pollen grain size, then the quantity or quality of resources available to their pollen during development must be better, suggesting maternal effects associated with inbreeding vigour. However, maternal effects in Cucurbita species are mainly associated with inbreeding depression rather than vigour. In a series of studies, Hayes et al. (Reference Hayes, Winsor and Stephenson2004, Reference Hayes, Winsor and Stephenson2005a, Reference Hayes, Winsor and Stephensonb, Reference Hayes, Winsor and Stephensonc) and Stephenson et al. (Reference Stephenson, Hayes, Jóhannsson and Winsor2001) revealed significant inbreeding depression through maternal effects for seed number and mass as well as for pollen grain diameter and in vitro pollen growth rate.
In the present study, no differences were revealed between the levels of the inbreeding coefficient for water stress tolerance. However, significant differences were obtained among each family. The progeny of Family II had the most desirable response to water stress tolerance, with significantly lower relative values of ion leakage than any of the progeny of the other two families, independent of the inbreeding coefficient.
For horticultural characteristics, significant differences among the various orders of inbreeding coefficients were obtained for the ratio equatorial/polar length of fruit. The significance of this ratio is mainly attributed to the decrease of fruit neck length with the increase of inbreeding coefficient. Fruit quality traits, i.e. total soluble solids, dry matter and pH, were not different between inbreeding coefficients.
The significant interactions between families and the inbreeding coefficient suggest that the strength of inbreeding depression may vary between families (Dudash et al. Reference Dudash, Carr and Fenster1997; Vogler et al. Reference Vogler, Filmore and Stephenson1999; Hayes et al. Reference Hayes, Winsor and Stephenson2005a, Reference Hayes, Winsor and Stephensonc). In the present study, inbreeding depression varied between families developed from an individual landrace, reflecting the wide genetic composition of each landrace (Harlan Reference Harlan1975). The increased yield stability of landraces is also attributed to their inherent heterogeneity (Simmonds Reference Simmonds1979); whatever biotic and abiotic stresses are experienced by each plant, one or more genotypes within the landrace population yield satisfactorily (Zeven Reference Zeven1998).
The magnitude of inbreeding depression was relatively low and in some cases even negligible. The highest values were found for almost all the inbred progeny with respect to the increase of the equatorial/polar length ratio of fruit. Relatively high values of inbreeding depression were also obtained for some full-sib and S 2 lines in response to the total and commercial yield. However, the latter traits did not show any inbreeding depression values for the first generation selfed progeny (S 1 lines), meaning that lines with an inbreeding coefficient of F=0·50 produced, on an average, higher total and commercial yield than S 0 lines (F=0). In addition, positive log inbreeding depression values were obtained for all the traits associated with maternal effects (seed weight and pollen grain size), implying an inbred vigour associated with this kind of effect. In comparable studies, Hayes et al. (Reference Hayes, Winsor and Stephenson2005a, Reference Hayes, Winsor and Stephensonb) found moderate inbreeding depression, though notably higher than that of the present study.
The most recent studies revealing significant amounts of inbreeding depression in Cucurbita referred to natural wild gourd open-pollinated populations (Kohn & Biardi Reference Kohn and Biardi1995; Jóhannsson et al. Reference Jóhannsson, Gates and Stephenson1998; Stephenson et al. Reference Stephenson, Hayes, Jóhannsson and Winsor2001; Hayes et al. Reference Hayes, Winsor and Stephenson2004, Reference Hayes, Winsor and Stephenson2005a, Reference Hayes, Winsor and Stephensonb, Reference Hayes, Winsor and Stephensonc; Ferrari et al. Reference Ferrari, Stephenson, Mescher and de Moraes2006), which are subject only to the forces of natural selection. However, the observed amounts of inbreeding depression for the C. moschata landrace in the present study were low, non-significant and in some traits implied inbred vigour.
During the evaluation of the honeycomb trial, the genetic analysis of three components of yield potential for the three lines with F=0·50 and the four winter squash landraces (Fasoula & Fasoula Reference Fasoula and Fasoula2000, Reference Fasoula and Fasoula2002) revealed a high and stable crop yield potential for the specific field of experimentation. Specifically, the superior mean yield per plant of two of the three lines with F=0·50 leads to improved crop yields by extending the lower limit of optimal plant density (Tokatlidis et al. Reference Tokatlidis, Koutsika-Sotiriou and Fasoulas2001; Tokatlidis & Koutroubas Reference Tokatlidis and Koutroubas2004). Tolerance to stresses can be quantified according to Fasoula & Fasoula (Reference Fasoula and Fasoula1997) by the coefficient of variation of single-plant yields ( ). The coefficient of variation of single-plant yields has also been proposed as a criterion for the evaluation of cultivars on the stability of performance (Fasoula & Fasoula Reference Fasoula and Fasoula1997; Janick Reference Janick, Coors and Pandey1999; Tollenaar & Wu Reference Tollenaar and Wu1999; Tokatlidis & Koutroubas Reference Tokatlidis and Koutroubas2004). Tolerance to stress can also be quantified using a directly proportional criterion, the reciprocal of CV, i.e. the standardized mean (). In that case, the larger the standardized entry mean in the isolation environment, the higher the stability of performance in the crop environment (Fasoula & Fasoula Reference Fasoula and Fasoula2000). In addition, plants growing in stress-free field locations respond positively to these conditions if they carry genes that control responsiveness to inputs and are thus able to exploit the improved growing conditions more effectively than entries without such genes. According to Fasoula & Fasoula (Reference Fasoula and Fasoula2000), this ability is reflected in the genotype's selection differential, which becomes a more reliable measure if converted into standardized units. Thus, the performance of lines with F=0·50 could be an indication of variable equilibrium with both environmental and genetic dynamics, though such an analysis cannot replace multi-site stability testing. Indisputably, further testing is needed, involving exposing the entries to different stresses across the target area of adoption by evaluation in different locations and years. However, the present results emphasize on two points: (i) the tolerance to inbreeding that is mainly due to additive effects is an indication of elite germplasm (Hallauer Reference Hallauer and Walden1978) and (ii) the existence of more genotypes with desirable alleles within the landrace population (Zeven Reference Zeven1998; Camacho Villa et al. Reference Camacho Villa, Maxted, Scholten and Ford-Lloyd2005).
Taking into account the extent of the genetic diversity available within this specific winter squash landrace which exhibits a rich dynamic population with negligible or even negative amounts of inbreeding depression, it is suggested that a long-term breeding goal would include the incorporation of those desirable genes found in different landrace genotypes into one or few superior plant families with elevated yield and stability levels.