I. INTRODUCTION
The concentration of Ga, in addition to the thermal history of Fe–Ga alloys, has a great influence on the ordering of the material structure. The alloy with the best magnetostrictive property is that with Ga atomic concentration of 18.6%.Reference Atulasimha and Flatau1 In turn, the ordering of cubic structures in Fe–Ga alloys has also a crucial influence on the magnetostrictive behavior.Reference Khmelevska, Khmelevskyi and Mohn2
The is discussed the effect of magnetic disorder on the crystal lattice ordering for Fe–Ga alloys up to 25% of Ga, based on electronic structure calculations from first-principles, is discussed in Ref. Reference Khmelevska, Khmelevskyi and Mohn2. It was found that a heat treatment at temperatures above the Curie temperature, that is, from a disordered magnetic state, has energy of formation of D03 ordered structure lower than if starting from an ordered magnetic state. In another study,Reference Rahman, Gou, Liu, Ma and Yan3 Fe81Ga19 samples were submitted to two procedures: first, ice-water cooling from 1000 °C and second, slow cooling at 1.3 °C/min down to 500 °C and followed by quenching into ice-water. By transmission electron microscopy, it was found that the first procedure leads to the precipitation of the phase Fe3Ga with ordered D03 structure from the α-phase, in accordance with the metastable phase diagram.Reference Ikeda, Kainuma, Ohnuma, Fukamichi and Ishida4 However, after the second procedure, only the α-phase with disordered bcc structure A2 showed up. In the second case, the kinetics follows the equilibrium phase diagram.Reference Ikeda, Kainuma, Ohnuma, Fukamichi and Ishida4 The quenching from 500 °C was efficient to suppress the precipitation of the Fe3Ga with the L12 structure. The presence of both phases with D03 and L12 structures are unfavorable to magnetostriction.
Previously, we studied the effect of B addition on the Fe72Ga28 alloy and the magnetostriction is controlled by thermal history and change in matrix composition due to the addition of B. The addition of B causes the formation of the Fe2B phase that takes Fe from the alloy and enriches the Fe–Ga matrix with Ga. In fact, in this rich Ga alloy, it was found an increase in the matrix lattice parameter associated with an improvement of the magnetostriction, suggesting that B entered interstitially on the Fe–Ga matrix phase.Reference Bormio-Nunes, Santos, Leandro, Turtelli, Grössinger and Atif5 However, for Fe–Ga alloys with compositions close to 19 at.% of Ga, the addition of B did not cause a significant increase of the magnetostriction, suggesting that B do not enter the matrix, the same that happens to the Fe–Al–B alloy with 20 at.% of Al.Reference Bormio-Nunes, Dias and Ghivelder6 On the other hand, the introduction of B has a positive effect on the ductility of the alloysReference Li, Gao, Zhu, Li and Zhang7,Reference Gao, Li, Zhu, Li and Zhang8 because binary Fe–Ga alloys are not ductile enough at room temperature and fracture during the rolling process.Reference Cheng, Nolting, Voyzelle and Galvani9
To evaluate only the effect of the Fe2B phase on the microstructure and magnetostrictive properties of the Fe–Ga alloy with 18.6 at.% Ga, the ternary alloy was designed so that the matrix has the same composition as the binary alloy. In addition to the magnetostriction, the piezomagnetic (PZM) behavior that is particularly important for applications of force sensors and actuators is also evaluated. For this kind of application, a material with a good ductility property is also desirable and ternary Fe–Ga–B can be a good candidate. The PZM behavior is assessed by the measurement of the PZM coefficients d 33 = dλlong/dH|σ and d 33* = dB/dσ|H, where λlong is the longitudinal magnetostriction, H is the applied magnetic field, B is the magnetic induction, and σ is the applied compression stress parallel to the field H.Reference Jiles and Lo10
II. EXPERIMENTAL PROCEDURES
Fe–Ga and Fe–Ga–B alloys were produced with composition in which the binary alloys have the highest magnetostriction, Fe81.4Ga18.6 and (Fe81.4Ga18.6)0.98B2 (in at.%).Reference Atulasimha and Flatau1 For this, an excess of Fe was added before Fe–Ga–B alloy melting so that all Fe in excess should combine with B to form the Fe2B phase. This assumption considers that B does not enter in the Fe–Ga lattice. The melting was made in an arc furnace with argon-controlled atmosphere. The ingot was remelted four times to ensure homogenization. All elements used for the ingots production had a minimum purity of 99.8% and each ingot produced had a mass of approximately 45 g.
After melting, each alloy was encapsulated in a quartz tube with controlled atmosphere of argon, received a homogenizing heat treatment for 48 h at 1200 °C and then was rapid cooled in water. It is worth to point out that although a rapid cooling was applied to the sample, because the sample is massive, the cooling was not as rapid as occurs for small samples (e.g., 6 g).
After the homogenization heat treatment, each ingot was machined to generate cylindrical samples approximately 50 mm long by 6 mm in diameter. It is important to inform that the alloy Fe–Ga–B was easy to machine, while Fe–Ga needs to be machined in very slow speeds, otherwise it fractures. For the measurements under mechanical compression, screw threads were machined at the ends of the specimens (cylindrical bars) to attach caps that provide better allocation of the sensing device in the compression testing machine. Moreover, grooves were made in the specimens for the fixation of the strain gages used for magnetostriction measurements.
The sensing device used to characterize the magnetic properties of the magnetostrictive material is formed by two electric steel U cores and two coils, which generate the magnetic field H that flows through the cores and the sample. See Ref. Reference Dias, Bormio-Nunes, Pacheco, Machado and Hubert11 for more details on this experimental apparatus.
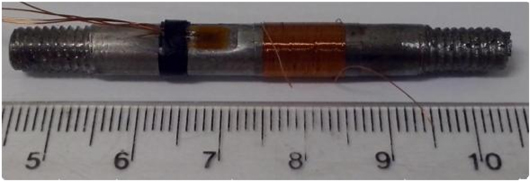
The magnetostriction was measured using 350 Ω strain gages with gage factor ∼2 and a Wheatstone bridge NI 9237 from National Instruments (Austin, Texas). The sample was instrumented with a pickup coil and the strain gage was glued close to the pickup coil as can be seen in Fig. 1. The magnetostriction was measured parallel to the applied field along the cylinder axis (λlong). A fluxmeter model 480 from Lake Shore Cryotonics (Westerville, Ohio) connected to the pickup coils measures the magnetic induction B generated by the sample due to changes in magnetic field and external stresses.
Instrumented cylindrical sample with pickup coil and strain gauge.

The compressive force σ on the magnetostrictive materials, Fe–Ga and Fe–Ga–B, was applied by using a model DL 3000 electromechanical test machine from EMIC (São José dos Pinhais, Brazil).
The tests with the application of stress consist of performing the measurement of magnetostriction and magnetic induction as a function of the variation of the magnetic field, respectively, λ versus H and B versus H, under constant (static) or variable (quasi static) mechanical stress. The measurements of magnetization and magnetostriction were performed for values of compression stresses of fixed values of 0, 17.1, 28.3, 38.8, 49.5, 60.1, and 70.7 MPa.
The analysis of the microstructures was made by X-ray diffraction using a XRD-6000 model from SHIMADZU (Kyoto, Japan) diffractometer using molybdenum radiation, 40.0 kV, 30 mA, 2θ angles in the range of 10°–70°, and step of 0.05°. For scanning electron microscopy (SEM), a HITACHI 3000 (Schaumberg, Illinois) microscope was used in the backscattering mode. Chemical composition analysis was performed using electron diffraction scattering (EDS) by using the detector INCA x-sight model from Oxford Instruments (High Wycombe, United Kingdom) coupled to the microscope.
III. RESULTS AND DISCUSSION
A. Microstructure
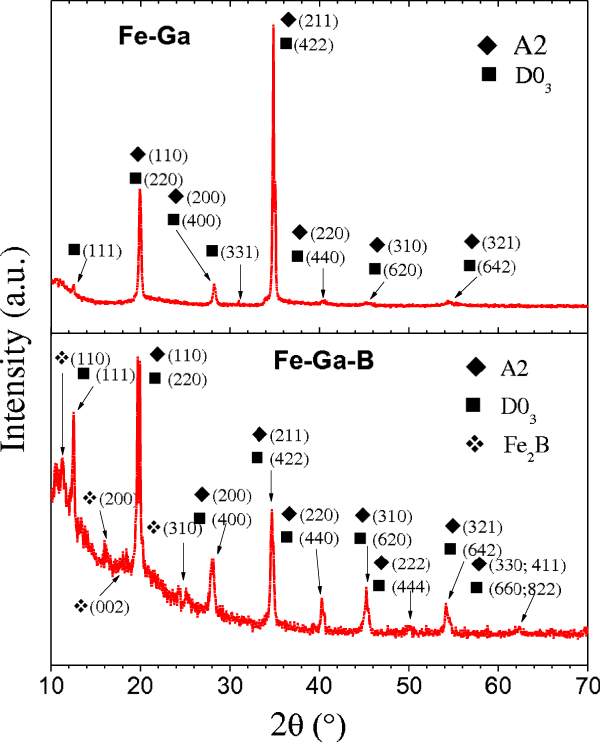
There is an intrinsic difficulty on distinguishing between phases with structures A2 and D03, using X-ray diffraction, since the most intense reflection peaks of these structures are coincident. Although, ordered structure superlattices have several extra peaks, the intensities of these are usually very small. This occurs because this intensity is proportional to the difference between the atoms’ scattering factors, particularly for XRD with Cu K-α radiation.Reference Loureiro, Batista, Khomchenko, Costa and Le Caër12 For the phases Fe(Ga)-α (A2) and Fe3Ga (D03), this problem occurs, but using Mo K-α radiation, it was possible to detect the presence of the D03 structure as depicted in Fig. 2.
X-ray diffraction patterns of the Fe–Ga and Fe–Ga–B alloys.
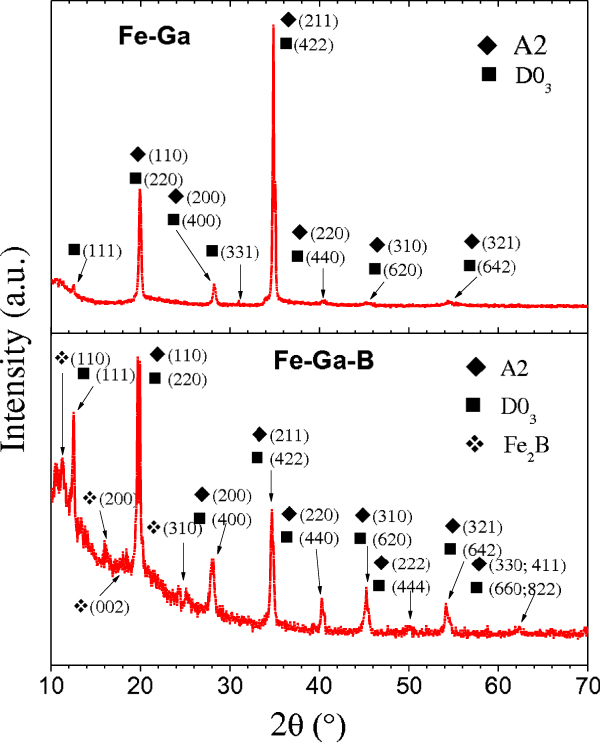
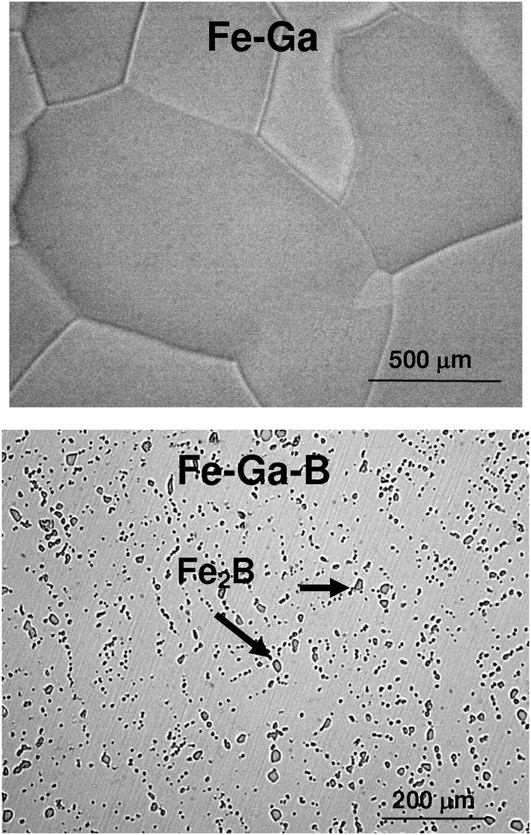
The reflection corresponding to the plane (111) of the D03 structure and occurring at 2θ ∼ 12.5° is definitely present for both alloys and only attributed to the phase Fe3Ga. In addition, the highest relative intensity of this peak for the Fe–Ga–B alloy suggests a higher volume fraction of the ordered Fe3Ga (D03) phase in this alloy. In the alloy with B, the presence of Fe2B phase was also detected and identified by 4 extra peaks on the XRD pattern compared to the sample without B. Using SEM micrographs of the Fe–Ga–B alloy as the one presented in Fig. 3, together with the image analysis freeware program Image J,13 it was possible to estimate a volume fraction of the Fe2B phase of 12.5%. This result was used as a guide for a qualitative estimation, made by simulation using PowderCell®Reference Kraus and Nolze14 and the DRX patterns, of the volume fractions of structures A2 and D03 and the Fe2B phase in the Fe–Ga–B alloy. The results of phase volume fraction on the Fe–Ga–B alloy are 11.5% of Fe2B and 88.5% of D03, which means that the A2 structure (α-phase) is not present. Using the same type of simulation for the Fe–Ga alloy, the volume fractions found were 52.9% of A2 and 47.1% of D03. These results of simulations are qualitative, but show a tendency. For example, the absence of A2 in the sample with B could not be absolutely true, but the simulation suggests that the volume of Fe3Ga (D03) in the Fe–Ga–B alloy is probably much higher than in the binary alloy Fe–Ga. For a quantitative result, neutron diffraction or high resolution X-ray diffraction could be used.Reference Zhao, Mellors, Kilcoyne and Lord15,Reference Cao, Bai, Li, Viehland, Lograsso and Gehring16
Optical and SEM micrographs of Fe–Ga and Fe–Ga–B alloys.

Figure 3 shows optical micrographs of Fe–Ga and Fe–Ga–B alloys. It is not possible to distinguish between the phases with structures A2 and D03 because they have coherent interface. The binary alloy resembles single phase and the ternary alloy resembles a two phase alloy. The second phase in Fe–Ga–B is Fe2B.Reference Gao, Li, Zhu, Li and Zhang8 The grain structure was refined due to the addition of B. However, from X-ray analysis, both alloys are two-phases alloys; Fe–Ga with A2 and D03 structures and Fe–Ga–B with D03 and Fe2B phase. The Fe2B particles have spheroid shape and are mainly localized at grain boundaries but there are also particles inside the grains.
The chemical composition measured by EDS resulted in 18.6% of Ga (at.%) for both Fe–Ga and Fe–Ga–B alloys (matrix), with an error lower than 2%. This result also suggests that the excess of Fe added in the Fe–Ga–B alloy before melting was indeed used to generate the Fe2B phase, therefore corroborating with the prior assumption that B did not go into the lattice. It is worth to say that the mass losses during melting and heat treatment were negligible.
Material thermal history is also an important variable in the ordering/disordering behavior of Fe–Ga alloys as already explained.Reference Rahman, Gou, Liu, Ma and Yan3,Reference Ikeda, Kainuma, Ohnuma, Fukamichi and Ishida4 For both magnetic materials, Fe–Ga and Fe–Ga–B, the temperature of annealing used 1200 °C is well above the Curie temperature (650 °C) and both materials present D03 structure ordering as discussed by Borrego et al.Reference Borrego, Blazquez, Conde, Conde a and Roth17 However, the alloys with B presented even higher quantities of Fe3Ga (D03) compared to the one without B. The main reason for this is that the sample is massive (∼45 g) and even with the quenching after the annealing, the cooling process is not fast enough to prevent ordering.Reference Borrego, Blazquez, Conde, Conde a and Roth17,Reference Emdadi18 But as the cooling process of both Fe–Ga and Fe–Ga–B alloys was the same, some additional cause happened to the Fe–Ga–B alloy to have much more D03. We suggest the possibility that during the cooling of the alloys, the boride Fe2B (T C = 742 °C,Reference Iga, Tawara and Yanase19) in the Fe–Ga–B alloy turn out to be ferromagnetic before the Fe–Ga matrix, therefore Fe2B deforms due to spontaneous magnetostriction just close to 742 °C. This volumetric deformation may cause local stresses around Fe2B and therefore in the matrix. From thermodynamics point of view, the phase diagram of solids depends on temperature, concentration of components, pressure, and volume. Normally, pressure and volume are kept constant. However, if the pressure is not constant, and that would be the case of stresses caused on the matrix by the phase Fe2B, the phase equilibria and stability between the phases α and Fe3Ga (D03) in the Fe–Ga–B alloy phase diagram could change.
In Fe–Al–B alloys,Reference Bormio-Nunes and Hubert20 the addition of 1.6% of B to the alloy with 20% of Al caused the formation of Fe2B too and the matrix of the ternary alloy enriched in Al. In that case, the appearance of the Fe3Al (D03) phase was associated with the change of the composition of the matrix. However, in the present case, the composition of the Fe–Ga–B matrix was kept 18.6%, the same of the Fe–Ga binary alloy.
B. Static magnetic measurements
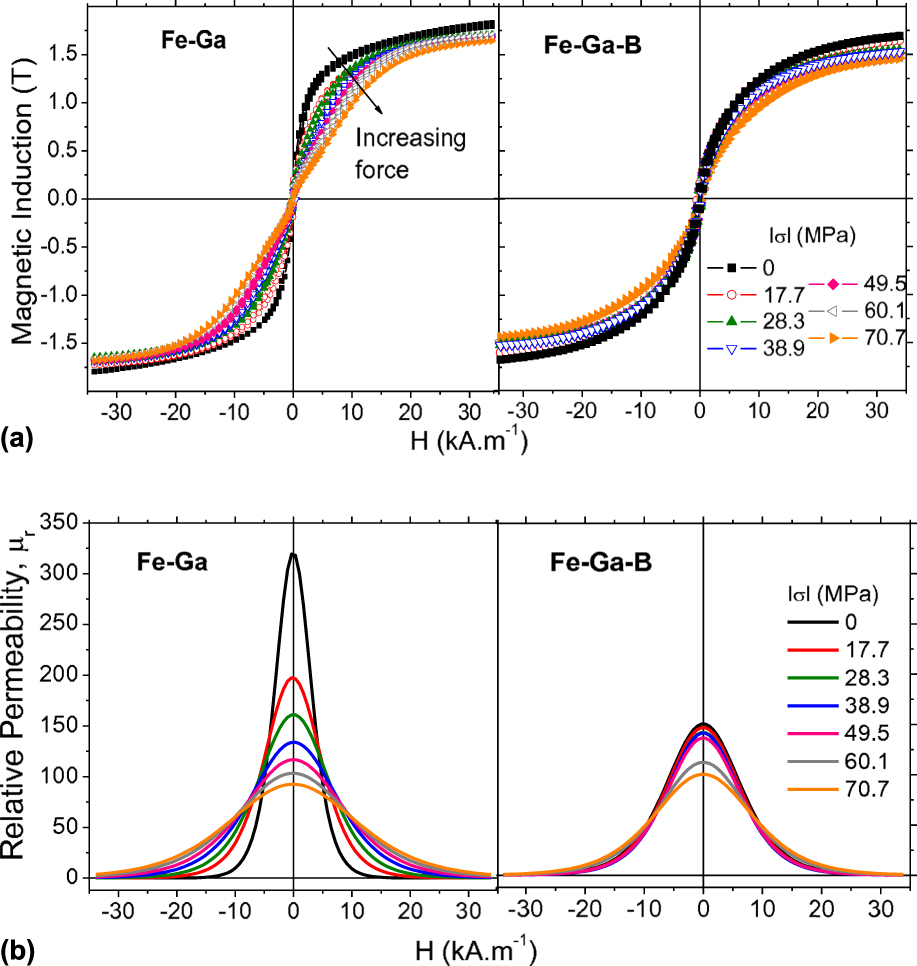
B versus H curves are shown in Fig. 4(a) for diverse fixed values of compression stresses up to |σ| = 70.7 MPa. In Fig. 4(b), the relative permeability μr versus H curves obtained by the derivative of B versus H curves and normalized by the value of the vacuum magnetic permeability are depicted.
Fe–Ga and Fe–Ga–B alloys: (a) B and (b) μr versus H, for compressive stress values of |σ| = 0, 17.7, 28.3, 38.9, 49.5, 60.1, and 70.7 MPa.

From B versus H curves, it is possible to notice that with the increasing of the applied stress, the inclination of the curves diminishes for both alloys. As a consequence, the relative permeability also decreases with increasing of the applied stress. This occurs because the compression stresses oblige the magnetic moments to align in the plane perpendicular to the force direction. Then, the compression stress induces an extrinsic anisotropy to the material, which is added to the intrinsic anisotropy. Consequently, more energy is necessary to overcome the additional extrinsic anisotropy due to the compression forces and magnetization saturation occurs in a higher field compared to σ = 0 condition. Relative permeability varies significantly with the applied stress in the alloy Fe–Ga, but varies less in Fe–Ga–B.
Although the permeability of Fe–Ga is higher than that of the Fe–Ga–B alloy, this happens only for compression stresses values of 0 and −17.7 MPa. For |σ| ≥ 28.3 MPa, μr is practically the same for both alloys. For Fe–Ga alloys with 18.4 and 20.9% of Ga, μr decreases significantly with application of compression stress,Reference Mahadevan, Evans and Dapino21 the same result observed in the polycrystalline Fe–Ga alloy of the present work. In addition, the alloy with 20.9% has lower permeability than the one with 18.4% of Ga, and the difference is attributed to the low crystal anisotropy of the alloy with highest Ga content. This decrease of the anisotropy is due to the partial ordering of the structure A2 → D03 for higher Ga contents than 18.4%. There is not an important contribution of the Fe2B phase to the magnetization mechanisms.
In this phase at the field level explored in the present work, the rotation of magnetic moments occurs only in the easy directions,Reference Bormio-Nunes and Hubert20 which result in a high initial susceptibility. Therefore, Fe2B does not contribute to the decrease of the initial susceptibility for σ = 0.
Consequently, we attribute the noteworthy drop observed in μr for σ = 0 of Fe–Ga–B also to the A2 → D03 induced by the slow cooling rate and the presence of the Fe2B phase during the solidification process.
In addition, with respect to the hysteresis width, values of coercive field of 200 A/m and 249 A/m were found for Fe–Ga and Fe–Ga–B alloys, respectively. These values of H c reveal that the increase of grain boundaries in Fe–Ga–B, due to the refined grain structure compared to Fe–Ga, is not providing strong domain wall pinning since the increase on H c is not too strong.
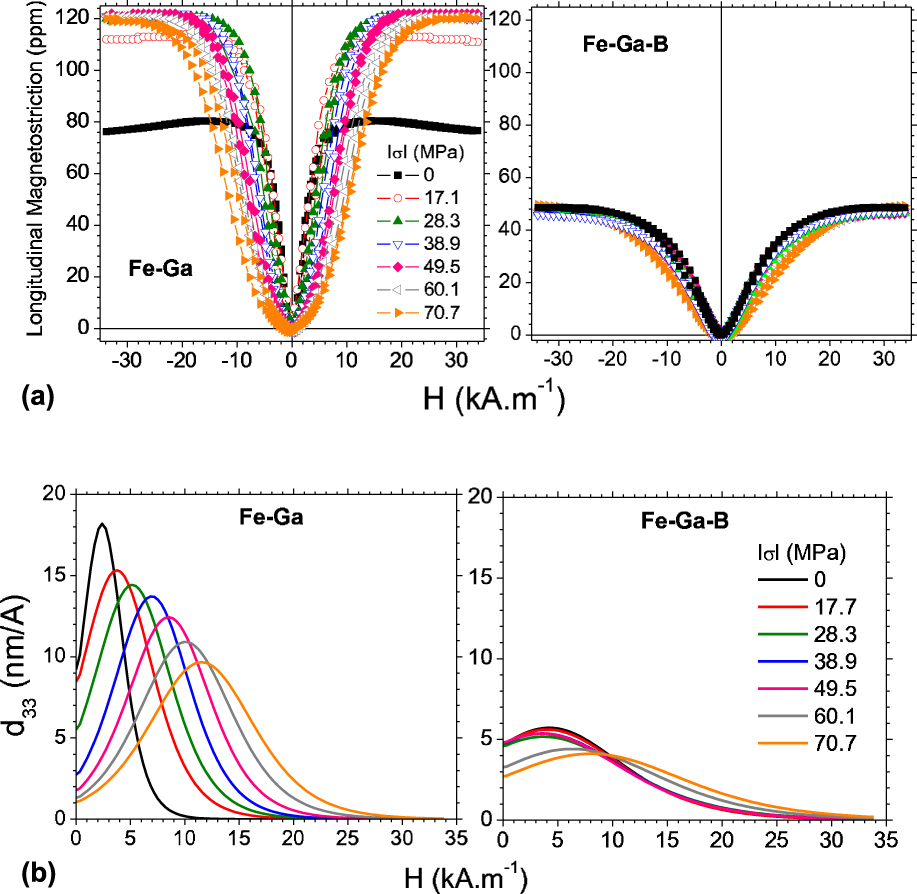
The longitudinal magnetostriction λlong and the magnetomechanical coefficient d 33 = dλlong/dH curves as a function of the applied field H are depicted in Figs. 5(a) and 5(b), respectively. From these curves, the detrimental effect of B addition to the magnetomechanical properties of the Fe–Ga alloy is clear. The alloy Fe–Ga–B is almost not influenced by the application of prestress in the range 0 ≤ |σ| ≤ 70.7 MPa. The saturation value of λlong is constant ∼50 ppm. Therefore, the jump effect, which is the enhancement of the magnetostriction due to application of stress, is almost not present in Fe–Ga–B. This is coherent because this effect is much more pronounced in materials that have high magnetic anisotropy. In the case of Fe–Ga–B, the phase Fe3Ga with D03 structure has a much smaller anisotropy compared to the α-phase.Reference Kumagai, Fujita, Fukamichi, Oikawa, Kainuma and Ishida22
Magnetostriction and sensitivity of alloys Fe–Ga and Fe–Ga–B: (a) λlong and (b) sensitivity d 33 = dλlong/dH versus H for compressive stress values in the range 0 ≤ |σ| ≤ 70.7 MPa.

While, Fe–Ga has saturation λlong increased from 78 to ∼120 ppm for |σ| ≥ 28.3 MPa. In fact, the magnetomechanical coefficient depends on the inclination of the curves λlong versus H before saturation, and from Fig. 5(a), it is possible to see the higher variation of the slope of the curves of the Fe–Ga alloy compared to Fe–Ga–B.
The domain wall movement controls magnetostriction increase up to saturation and the width of the wall is important on this mechanism. The phase α has higher anisotropy than Fe3Ga (D03)Reference Rafique, Cullen, Wuttig and Cui23 and the domain wall width is  $\delta = \pi {\left( {{A / K}} \right)^{1{\rm{/}}2}}$, where A is the exchange stiffness constant and K is the anisotropy constant.Reference O’Handley24 Therefore, considering that Fe atoms have the same exchange energy in both structures, it is expected that the domain walls in the D03 structure are much wider than in A2. Indeed, larger domain walls was found for slow cooled Fe–Ga alloys compared to quenched onesReference Golovin25 in a maze-like domain pattern, a characteristic of the ordered structure.Reference Emdadi18 As a result, in the D03 structure, the magnetostriction is controlled basically by magnetic moment rotation, while in A2 is effectively domain wall movement by the rotation of a smaller quantity of magnetic moments. In addition, the random distribution of magnetic moments in Fe2B results in smaller magnetostriction curve inclinations.
For both materials, the maximum d 33 (sensitivity) values occur for σ = 0, being 18 nm/A and 5.7 nm/A for Fe–Ga and Fe–Ga–B, respectively. The lowest values occur for σ = −70.7 MPa and are 8.10 nm/A (Fe–Ga) and 4.1 nm/A (Fe–Ga–B). The rate of decrease on sensitivity is more pronounced in Fe–Ga.
C. Quasi static magnetic measurements
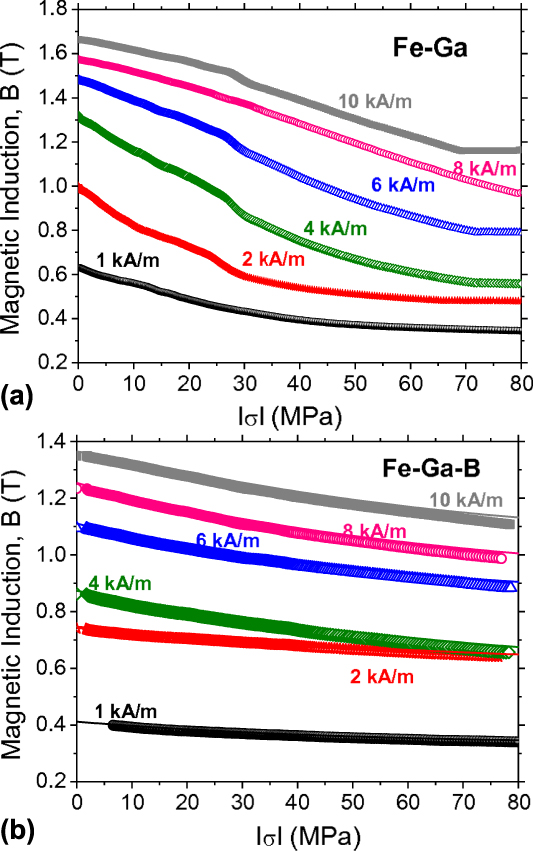
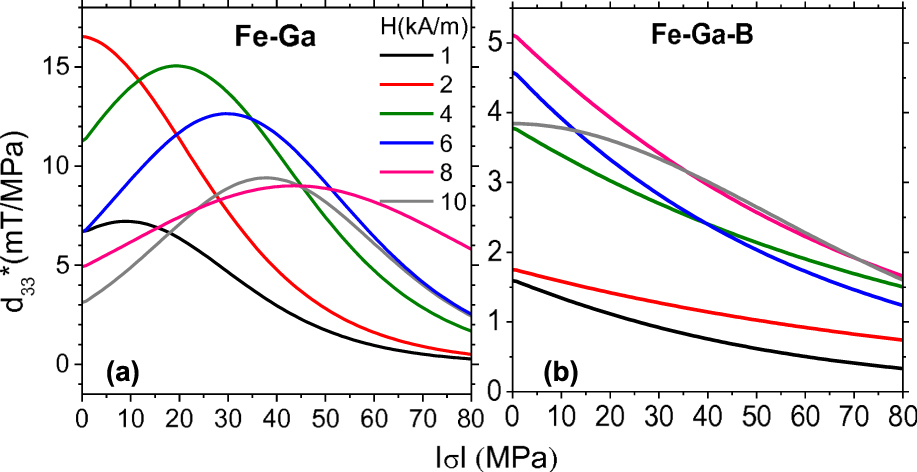
The curves of magnetic induction as a function of the continuously applied compression stresses at fixed values of the magnetic field H are shown in Figs. 6(a) and 6(b). In Fig. 7, the corresponding derivatives of the curves of Fig. 6 are depicted and represent the PZM coefficient (sensitivity) of the materials to be used as a force sensor, d 33*.
Magnetic induction B versus |σ| curves of alloys (a) Fe–Ga and (b) Fe–Ga–B, for fixed magnetic field values of 1, 2, 4, 6, 8, and 10 kA/m.

d 33* = dB/d|σ| versus |σ| of the alloys Fe–Ga (a) and Fe–Ga–B (b) in the range of 0 ≤ |σ| ≤ 80 MPa and fixed magnetic field values of 1, 2, 4, 6, 8, and 10 kA/m.

Once more, the sensitivity is higher for Fe–Ga than the Fe–Ga–B alloy and consequently, the PZM coefficient. This coefficient representing the capacity of transforming mechanical energy in electric (magnetic) energy is also higher.
For Fe–Ga, maximum values of d 33* varies from 6 to 16 mT/MPa for applied fields between 2 and 8 kA/m. As for the Fe–Ga–B, varies from 2 to 5 mT/MPa for an applied field of 8 kA/m.
The Fe–Ga d 33* versus σ curves have a parabolic shape with negative concavity. To work with the maximum sensibility, a field of 2 kA/m should be used up to 11.7 MPa, 4 kA/m for 11.7 < |σ| < 35 MPa, 6 kA/m for 35 < |σ| < 51 MPa, and 8 kA/m for 51< |σ| < 80 MPa. While, Fe–Ga–B d 33* versus σ curves have a linear shape with negative inclination and for 8 kA/m, the maximum sensibility is achieved in the hole σ interval.
A constant behavior of the sensitivity should be ideal in a defined σ window, to have the same accuracy for all values of σ measurements. In addition, a maximum sensibility, at a fixed field, is better for the engineering of a sensor than in a varying field. In a dispositive, the field can be applied by a constant current or even a permanent magnet, simplifying the electronics and mounting of the sensor.
Therefore, although Fe–Ga–B has a lower sensitivity than Fe–Ga–B, the fact that it can be used in constant field is a good feature. Moreover, the Fe–Ga–B alloy mechanical processing is unproblematic. The presence of the intergranular phase Fe2B promotes more cohesion of grain boundaries and fracture of transgranular type occur instead of intergranular, which makes the material better machinable than Fe–Ga.Reference Gao, Li, Zhu, Li and Zhang8
IV. CONCLUSIONS
The addition of 2 at.% of B to the Fe–Ga alloy caused the refinement of the Fe–Ga phase grains, thanks to the development of the Fe2B phase in the grain boundaries.
The slow cooling of the sample and existence of the Fe2B phase favors the ordering of the matrix (Fe–Ga) of Fe–Ga–B alloy. A much higher quantity of the ordered Fe3Ga (D03) phase is observed in the alloy with B compared to the binary alloy, which causes the detriment of the magnetostriction.
Finally, the addition of B to the Fe–Ga alloy decreased significantly both PZM coefficients d 33 and d 33*. Despite the PZM coefficient d 33* of the Fe–Ga–B is smaller than in Fe–Ga, it has some virtues. The maximum d 33* values are achieved for a constant field of 8 kA/m. Therefore, for a fixed applied field, only a fixed current is necessary to generate the applied magnetic field. Moreover, the values of d 33* vary from 5 to 2 mT/MPa, for |σ| < 80 MPa and are adequate enough for many applications.Reference Jiles and Lo10 All these good properties are coupled to a better ductility material compared to Fe–Ga.