

In Canadian politics, what happens at the district level is still understudied compared to the national level. Paying attention to MPs and constituency politics seems to be in conflict with the traditional understanding of political representation (Stewart, Reference Stewart1977). However, some scholars have recently argued that we need to focus more on the local level (Blidook, Reference Blidook2012; Carty and Eagles, 2005; Cross, Reference Cross2016). For a better understanding of Canadian electoral politics, we must take into account the multilevel nature of campaigns and not only focus on the national level. We lack knowledge about local politics and we particularly know very little about voters with a preference for an individual local candidate.
We can divide the literature about the local level in elections in two broad categories. Some researchers have studied the role of political parties and candidates at the district level. Others have focused on voters’ reactions to the local context.
First, Cross (Reference Cross2016) dedicated his Canadian Political Science Association presidential address to demonstrating the importance of grass-root level activity in the Liberal victory in the 2015 Canadian federal election. He notably focuses on volunteer recruitment, financing and membership renewal, which happen mostly at the level of local associations. Furthermore, there are quite a few studies on the relationship between party or candidate spending and electoral outcomes at the level of the district. Johnston and Pattie (Reference Johnston and Pattie1989) find that in the UK the more a party spends the better its chances of winning in a constituency.
Even adding more controls, Eagles (Reference Eagles1993, Reference Eagles2004) report that candidate spending is a major determinant of electoral outcomes at the local level in the elections of 1984, 1988, 1993 and 1997. For example, the outcome of the 1988 Canadian election would have been different in 35 constituencies if all major parties had spent their allowable limit of money. Moreover, recent studies conducted by Milligan and Rekkas (Reference Milligan and Rekkas2008) and Rekkas (Reference Rekkas2007) conclude that the greater the spending limit, the less competition and thus the greater the winner's victory margin.
Finally, scholars have examined the impact of incumbency. Krashinsky and Milne (Reference Krashinksy and Milne1985) studied Canadian elections from 1926 to 1980. They find that incumbents enjoyed a bonus of 4 points between 1957 and 1980 and that this impact was even more important for Social Credit. A more recent study reports that the probability of being elected is about 10 percentage points higher among incumbents (Kendall and Rekkas, Reference Kendall and Rekkas2012).
A second approach has focused on voters instead of political parties. A rich literature examines strategic considerations at the level of the district and evaluates the extent to which voters desert their preferred party when that party has little chance of winning in their constituency. They find that about 3 to 8 per cent of voters strategically desert their preferred party (Blais and Nadeau, Reference Blais and Nadeau1996; Blais et al., Reference Blais, Nadeau, Gidengil and Nevitte2001; Daoust, Reference Daoust2015). Others have examined how voters react to local candidates. Blais and colleagues (2003) showed that in the 2000 Canadian election around 40 per cent of Canadian voters expressed a preference for a particular local candidate. These authors then show that the local candidate was a decisive factor for 5 per cent of the electorate, that is, they would have voted differently if they had had no preference among the local candidates (Blais et al., Reference Blais, Gidengil, Dobrzynska, Nevitte and Nadeau2003). In this research note we tackle two slightly different questions: How many voters particularly like a candidate from another party? And do these voters vote for their preferred party or their preferred candidate?”
To address these questions, we use the Making Electoral Democracy Work data for the 2015 Canadian federal election (Blais, Reference Blais2010). Three surveys were conducted in British Columbia, Ontario and Quebec. The surveys were conducted online among recruited panel members, with quotas that guarantee that the samples are representative of the electorate with respect to age, gender, education and region. They each include around 1800 respondents in a first wave and about 1300 in the second wave. The analysis includes only those who reported voting in the second wave and who provided information about their party and candidate preferences. The data (N = 3258) are weighted so that the reported vote in each province corresponds to the actual vote.
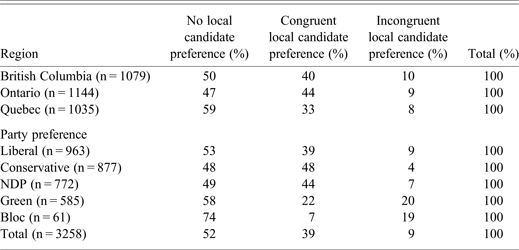
Respondents were asked how much they liked each party on a scale from zero to ten. This allows us to identify each respondent's preferred party.Footnote 1 In the same wave people were asked if “there is a local candidate that you particularly like in your riding?’’ and if so to indicate from which party. Forty-eight per cent of the respondents expressed a preference for a local candidate. As could be expected, most of them (81%) mentioned the candidate associated with their preferred party. We thus have about 52 per cent with no preference for a local candidate, 39 per cent with a preference for the candidate of their preferred party, and 9 per cent who particularly like a candidate from a non-preferred party. Table 1 displays the descriptive statistics, where we first indicate the proportion of voters with no local candidate preference, then those with a local candidate preference which is congruent with the preferred party and finally those with a local candidate preference which is not congruent with the preferred party. This latter category is the one of interest.
Party and local candidate preferences

Note: The percentages add up horizontally, that is, 53% of those who prefer the Liberal party have no local candidate preference, 39% prefer the Liberal local candidate (congruent preference), and 9% prefer a local candidate from another party (incongruent preference).
The highest percentage of people with no local candidate preference is in Quebec (59%). There is little difference between British Columbia and Ontario. Second, those who support the Green party and the Bloc Québécois are more likely to express no local candidate preference, and when they do they are more likely to have an incongruent preference, that is, to like a candidate from another party. This probably reflects the fact that many candidates from these parties were less well known in their constituencies.
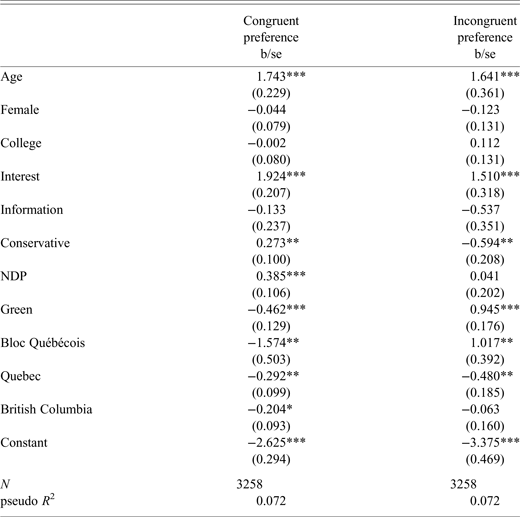
These differences remain significant when we run a multinominal regression (see Table A1 in the appendix). The analysis also includes sociodemographic variables, political interest and political knowledge.Footnote 2 We can see that the propensity to have a preference, either congruent or incongruent, is higher among those who are older and more interested in politics, and who are more prone to form opinions about the candidates.
We now focus on the group that interests us the most, that is, those who like a candidate from a non-preferred party. Our (very simple) question is: Do they vote for their preferred party or their preferred candidate? We leave aside those who vote for neither of them as well as those who voted for strategic reasons since our question is about whether those with incongruent preferences put greater weight to their views about the parties or to those about the local candidates.Footnote 3 Hence, we screened out strategic voters following a well-established approach (Blais and Nadeau, Reference Blais and Nadeau1996). First, we identified voters who met either of the following two conditions: their preferred party was not one of the top two contenders in their constituency and they voted for the party they liked the most among the top two contenders, or their preferred candidate was not one of the top two candidates in their constituency, and they voted for the party they liked the most among the top two contenders.
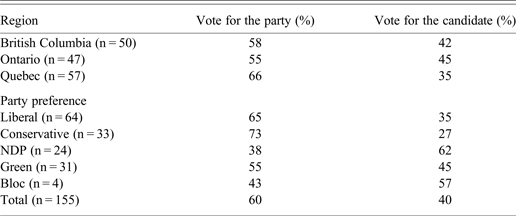
When we remove those voters, we find that 60 per cent of those with conflicting preferences voted for the preferred party and 40 per cent for the preferred candidate. Table 2 displays the results.
Vote choice among non-strategic voters with incongruent preferences

Note: The percentages add up horizontally. Among those who prefer the Liberal party and a candidate from another party (and thus with incongruent preferences), 65% voted for the preferred party (Liberal) and 35% for the local candidate (and thus for another party).
In general, those who prefer the stronger parties (the Liberals and the Conservatives) tend to vote to a greater extent for their preferred party and those who prefer the weaker parties tend to vote for their preferred local candidate. Quebeckers are somewhat more likely to stick with their preferred party.
In short, in these three provinces, around one voter out of ten particularly liked a candidate from a party other than the one he or she preferred in the 2015 Canadian election. For two out of five of such voters, the preference for the local candidate trumped the party preference. Sticking with the local candidate is more frequent among those who prefer smaller parties, like the Bloc and the NDP. This is most likely due to the fact that people prefer voting for a party with some reasonable chances of winning. As it was clear that the Liberals and the Conservatives were the two main viable parties, at least during the last two weeks of the campaign, voters who preferred one of these two parties were more likely to stick with the party and not the preferred candidate. To the contrary, supporters of minor parties appear to be tempted to desert their non-viable party and vote for a local candidate from a viable party.
This research contributes to the growing literature about the local dimension of elections (Allen and Bartle, Reference Allen and Bartle2011; Jung, Reference Jung2008; Marsh et al. Reference Marsh, Sinnott, Garry and Kennedy2008). We believe that these results open many more questions that should be taken up in further analyses and that the local level should be a more prevalent feature of Canadian election studies.
Appendix
The determinants of local candidate preference