Implications
A study on the effects of tannin-rich extracts on methane release from sheep was conducted. Few long-term studies of this type have been carried out. We found that the inclusion of chestnut and valonea extract in feed did not change the release of methane from sheep. Upon feeding with the tannin-rich extracts, a portion of the excreted N was shifted from urine to faeces, which may help to reduce ammonia release from manure. The effects may have been greater if higher dosages were used. However, higher dosages are more likely to be associated with negative effects on nutrient digestibility and feed intake.
Introduction
Methane is a potent greenhouse gas, of which about 11% to 17% of global emissions consist of enteric methane produced by ruminants (Beauchemin et al., Reference Beauchemin, McAllister and McGinn2009). Its production serves as an electron sink, thereby avoiding hydrogen accumulation, which would negatively affect rumen fermentation (Martin et al., Reference Martin, Morgavi and Doreau2010). The release of methane seems to be a key-process in an unmodified rumen fermentation, but also represents an energy loss for the host animal (Johnson and Johnson, Reference Johnson and Johnson1995).
Methane production can be reduced by different means, including plant constituents such as saponins and tannins (Van Nevel, Reference Van Nevel1996; McAllister and Newbold, Reference McAllister and Newbold2008; Hook et al., Reference Hook, Wright and McBride2010). Tannins – a fraction of polyphenols in plants – are generally divided into condensed (CT) and hydrolysable (HT) tannins. Since tannins are able to form complexes with feed and microbial proteins, polymer carbohydrates (e.g. cellulose and hemicellulose), and minerals, they may modify the metabolism of these substances in the rumen (McSweeney et al., Reference McSweeney, Palmer, McNeill and Krause2001). For example, tannins may protect dietary protein against rumen degradation and increase the efficiency of microbial protein synthesis, provided that adequate levels of N are available (Patra and Saxena, Reference Patra and Saxena2011), thus altering N excretion (Makkar, Reference Makkar2003).
Tannins may have anti-nutritive effects (Reed, Reference Reed1995), which are assumed to be mainly associated with HT (Mueller-Harvey, Reference Mueller-Harvey2006; McAllister and Newbold, Reference McAllister and Newbold2008) suggesting that only CT are suitable for use in animals. Hence, research on the influence of tannins on the release of methane has mainly focused on CT. However, Mueller-Harvey (Reference Mueller-Harvey2006) suggested that both tannin classes are similar with regard to their methane mitigating effects. Moreover, Goel and Makkar (Reference Goel and Makkar2011) concluded that HT appear even more promising for methane reduction than CT.
In previous in vitro studies, we showed that chestnut (CHE) and valonea (VAL) extracts – which mainly contain HT – have great potential to reduce methane production (Wischer et al., Reference Wischer, Boguhn, Steingaß, Schollenberger and Rodehutscord2013). In contrast to CT, HT are thought to be degradable in the rumen (Makkar, Reference Makkar2003), suggesting that the effects of HT identified in vitro may disappear with time in vivo due to rumen degradation (Murdiati et al., Reference Murdiati, McSweeney and Lowry1992). Thus, animal studies are required to investigate whether tannins are able to reduce methane release over a longer period of several weeks (de Oliveira et al., Reference de Oliveira, Berchielli, MdS, Primavesi, Frighetto and Lima2007; Beauchemin et al., Reference Beauchemin, McAllister and McGinn2009; Jayanegara et al., Reference Jayanegara, Wina, Soliva, Marquardt, Kreuzer and Leiber2011). The first objective of the present study was to examine the effect of long-term feeding of CHE and VAL extract on methane release in sheep. We hypothesised that the supplementation of CHE and VAL extract in the diet would lead to a consistent decrease in methane release.
For a more comprehensive and long-term assessment, the effects of supplementation of the two tannin-rich extracts on digestibility, energy metabolism, N excretion and microbial protein synthesis were also investigated. It was hypothesised that the pathways of N excretion and microbial protein synthesis in the rumen, but not the overall digestibility, would be altered by the tannin-rich extracts.
Finally, both tannin-rich extracts were also investigated using an in vitro trial to compare in vitro and in vivo effects of the tannin-rich extracts on methane release. We hypothesised that the in vitro and in vivo experiments would show similar results.
Material and methods
The study was approved to be in accordance with the animal welfare legislation by the Provincial Government of Stuttgart, Germany (No. V 285/10 TE). Two experiments were conducted using different amounts of tannin-rich extract supplements. The second experiment was initiated 4 months after starting the first experiment, when it became apparent that the tannin dosage in Experiment 1 did not produce significant effects on methane release.
Two tannin-rich extracts (CHE and VAL) were used in both experiments. The CHE extract originated from sweet chestnut wood (Castanea sativa; Tanin Sevnica d.d., Sevnica, Slovenia). The VAL extract, an extract of the pods of the valonea tree (Quercus valonea; Valonea extract Standard, Baeck GmbH & Co. KG, Norderstedt, Germany), contained a tannin concentration of 67.0% (manufacturer’s specification). The analysed concentrations of total phenols and tannin phenols (in % of DM (dry matter)) for CHE-rich extract were 79.1 and 68.6, and for VAL-rich extract 71.5 and 63.3. CT were not detected in either of the tannin-rich extract.
Animals and treatments
Twenty-four 8-month-old wether sheep (Merinolandschaf breed) were used in the study. Three weeks before the measurements, the sheep were adapted to the experimental conditions and facilities (Supplementary Figure S1). Twelve sheep with an initial BW of 65.4±5.0 kg (mean±s.d.) were used in Experiment 1. The other 12 animals (59.9±5.5 kg) were used in Experiment 2. The amount of feed offered was related to the average initial metabolic body size (BW0.75) of all 12 animals included in one experiment, which was determined before the experiments started. The amount of feed was not changed throughout the experimental period in both experiments in order to not affect repeated measures of gas production. Animals were housed in groups of four; however, they were individually fixed to troughs for meals in order to control individual feed intake. Animals had unrestricted access to water.
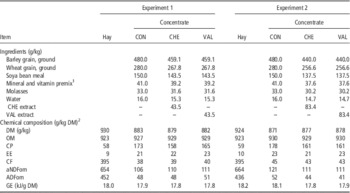
The feed comprised of a hay-concentrate mix, which was offered throughout the entire experimental period in two equal meals per day (at about 0800 and 1530 h). It was calculated to achieve a daily metabolisable energy (ME) intake of ~1.2-fold of the mean maintenance requirement (Gesellschaft für Ernährungsphysiologie (GfE), 1991; Deutsche Landwirtschafts-Gesellschaft, 1997). Sheep were fed 842 and 784 g/day of hay (Table 1) in Experiments 1 and 2, respectively. The control animals (CON) received 464 and 432 g/day of mixed concentrate, whereas the animals treated with tannins received 484 and 468 g/day concentrate in Experiments 1 and 2, respectively, with the respective differences from CON representing the amount of tannin-rich extracts included in dry form. Concentrates were calculated to provide a daily amount of 0.9 and 1.7 g/kg BW0.75 of the tannin-rich extract in Experiments 1 and 2, respectively. The dosage of tannin-rich extracts used in Experiment 1 was chosen based on an intoxication study with sheep using a quebracho extract (Hervás et al., Reference Hervás, Pérez, Giráldez, Mantecón, Almar and Frutos2003). The initial dosage was not chosen higher because CHE extract consists mainly of HT described to be toxic for animals (Mueller-Harvey, Reference Mueller-Harvey2006). When it became apparent that methane release of sheep was not affected, and in preparation of Experiment 2, a short acceptance test with sheep using different dosages of CHE extract was conducted. Feed intake was impaired when concentrations exceeded that of Experiment 1 by a factor of three. Consequently, concentrations used in Experiment 2 were chosen to be double of that used in Experiment 1. The composition of the concentrates is shown in Table 1. The total amount of concentrate required was mixed in one batch and divided into three equal portions. The CON concentrate was not supplemented. For tannin treatments in Experiments 1 and 2, the respective amount of tannin-rich extract was added on top of each kilogram of the CON concentrate. Tannin-containing concentrates were mixed again, and all three concentrates were pelleted through a pellet die with a hole diameter of 3 mm.
Composition and analysed concentrations of chemical fractions of hay and concentrates

CON=control; CHE=chestnut extract; VAL=valonea extract; DM=dry matter; OM=organic matter; EE=ether extract; CF=crude fibre; aNDFom=neutral detergent fibre; ADFom=acid detergent fibre; GE=gross energy.
1 Contained per kg: 555 g calcium carbonate, 255 g sodium chloride, 50 calcium sodium phosphate, 47 g mono calcium phosphate, 40 g magnesium oxide, 25 g molasses, 330 000 IU vitamin A, 50 000 IU vitamin D3 (dl-α-tocopheryl acetate), 1500 mg vitamin E, 150 mg vitamin B1, 20 000 µg biotin, 6000 mg zinc (zinc oxide), 6000 mg manganese (manganese-II-oxide), 60 mg iodine (calcium iodate), 20 mg cobalt (cobalt-II-sulphate, heptahydrate), 10 mg selenium (sodium selenium).
2 Averaged over balance periods.
Respiration measurements
Two respiration chambers were used in both experiments. During a 3-week pre-experimental period, all sheep were fed with the CON diet (Supplementary Figure S1). Thereafter, the pre-experimental methane release from each animal was measured twice for 23.5 h (periods R1 and R2, Supplementary Figure S1). Sheep were weighed (BWI-30000; Bosche GmbH, Damme, Germany) before and after each respiration measurement. Animals were then allocated to the treatments in a way that the average pre-experimental methane release related to BW0.75 was equal (n=4 sheep/treatment). Within one treatment, two animals were assigned to each of the two chambers.
Feeding of the experimental diets was started consecutively for two animals per day so that all respiration measurements could be taken at the same time intervals (Supplementary Figure S1), that is on days 1, 8, 15, 29, 57 and 85 after the onset of treatment in both experiments. Experiment 1 was conducted for a longer period, and additional respiration measurements were taken on days 113, 148 and 190. After onset of treatments, repeated measures were made nine and six times in Experiment 1 and 2, respectively. Troughs in the chambers contained the morning meal when sheep were moved inside, and the afternoon meal was released from a storage container above the trough. Hence, chambers remained closed for the whole period of measurement.
The dimensions of the independently constructed open circuit respiration chambers were 205×100×250 cm, with an effective volume of 5000 l. A humidity of ~50% and a temperature of ~20°C were maintained by air conditioning. Sheep were placed in balance cages inside the chambers (70 cm wide, 150 cm long) to collect samples of urine and faeces.
During the 23.5-h measurement period, the amount of gas outflowing from the chambers was quantified using differential pressure transmitters (H+B ND400; ABB Automation GmbH, Ratingen, Germany) and averaged 72 m3 across all measurements in both chambers. The concentrations of methane (CH4) and carbon dioxide (CO2) in inflowing and outflowing air were measured using an IR absorption gas analyser (H+B Uras 10; ABB Automation GmbH) and were logged online in 15-min intervals (separately for each chamber). In addition to the online measurements, aliquots of inflowing and outflowing air were collected in gas receptors, which were used as backup when the online measurement failed. This occurred in eight out of 228 respiration measurements. The ratio between online and aliquot measurements across all measurements was on average 1.03±0.01 (mean±s.d.). The gas analyser was calibrated daily using a reference gas (vol%: 0.099 CH4 and 0.964 CO2; Air Liquide Deutschland GmbH, Düsseldorf, Germany) and controlled for subsequent correction of temporary drift. The recovery was controlled periodically by the release of a defined amount (~400 g within 6 h) of CO2. Recovery rates were considered in the calculations of inflowing and outflowing air volume.
Balance studies
In both experiments, three balance studies (B) were conducted and digestibility was determined considering the protocol suggested by GfE (1991): B1, pre-experimental period; B2, starting 22 days after the onset of treatments; and B3, at the end of the respective experiment (Supplementary Figure S1). Urinary excretion of total N and purine derivatives was also determined during these periods. Faeces were collected for 6 consecutive days using a special harness to separate faeces from urine. Urine was collected for 3 consecutive days due to limited number of balance cages. Therefore, the wethers were housed 3 days during a balance study in a cage with the possibility to collect faeces and urine and 3 days in a separate box in the stable to collect only faeces.
Urine was trapped in ~200 ml of 10% sulphuric acid, achieving a final pH of less than three to prevent the release of volatile N compounds. Amount of faeces and urine were determined, proportional daily aliquots taken, accumulated for each animal, and stored at 0°C. A representative sample of fresh faeces was crushed and used for analysis of total N concentration. Subsequently, the faeces were oven-dried at 60°C for 48 h and ground through a 0.5-mm sieve for further analyses. Urine was filtered (MN 615
 ${\raise0.5ex\hbox{$\scriptstyle 1$}\kern-0.1em/\kern-0.15em\lower0.25ex\hbox{$\scriptstyle 4$}}$
Filter Papers; Macherey-Nagel, Düren, Germany) and analysed for total N concentration. For analysis of purine derivatives, 10 ml of urine was diluted with double-distilled water (1 : 10, v/v), placed in six centrifuge tubes per sample, and stored at −20°C for a maximum of 3 months until analysis.
Hohenheim gas test
In addition to the animal experiments, the total gas and methane production was measured using the Hohenheim gas test (Menke et al., Reference Menke, Raab, Salewski, Steingass, Fritz and Schneider1979) according to the official method (25.1; Verband Deutscher Landwirtschaftlicher Untersuchungs- und Forschungsanstalten (VDLUFA), 2006). Rumen content was obtained before the morning feeding from two rumen fistulated, non-lactating Holstein–Friesian cows, mixed, filtered and flushed with CO2 until the incubation started; 44 mg of concentrate and 76 mg of hay was weighed in 100 ml glass syringes. The hay and the concentrates were ground to pass a 1-mm sieve. Eight replicated syringes were used per treatment. Pre-warmed syringes were filled with the feed and 30 ml of a mixed rumen fluid-buffer solution and incubated at 39°C for 24 h. The total gas production was recorded and the methane concentration was analysed using an IR methane analyser (Pronova Analysentechnik GmbH & Co. KG, Berlin, Germany), which was calibrated using a reference gas (12.0 vol% CH4; Air Liquide Deutschland GmbH). Total gas and methane production corrected by blanks were standardised to 120 mg DM of feed per syringe.
Analyses
Tannin-rich extracts and concentrates were analysed for total and tannin phenols using the Folin–Ciocalteu method (Jayanegara et al., Reference Jayanegara, Wina, Soliva, Marquardt, Kreuzer and Leiber2011) with modifications as described by Wischer et al. (Reference Wischer, Boguhn, Steingaß, Schollenberger and Rodehutscord2013). CT were analysed according to Jayanegara et al. (Reference Jayanegara, Wina, Soliva, Marquardt, Kreuzer and Leiber2011).
Hay, concentrate and faeces were analysed for crude nutrients according to official methods (VDLUFA, 2006): DM (method 3.1) and crude ash (method 8.1), CP (method 4.1.1), ether extract (EE; sample treated with HCl and extracted with petroleum ether, method 5.1.1b) and crude fibre (CF; method, 6.1.1). Samples were also analysed for NDF – assayed using thermally stable amylase – and ADF, both without residual ash (methods 6.5.1 and 6.5.2, VDLUFA, 2006; Fibretherm, Fa. C. Gerhardt GmbH & Co. KG, Königswinter, Germany). The total N concentration of fresh faeces and urine was analysed using the Kjeldahl method (method 4.1.1; VDLUFA, 2006). The gross energy in feed and faeces was determined using a bomb calorimeter (C 200; Ika-Werke GmbH & Co.KG, Staufen, Germany).
Uric acid, hypoxanthine and xanthine were analysed according to the method of Balcells et al. (Reference Balcells, Guada, Peiro and Parker1992) with the following modifications. The HPLC consisted of a binary pump, an autosampler, a column oven and a diode-array detector from the Agilent 1100 series (Waldbronn, Germany). A Nucleosil 120-5 C18 column (250×4 mm) equipped with a corresponding guard column was used as the stationary phase (Macherey-Nagel). The column temperature was maintained at 15°C. Injection volume was 20 µl. Two solvents (0.01 M sodium dihydrogen phosphate (pH 4.0)/acetonitrile, (99/1) (v/v) (sol. A) and 0.04 M sodium dihydrogen phosphate (pH 4.0)/acetonitrile, 80/20 (v/v) (sol. B)) were used as mobile phases in a gradient mode with a flow rate of 0.8 ml/min: 0 to 5 min isocratically 100% A, 5 to 10 min from 0% B to 15% B, 10 to 12 min from 15% B to 100% B, 12 to 20 min isocratically 100% B, 15 min post-runtime 100% A. Oxypurines were detected with the diode-array detector using wavelengths of 286, 248 and 268 nm for uric acid, hypoxanthine and xanthine, respectively. Samples were analysed in duplicate. The method was shown to be linear within a range of 1 to 250 µmol/l for uric acid and xanthine and 1 to 500 µmol for hypoxanthine (R 2>0.999 for all analytes). The detection limit was 0.1 µmol/l at a signal-to-noise ratio of 3 : 1. Recovery rates at a spiking level of 10 µmol for uric acid and xanthine and 5 µmol for hypoxanthine were between 97% and 100%, with relative standard deviations below 1% (n=4).
Pre-column derivatisation of allantoin using 2,4-dinitrophenylhydrazine was performed according to Chen et al. (Reference Chen, Kyle and Orskov1993). A blank value of each sample was derivatised without 60 min heating of the sample with NaOH before 2,4-dinitrophenylhydrazine addition and was subtracted from the sample value. Samples were analysed in duplicate. The apparatus and column used were as described above, and the column temperature was 20°C. Gradient elution was performed using two solvents as mobile phases: 0.01 M acetic acid/methanol 84/16 (v/v) (sol. A) and methanol (sol. B) in gradient mode with a flow rate of 0.8 ml/min: 0 to 15 min from 75% A to 40% A, 15 to 21 min 40% A, 21 to 22 min from 40% A to 75% A, 10 min post-runtime 75% A. Detection was set at UV 360 nm; the injection volume was 20 µl. The main isomer was used for quantification. The method was shown to be linear within the range of 1 µmol/l to 2 mmol/l (R 2>0.999). The detection limit was at 0.2 µmol/l at a signal-to-noise ratio of 3 : 1. The recovery rate at a spiking level of 0.5 mmol was at 100%, and the relative standard deviation was 1.3% (n=6).
Calculations and statistical analyses
Methane and CO2 release – measured in 23.5 h – was extrapolated to 24 h based on the release of gases averaged in the last 2 h and expressed per kilogram of BW0.75. Digestibility was calculated as the difference between intake and faecal excretion in relation to intake and expressed as a percentage.
To calculate ME, urinary energy and methane energy were subtracted from digestible energy. Urinary energy was estimated from the concentration of N in urine by equation No. 5.33 of Schiemann et al. (Reference Schiemann, Nehring, Hoffmann, Jentsch and Chudy1971) and converted to MJ (Equation 1, r=0.935):
 $${\rm h3}={\rm 86}{\plus}{\rm 7}.{\rm 88}{\times}{\rm h1}$$
h3=urinary energy in kcal; h1=urinary N in g.
The two respiration measurements closest to the balance period were used to calculate average methane release (R1 and R2 for B1; R5 and R6 for B2; R10 and R11 for B3 in Experiment 1 and R7 and R8 for B3 in Experiment 2; see Supplementary Figure S1). The methane energy was calculated using the equation of Brouwer (Reference Brouwer1965) and converted to MJ. Microbial protein synthesis was calculated using the urinary excretion of purine derivatives according to equations (1) and (2) of Chen et al. (Reference Chen, Chen, Franklin, Orskov and Shand1992).
The SAS MIXED procedure (version 9.2; SAS Institute, Cary, NC, USA) was used for statistical analysis (significance level, P<0.05). Respiration measurements were analysed as repeated measurements using the REPEATED statement for the day of measurement after the experimental phases commenced, using animal as subject. Different distances between measurements to day 1 were considered in an exponential spatial covariance structure. ANOVA was performed with treatment (α i), day of measurement after the experiment started (β j), and their interaction ((αβ)ij) as fixed effects and animal (γ k) as a random effect. Thus, the model was as follows: y ijkl=μ+α i+β j+(αβ)ij+γ k+e ijkl, with e ijkl as the residual.
A one-way ANOVA was performed for the balance data and daily BW gain, and treatment (α i) was factored as a fixed effect (all balance periods analysed separately). The model was as follows: y ij=μ+α i+e ij. Significant differences between treatments were compared using the t test.
Results
In Experiment 1, the concentrations of total and tannin phenols in the concentrates were (in g/kg DM) 2 and 2 (CON), 26 and 23 (CHE), and 15 and 13 (VAL), compared with 3 and 2 (CON), 42 and 37 (CHE), and 45 and 40 (VAL) for Experiment 2.
CH4 and CO2 release
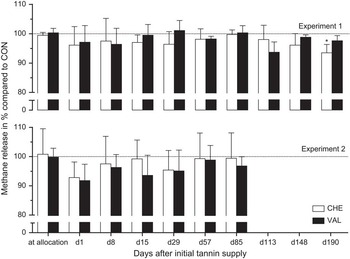
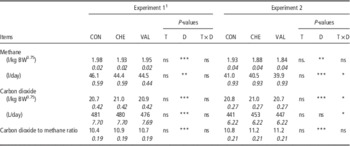
The release of methane per day ranged between 1.84 and 1.98 l/kg BW0.75 across both experiments, which was equivalent to 39.9 and 46.1 l/day (Table 2). No significant differences between treatments were detected. The release of CO2 ranged from 441 to 481 l/day, which was not influenced by tannin supplementation in either experiment. The average ratio of CO2 to methane was 10.7 in Experiment 1 and 11.1 in Experiment 2. With the exception of day 190 in Experiment 1 (P=0.045), no significant effect of tannins on methane release within individual respiration periods could be detected (Figure 1).
Methane release (means and s.d., based on L/kg BW0.75, related to CON=100%) for both experiments during experimental phase.
*significant (P<0.05) different to CON, statistical analysis within each measuring time.

Effects of supplementation of tannin-rich extracts on the release of methane and carbon dioxide in sheep (LSM and s.e. (in italic), analysed as repeated measurements)

CON=control; CHE=chestnut extract; VAL=valonea extract; T=treatment; D=day of respiration measurement.
1 Experiment 1: n=106, Experiment 2: n=72.
*P<0.05, **P<0.01, ***P<0.001, ns=non-significant (P>0.05).
Digestibility
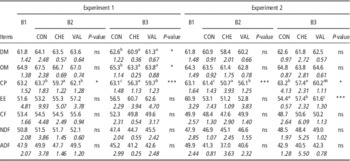
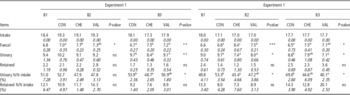
The DM digestibility ranged between 60.9% and 64.1% in Experiment 1 and 58.4% and 62.6% in Experiment 2 (Table 3). In comparison with CON, lower digestibility values of DM and organic matter (OM) were noted for CHE and VAL (P≤0.05) in period B3 of Experiment 1. In comparison with CON, the digestibility of CP in CHE was 4 and 7 percentage points lower in periods B2 and B3 of Experiment 1 (P<0.01) and 11 and 6 percentage points lower for B2 and B3 in Experiment 2 (P<0.05). Differences in CP digestibility between VAL and CON were observed in periods B3 of Experiment 1 and B2 of Experiment 2 (P<0.05). In both experiments, digestibility of EE and fibre fractions was not affected by tannin supplementation, with the exception that the digestibility of EE was increased by the addition of tannin-rich extracts in period B3 of Experiment 2 (P<0.001).
Effects of supplementation of tannin-rich extracts on digestibility of crude nutrients and fibre fractions in sheep (%, means and s.d. (in italic), n=4)

B1=balance No. 1 (pre-experimental period); B2=balance No. 2 (day 22 to day 27 after the start of tannin feeding); B3=balance No. 3 (Experiment 1: day 183 to day 188 after the start of tannin feeding; Experiment 2: day 78 to day 83 after the start of tannin feeding); CON=control; CHE=chestnut extract; VAL=valonea extract DM=dry matter; OM=organic matter; EE=ether extract; CF=crude fibre.
*P<0.05, ***P<0.001, ns=non-significant (P>0.05).
a–cMeans within one balance trial with different superscripts differ (P<0.05).
N balance
In both experiments, CHE supplementation produced higher faecal N excretion than CON (P<0.01) (Table 4). However, the effects of the addition of VAL were not consistent across both experiments. Increases in faecal N caused by VAL were observed in periods B3 of Experiment 1 (P<0.01) and B2 of Experiment 2 (7.5% and 13.6% (P<0.05), respectively, in comparison with CON). Tannin supplementation reduced the urinary N excretion in period B3 of Experiment 1 and during periods B2 and B3 of Experiment 2 (P<0.05). The retained N ranged between 1.2 and 3.6 g/day and was not different between treatments.
Effects of supplementation of tannin-rich extracts on nitrogen intake and excretion (g/d) in sheep (means and s.d. (in italic), n=4)

B1=balance No. 1 (pre-experimental period); B2=balance No. 2 (day 22 to day 27 after the start of tannin feeding); B3=balance No. 3 (Experiment 1: day 183 to day 188 after the start of tannin feeding; Experiment 2: day 78 to day 83 after the start of tannin feeding); CON=control; CHE=chestnut extract; VAL=valonea extract.
*P<0.05, **P<0.01, ***P<0.001, ns=non-significant (P>0.05).
a–cMeans within one balance trial with different superscripts differ (P<0.05).
Urinary excretion of purine derivatives and estimated microbial protein synthesis
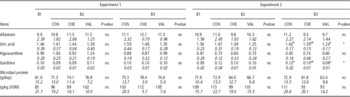
The urinary excretion of allantoin ranged from 9.0 to 12.1 mmol/day, and was not influenced by the addition of tannin-rich extracts (Table 5; P>0.05). The addition of VAL decreased the excretion of uric acid and xanthine compared with CON in period B3 of Experiment 2 (P<0.01). Other purine derivatives and total purine derivatives were not affected in either experiment. The estimated synthesis of microbial protein ranged from 61.0 to 78.4 g/day in Experiment 1 and 61.8 to 72.9 g/day in Experiment 2, and it was not significantly affected by tannin supplementation. The average efficiency of microbial protein synthesis was 96.9 and 104 g/kg digested organic matter (DOM) in Experiments 1 and 2, respectively, and did not differ between treatments.
Effects of supplementation of tannin-rich extracts on urinary excretion of purine derivatives (mmol/day) and estimated microbial protein synthesis in sheep (means and s.d. (in italic), n=4)

B1=balance No. 1 (pre-experimental period); B2=balance No. 2 (day 22 to day 27 after the start of tannin feeding); B3=balance No. 3 (Experiment 1: day 183 to day 188 after the start of tannin feeding; Experiment 2: day 78 to day 83 after the start of tannin feeding); CON=control; CHE=chestnut extract; VAL=valonea extract; DOM=digested organic matter.
*P<0.05, ns=non-significant (P>0.05).
a,bMeans within one balance trial with different superscripts differ (P<0.05).
Energy metabolism and daily BW gain
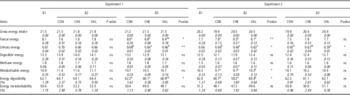
In Experiment 1, the addition of tannin-rich extracts did not alter faecal energy loss in B2 (Table 6; P=0.64). In period B3, CHE gave an increase of 7.5% in faecal energy output compared with CON (P<0.01), which was accompanied by a decrease in urinary energy excretion. Similar effects were seen in period B3 of Experiment 2. Addition of VAL also reduced the urinary energy in both balance periods of Experiment 2. No effects of tannins on methane energy were detected. In period B2 of Experiment 2, an increased ME intake for VAL was observed compared with CON (0.5 MJ ME/day; P<0.05), whereas this effect was not found in B3. Energy digestibility was decreased by tannin supplementation in B3 of Experiment 1 and B2 of Experiment 2, but energy metabolisability was unaffected by tannin supplementation in both experiments.
Effects of supplementation of tannin-rich extracts on energy loss (MJ/day) of sheep (means and s.d. (in italic), n=4)

B1=balance No. 1 (pre-experimental period); B2=balance No. 2 (day 22 to day 27 after the start of tannin feeding); B3=balance No. 3 (Experiment 1: day 183 to day 188 after the start of tannin feeding; Experiment 2: day 78 to day 83 after the start of tannin feeding); CON=control; CHE=chestnut extract; VAL=valonea extract.
*P<0.05, **P<0.01, ns=non-significant (P>0.05).
a,bMeans within one balance trial with different superscripts differ (P<0.05).
Daily BW gain ranged from 9.9 to 25.1 g/day in Experiment 1, without significant differences between treatments (data not shown). In Experiment 2, the daily BW gain for CON, CHE and VAL was 39.4, 43.2 and 58.0 g/day, which tended to be influenced by tannin supplementation (P=0.07).
Gas and methane production in vitro
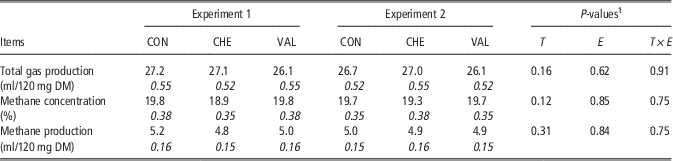
The average in vitro total gas and methane production was 26.7 and 5.0 ml/120 mg DM (Table 7). No treatment effects were detected.
In vitro total gas and methane production of concentrates in combination with hay (LSM and s.e. (in italic), at least n=7)

CON=control; CHE=chestnut extract; VAL=valonea extract; DM=dry matter.
1 Two-way ANOVA of Treatment (T: CON, CHE, VAL), Experiment (E: Experiment 1 or 2) and their interactions.
Discussion
It was hypothesised that the continuous supplementation of CHE and VAL extract would cause a permanent decrease in methane release. However, neither of the two tannin treatments at either level of supplementation (0.9 or 1.7 g/kg BW0.75 per day) significantly affected methane release from sheep, with the exception of CHE on day 190 of Experiment 1 (Figure 1). Based on the first results of Experiment 1 (i.e. the trend for reduced methane release after the onset of tannin-rich extract supplementation), we speculated that a higher dose of tannin-rich extracts administered in Experiment 2 would cause greater and longer-lasting effects. This was not the case; although the differences between the results of CON and tannin treatments were greatest immediately after the onset of tannin supplementation. Therefore, our initial hypothesis must be rejected.
The principal result of the present study confirms the findings of Beauchemin et al. (Reference Beauchemin, McGinn, Martinez and McAllister2007), who did not observe any reduction in methane release from growing cattle fed up to 1.8 g/kg BW0.75 of quebracho extract (content of CT: 91 g/kg) per day. The authors suggested that the tannin dose administered was not high enough to decrease methane release. Carulla et al. (Reference Carulla, Kreuzer, Machmüller and Hess2005) showed that methane release from lambs (25 kg BW) was reduced by up to 13% upon the addition of ~2.9 g/kg BW0.75 per day of an acacia extract (content of CT: 61.5 g/kg) to their diet. Methane release was measured on days 19 and 20 after starting supplementation; thus, it remains to be seen whether this effect can be retained over longer periods. In grazing dairy cattle, supplementation of up to 3.0 g/kg BW0.75 per day of an acacia extract caused a decrease in methane release (up to 28%), measured 2 and 5 weeks after supplementation was initiated and using the sulphur hexafluoride tracer gas technique (Grainger et al., Reference Grainger, Clarke, Auldist, Beauchemin, McGinn, Waghorn and Eckard2009). However, the authors concluded that the chosen level of supplementation was too high, because feed intake and milk yield were negatively affected.
Although not statistically significant, the differences in methane release between tannin treatments and CON were greatest immediately after the onset of the supplementation in both experiments (Figure 1). This may be an indication that rumen microbes are affected, but that they are able to adapt to the tannin-rich extracts. Indeed, tannins may directly inhibit methanogenic microorganisms (Tavendale et al., Reference Tavendale, Meagher, Pacheco, Walker, Attwood and Sivakumaran2005). Based on the development of methane release over time in the present study, it is assumed that the microbes adapted within about 2 weeks (Figure 1). Smith et al. (Reference Smith, Zoetendal and Mackie2005) listed strategies used by rumen bacteria to overcome the inhibitory effects of tannins, including the cleavage of HT and the salivary secretion of high-affine tannin binders. However, the complete ruminal degradation of both tannin extracts rich in HT has been suggested to be unlikely (Mueller-Harvey, Reference Mueller-Harvey2006). Higher tannin doses may have caused effects, but were not considered in the current experiments as they carry the risk of negative effects on feed consumption and animal performance (Hervás et al., Reference Hervás, Pérez, Giráldez, Mantecón, Almar and Frutos2003). Frutos et al. (Reference Frutos, Raso, Hervás, Mantecón, Pérez and Giráldez2004) demonstrated that feeding up to 1.4 g/kg BW0.75 of CHE extract (tannin content: 75 g/kg) caused neither histopathological nor other adverse effects on the performance of lambs. The maximum dose of 1.7 g/kg BW0.75 was chosen here also gave no indication of adverse effects.
In agreement with the experiments conducted with sheep, tannin-rich extracts did not reduce methane production in vitro when concentrates and hay used in Experiments 1 and 2 were incubated together (Table 7). Our hypothesis was that the in vitro experiment would lead to similar effects on methane production compared with effects on methane release obtained after starting feeding tannin-rich extracts to sheep. This hypothesis turned out to be not testable, because significant effects were not detected in sheep. In a previous study using the Hohenheim gas test (Wischer et al., Reference Wischer, Boguhn, Steingaß, Schollenberger and Rodehutscord2013), CHE and VAL extract showed a maximal potential to reduce methane without any effects on total gas production at 6 mg/120 mg substrate (14% and 17%, respectively). However, grass silage was used as the substrate in that study, which may have caused a different response compared with the present study.
Analytical recovery of the tannin phenols supplemented as extracts in the concentrates was incomplete. Based on analysis of the extracts, the recovery of phenols in the concentrates was between 50% and 82%. We could not identify a reason for this discrepancy. It is possible that the phenolic compounds were modified during feed processing, for example by the mixing or pelleting process. Furthermore, negative impacts during storage and sampling may have contributed to the incomplete recovery. It is also possible that during the pelleting process tannin formed complexes with other feed constituents, and that the method used for tannin-rich extraction was not able to extract the tannins completely from these complexes. However, the results confirmed that the tannin dosages were much higher in Experiment 2 than in Experiment 1 (1.6 times for CHE and 3.1 times for VAL instead of planned 2.0 times for both).
Zimmer and Cordesse (Reference Zimmer and Cordesse1996) reported a significant decline in the digestibility of DM and OM (by 5.6 and 5.9 percentage points, respectively) when sheep received hay and ~5.7 g/kg BW0.75 of CHE extract. However, in agreement with the present study, BW change and animal performance were not affected in their study. There is a commonly held view that feeding HT is associated with negative effects for the animals’ metabolism based on their toxicity compared with CT (Mueller-Harvey, Reference Mueller-Harvey2006). Treatment effects on digestibility were rare in the present study (apart from CP) indicating that feeding HT does not necessarily have negative effects. Furthermore, while Goel and Makkar (Reference Goel and Makkar2011) proposed that HT are more effective in decreasing methane release than CT, Mueller-Harvey (Reference Mueller-Harvey2006) suggested that the classification of tannins into CT and HT has not proved useful for predicting animal responses.
In the studies of Carulla et al. (Reference Carulla, Kreuzer, Machmüller and Hess2005) and Grainger et al. (Reference Grainger, Clarke, Auldist, Beauchemin, McGinn, Waghorn and Eckard2009), higher faecal N excretion and concomitantly lower urinary N excretion were observed without an effect on N retention. This was confirmed by the present study, in which the shift in N excretion was found in periods B2 and B3 for both experiments. This indicates that tannin–protein complexes were not completely dissociated in the small intestine, resulting in reduced CP digestibility (Beauchemin et al., Reference Beauchemin, McGinn, Martinez and McAllister2007), or that the location of OM digestion shifted towards the lower intestine, and more microbial protein was synthesised and subsequently excreted in the faeces. The higher faecal N excretion may originate from tannins forming complexes with protein originating from the diet, bacterial or intestinal tissue cells, and other endogenous constituents (Mueller-Harvey, Reference Mueller-Harvey2006). Alternatively, this may be due to inhibition of digestive enzymes or intestinal microorganisms (Mueller-Harvey, Reference Mueller-Harvey2006), as previously described.
A number of in vitro studies have indicated that tannin supplementation may improve the efficiency of microbial protein synthesis (Makkar et al., Reference Makkar, Blummel and Becker1995; Bhatta et al., Reference Bhatta, Krishnamoorthy and Mohammed2001). Makkar (Reference Makkar2003) suggested that low levels of tannins have the potential to modulate rumen fermentation towards increased microbial protein synthesis. In the present study, microbial protein synthesis was estimated from the urinary excretion of purine derivatives, and its mean efficiency was 96.9 and 104 g/kg DOM for Experiments 1 and 2, respectively. These findings are similar to those of Lima et al. (Reference Lima, Díaz, Castro and Fievez2011), who estimated that the microbial protein synthesis in sheep fed ensiled or fresh sorghum–soya bean forages was 99 and 143 g/kg effective rumen degradable OM, which can be recalculated figuring 94 and 137 g/kg DOM, respectively. The authors mentioned that in ensiled sorghum–soya bean forage the tannin content can be reduced due to the ensiling process. The present results indicate that microbial protein synthesis is unaffected by tannin supplementation due to the unchanged urinary excretion of allantoin. This is in good agreement with the study by Roth (Reference Roth2003), who fed ~0.4 and 0.7 g/kg BW0.75 of CHE extract to dairy cattle. In contrast, in the study of Carulla et al. (Reference Carulla, Kreuzer, Machmüller and Hess2005), the supplementation of 2.9 g/kg BW0.75 of acacia extract caused a decrease in allantoin excretion, indicating reduced microbial protein synthesis. Tannin dosages in the study of Carulla et al. (Reference Carulla, Kreuzer, Machmüller and Hess2005) and the present study may have been too high to improve the efficiency of microbial protein synthesis. Furthermore, it is possible that the influence of tannins on the efficiency of microbial protein synthesis depends on the composition of the respective tannin, or that estimation from the excretion of urinary purine derivatives is not a sufficiently sensitive method.
Based on the results of Carulla et al. (Reference Carulla, Kreuzer, Machmüller and Hess2005) and those of this study, it seems unlikely that tannin-rich extracts are able to reduce methane release without adverse effects on digestibility. Since higher tannin dosages may affect animal metabolism, further studies should include balance periods to examine the effects of tannins on digestibility, as well as energy and N metabolism.
Conclusions
The CHE and VAL extracts of the current study tended to affect rumen fermentation of sheep acutely, but without consequences for long-term methane release. Higher dosages of these tannin-rich extracts may reduce methane release; however, as the relatively low doses of Experiment 1 already reduced OM digestibility in the final experimental period, higher doses are likely to be accompanied by reduced digestibility. The extent to which negative tannin effects can be tolerated should be assessed in balance experiments examining energy and N metabolism. Moreover, since higher tannin dosages may affect feed intake, strategies should be established to overcome feed refusals.
Acknowledgement
The authors gratefully acknowledge support for this study from H. Wilhelm Schaumann Stiftung (Hamburg, Germany) through a doctoral scholarship awarded to G. Wischer.