


Members of the International Centre for Diffraction Data met during the week of 11 March 2013 for the Annual Spring Meetings. Members from 15 countries gathered, along with staff and guests, at ICDD Headquarters in Newtown Square, Pennsylvania. Here, they learned about ICDD's educational events, database and product developments over the past year, and reconnected with one another. Throughout the week, various committees, subcommittees, and task groups met for special-interest discussions.
All were in attendance for the plenary session, 12 March. This year's plenary featured three guest speakers. Robert Hart, of Phase Analytics in Western Australia, presented a talk titled, Applications of Diffraction in the West Australian Minerals Industry. Olivier Gourdon, Senior Scientific Editor for the International Centre for Diffraction Data, USA, spoke on Structure Analysis of Modulated and Composite Structures and Implementation in the ICDD Database. And, David Bish of Indiana University, Bloomington, Indiana, USA, presented a very timely discussion on The First X-ray Diffraction Results from Mars Science Laboratory. After the plenary session, members, staff, and guests were treated to a trip to Philadelphia's Franklin Institute for the Titanic: The Artifact Exhibition, showcasing more than 300 artifacts recovered from the ship's debris field. The exhibition takes visitors on a chronological journey through the life of the Titanic, from the building of the legend to life on board, and to its final demise.
The day concluded with a poster session and dinner reception at the Concordville Inn. A total of 28 posters were on display for members and guests to view. A first for this year, members were asked to vote on their favorite poster. The three posters receiving the most votes were then displayed at the ICDD Headquarters for the remainder of the Spring Meetings. The three posters voted best by ICDD members included: A Dynamic Metal-Organic Rotaxane Framework presented by V. Nicholas Vukotic of the University of Windsor, Ontario, Canada; X-Stripping with ME: An Improved Numerical Method to Deriving Monochromatic Datasets from Laboratory Polychromatic Diffractograms Based on Maximum Entropy, presented by Robert Papoular of Leon Brillouin Laboratory, France; and, Overview of NIST Thermoelectric Research, presented by W. Wong-Ng of the National Institute of Standards and Technology, Gaithersburg, MD.
The week's events concluded with the Annual Meeting of Members, 14 March. The following awards were presented:
ICDD's Board of Directors awarded Thomas Blanton the Distinguished Fellow Award. This award is given to a member who has given dedicated and meritorious service to the ICDD. Tom's involvement with the ICDD goes back to the 1990s. He has served and continues to serve in our most important leadership positions. Besides chairing a number of committees and subcommittees, he has held the following positions: Member-at-Large of the Board of Directors, 1992–1998 and 2004–2008, and Chairman of the Board of Directors 2008–2012. During his time as chairman, the ICDD has seen significant growth in the Powder Diffraction File. He is a member of the Denver X-ray Conference Organizing Committee and co-editor of Advances in X-ray Analysis. Tom has freely shared his knowledge and expertise over the last two decades, through his volunteer efforts within the ICDD, including as an instructor at the ICDD X-ray powder diffraction clinics and workshops. Tom is an internationally recognized scientist, an author of over 100 publications, and he has given his time for further developments at the ICDD.
The ICDD Board of Directors also chose to award two ICDD Fellows: Detlef Beckers and Shawn Yin. Dr Beckers has been a major contributor to the development of the PPXRD symposia series as a member of the organizing committee, and has participated in 10/11 PPXRD symposia, given 18 presentations and conducted several workshops. He is currently with PANalytical in the position of Market Segment Manager Pharmaceuticals: Food and Life Science. Dr Yin has also been intensely involved with PPXRD as an educator and instructor on materials analysis of pharmaceuticals and the use of diffraction techniques as a primary research tool. He is currently with Bristol-Myers Squibb as Principal Scientist and group leader of the Crystal Chemistry and Characterization group.
The award of Distinguished Grantee was awarded to Professor Xinkan Yao. This award recognizes exceptional contributions to the ICDD Grant-in-Aid Program. Since 2002, he has contributed over 557 patterns, primarily of “*” and “R” quality. A member since 1998, he is currently a Professor at Tianjin Institute of X-ray Analysis.
Sergei Kirik, of the Institute of Chemistry and Chemical Technology, Russian Academy of Sciences, was honored for his contributions to the Powder Diffraction File, contributing over 1000 patterns. Three other individuals have met this milestone, Don Hanawalt, Larry Calvert, and Shao-Fan Lin. Currently Dr Kirik has published 1185 references.
Full details of the ICDD meetings can be found at www.icdd.com.
Below, please find the abstracts submitted for the poster session. Further information about each abstract can be obtained by contacting the author whose name is underlined.
The Powder Diffraction File is the world's largest database for the structural characteristics of solid state materials. Since its founding in 1941, the PDF has been designed by ICDD's scientific membership and successive boards of directors to address the materials’ identification needs of the community. In 2006, 2009, and 2012, the ICDD conducted global surveys of material and analytical scientists working with diffraction methods (see Figure 3). The purpose of the surveys are to continuously evaluate user needs, and track analysis methods and trends, having the ultimate goal of producing databases and educational services that are custom developed for the international community.
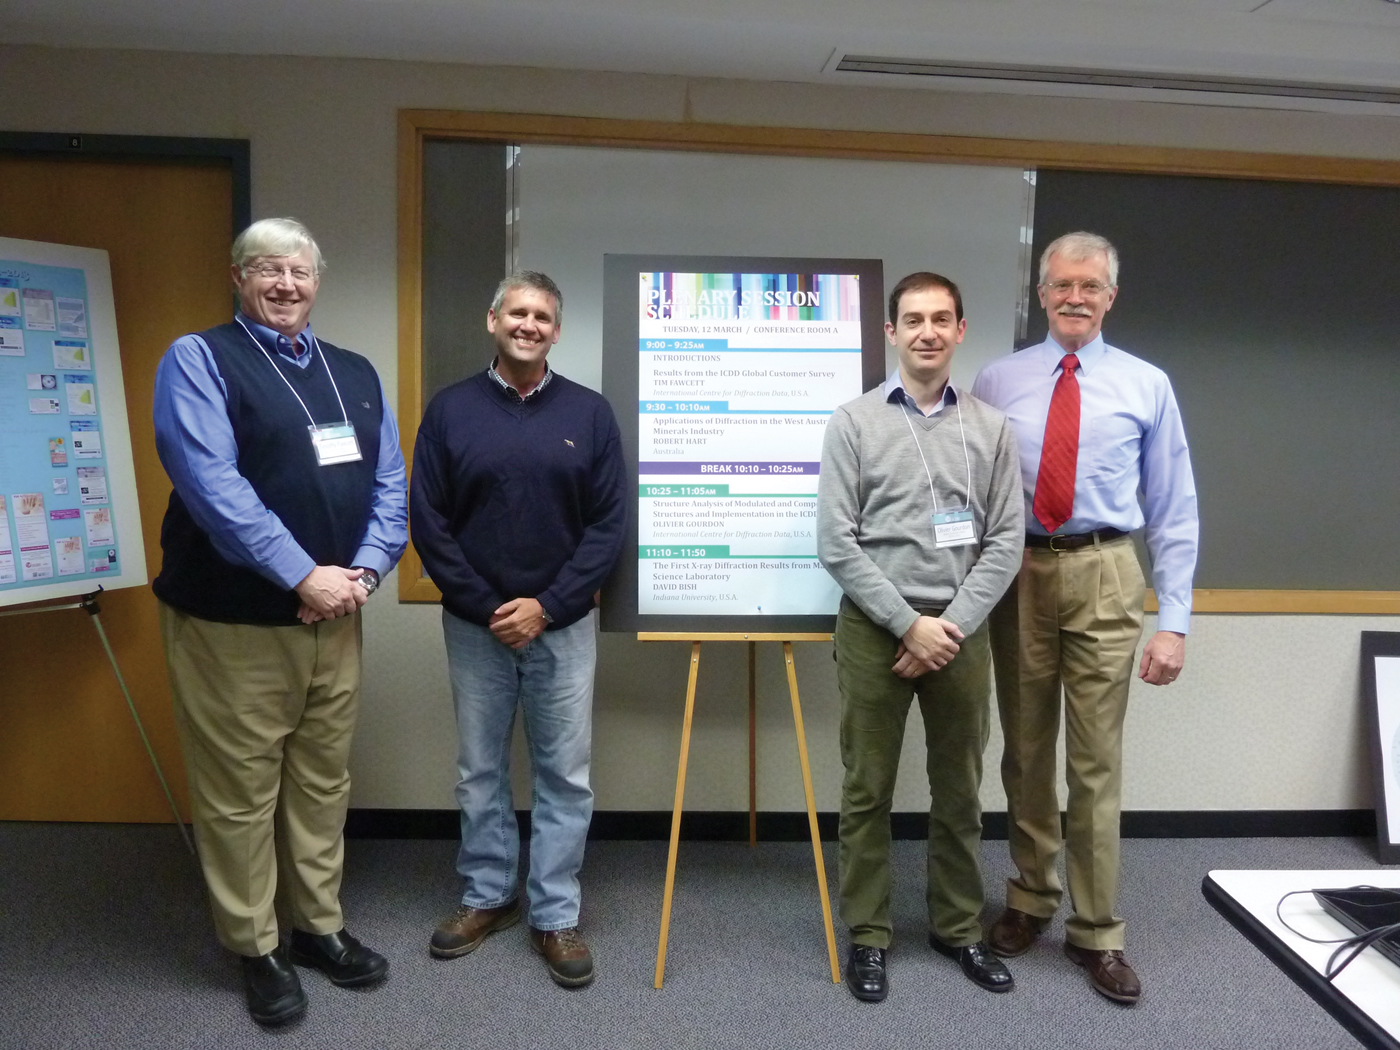
Plenary speakers (left to right): Timothy Fawcett, Robert Hart, Olivier Gourdon, and David L. Bish.
A scene from the technical poster session (left to right): Helen McDonnell, Gaciela Delgado, Larry Bernstein, and Miguel Delgado.

Global surveys of material and analytical scientists working with diffraction methods.

An excellent example of increasing trends is the global trend of materials development through the use of nanomaterials, advanced design, and nanoscale engineering of the solid state microstructure. In diffraction laboratories, this trend is being addressed by classical identification methods supplemented with crystallite size analyses (nano), crystallinity determinations, quantitative phase identification, and total pattern analysis methods, such as Rietveld and LeBail refinements. Each of these types of analyses has increased in global applications over the 2006–2012 survey period. Rietveld refinements that used to be specialty analyses are now annually performed in the majority of diffraction laboratories globally. The ICDD has responded to these customer needs by developing the PDF-4 database platform and developing educational modules for Rietveld analysis in classes, clinics, and education workshops around the globe.
In successive years of database development, the ICDD has added more I/I c values, atomic coordinate datasets, full digital calculated patterns, full digital experimental patterns of non-crystalline materials, amorphous references, pattern simulations, and crystallite size simulations to provide users with an array of reference tools and capabilities for nanomaterial analyses. By working with OEM's and software developers, our databases are deliberately interfaced with the world's most frequently used analysis software delivering both database and analysis capability to users in over 115 countries.
Here, we are reporting a new solid solution series (Sr1−xCax)ZrO3 (x = 0.2, 0.5, and 0.8), which has been synthesized by a solid-state technique and studied by X-ray powder diffraction study. This continuous solid solution crystallizes in the orthorhombic system with the Pbnm space group. The X-ray powder diffraction pattern of (Sr1−xCax)ZrO3 (x = 0.2, 0.5, and 0.8) shows the existence of both lines SrZrO3 and CaZrO3 compounds which are iso-structural to each other. For the (Sr0.8Ca0.2)ZrO3 compound shows the maximum matching with SrZrO3(Sr-rich phase) and for (Sr0.2Ca0.8)ZrO3 shows maximum matching with CaZrO3 composition (Ca-rich phase). However, the (Sr0.5Ca0.5)ZrO3 compound shows only the well-resolved strongest lines from both SrZrO3 and CaZrO3 compositions. At this composition of x = 0.5 strongest lines of both compositions overlap with each other and it was difficult to interpret them individually because of less deviations in angles of reflections (2θ positions) as compared with that observed for x = 0.2 and 0.8 composition. Moreover, it can be said that in (Sr0.5Ca0.5)ZrO3 crystal, Sr and Ca atoms occupied the same positions. We had also conducted the Rietveld refinement study for (Sr0.5Ca0.5)ZrO3 to confirm the existence of phases because of SrZrO3 and CaZrO3 compounds. This refinement was well fitted with that of the standard data file for SrZrO3 and CaZrO3 compounds. Rietveld refinement has given cell parameters a = 5.7820 Å, b = 5.6970 Å, and c = 8.1670 Å, and cell volume = 269.0230 Å3. From this it can be said that atoms occupy positions Sr (4c),Ca (4c), Zr (4b), O1(4c), and O2(8d). Refinement study also confirmed that the (Sr0.5Ca0.5)ZrO3 composition occupies Sr and Ca phases at same positions (4c) because of this they can easily interchange their positions with each other without disturbing the crystal symmetry. All the modes show a slight shift as a function of x. Change in the intensities, full-width at half-maxima, and band areas as a function of x is observed and attributed to the position of Sr and Ca in the same crystallographic site. Furthermore, the influence of crystal structure and photoluminescence properties of the (Sr1−xCax)ZrO3:0.05Eu3+ is studied, depending on x and Eu3+ = 0.05 contents. The emission peak (614 nm) from the 5D0 → 7F2 transition is much stronger than that (592 nm) from the 5D0 → 7F1 transition, indicating efficient red emission. The Ca2+ substitution for Sr2+ in Sr0.95ZrO3:0.05Eu3+ greatly enhances the excitation and emission intensity. The most efficient red emission is obtained for the Ca0.95ZrO3:0.05Eu phosphor.
The non-centrosymmetric structure of ScFeGe2O7 was investigated by X-ray powder diffraction measurements by Rietveld refinement performed in the GSAS and EXPGUI software. The sample presents a triclinic symmetry with a space group P1 (No. 1), a = 5.3434(8), b = 5.3145(8), c = 4.8732(7) Å, α = 99.468(2), β = 97.257(2), γ = 104.609(2)°, V = 130.03(5) Å3, Z = 1; wRp = 0.047, Rp = 0.04, and reduced χ2 was 2.176 for 64 variables. The framework of this phase is built up from corner-sharing of ScO6 and FeO6 octahedra forming a hexagonal disposition on layers interspersed with layers of Ge2O7 groups in staggered conformation. The arrangement described above, is related with the thortveitite structure. Other thortveitite-like layered structures crystalize in the monoclinic system, such as InFeGe2O7 (PDF 01-070-8447, ICSD-94487), S.G. C2/m (No. 12); TbInGe2O7 (PDF 01-072-6515, ICSD-96360), S.G. C2/c (No. 15); and YFeGe2O7 (PDF 01-072-6099, ICSD-95935), S.G. P21/m (No. 11). The group–subgroup relations among these structures including that of the lowest symmetry for ScFeGe2O7 are presented. Aspects such as the prediction of new phases by symmetry considerations, and the suggestion of models for the crystal structure will also be discussed. This study was sponsored by CONACyT project 167624.
We have placed a mechanically interlocked molecule (MIM) into the pores of a metal organic framework (MOF) designated as UWDM-1 (University of Windsor Dynamic Material).
UWDM-1 is constructed from a [2]rotaxane ligand in which the axle contributes to the rigid MOF skeleton, while the macrocycle functions as the soft dynamic component, capable of undergoing thermally controlled rapid rotation inside the material. UWDM-1 is characterized by single crystal and variable temperature powder X-ray diffraction, while the motion of the macrocyclic wheels is characterized by deuterium solid-state NMR. This poster will describe the synthesis and characterization of UWDM-1 (see Figure 4).
Synthesis and characterization of UWDM-1.

Simultaneous micro X-ray fluorescence and diffraction (μ-XRF and μ-XRD, respectively) have been used to characterize oil sands mineralogical tailings samples. Maps of elemental and crystalline phase composition can be used to correlate compositional and structural differences and provide an insight into the location of trace elements.
Stripping X-ray powder diffractograms from spurious overtones (e.g., Kα2 and Kβ lines) has been around for more than 50 years, since the pioneering work by W.A. Rachinger (1948 J. Sci. Instrum. 25, 254; 1983 Curr. Contents 42). Additional successful algorithms along these lines have been published more recently by Ladell et al. (1975 J. Appl. Cryst. 8, 499) followed by Dong et al. (1999 J. Appl. Cryst. 32, 168,) and by Ida & Toraya (2002 J. Appl. Cryst. 35, 58). More salient aspects are further detailed in the review by Langford & Louër (1996 Rep. Prog. Phys. 59, 131). The stake is enormous since it results in the ability to index even more complex powder diffractograms using the ubiquitous workhorses DICVOL, NTREOR, & ITO and possibly solve the associated crystallographic structures.
Our new method is quite general and may involve more than one or two overtones to be suppressed. It presents itself as a two-step procedure. During the first, one reference sample (e.g., SRM 676 [corundum]) is carefully measured and then Rietveld-refined yielding the 3 [U,V,W] Caglioti parameters describing the lineshape dependence versus the scattering angle θ for each one of the involved wavelengths. The point spread function (PSF) is then computed, which features as many Gaussian peaks as wavelengths. In a second step, maximum entropy (ME) is use to unfold the measured diffractogram from the PSF and the resulting unfolded spectrum is folded again with the lineshape pertaining to the uniquely wanted wavelength (i.e., Kα1) to produce a monochromatic X-stripped dataset. A side benefit resulting from this last folding is its noise-suppressing effect.
Our current default FORTRAN implementation of this strategy is called X-STRIPPER. It features the removal of both Kα2 and Kβ and aims at producing quasi-monochromatic Kα1 diffractograms. It also makes use of the Caglioti parameters [U,V,W] as defined in the GSAS XRPD package. In practice, the latter triplets are taken to be identical for the fundamental wavelength Kα1 and the remaining overtones even though they need not be. Our code runs within a few minutes on a PC laptop for diffractograms up to 9000 data points. We have successfully tested it using raw datasets obtained from our laboratory [Bruker AXS] D8 Advance diffractometer using a Bragg-Brentano geometry. Quite a few minerals [corundum, SiC, gypsum, aragonite, etc.] and one organic compound [Sorafenib Tosylate] with lattice symmetries ranging from hexagonal down to monoclinic were investigated and their respective unit cells were always found using either DICVOL06 and/or N-TREOR09. In the case of organics, the use of an appropriate sample-holder is mandatory to reduce spurious diffuse scattering and transparency effects to a minimum. Indeed, our entropic strategy may fail in the presence of the latter.
The authors are indebted to Prof. Daniel Louër for help and advice associated with the use of his Indexing Package DICVOL06, as well as for key suggestions regarding their experimental set-up. This work is dedicated to him.
Sorafenib Tosylate (ST) is an important pharmaceutical drug used in the treatment of hepatocellular and renal cell carcinomas. More specifically it presents itself as a PDF and VEGF receptor kinase inhibitor (PDGF/VEGF = platelet-derived/vascular endothelial growth factor).Reference Corey, Czako and Kurti1 Its crystal structure has recently been solved using single-crystal X-ray diffraction (SXD) and published.Reference Ravikumar, Sridhar, Bhujanga Rao and Pulla Reddy2 The molecular unit is made out of two separate ions and consists of 43 non-H atoms (Sorafenib = C21H17ClF3N4O3+ and Tosylate = C7H7O3S−).
The purpose of our X-ray powder diffraction (XRPD) study presented in this work is manifold: (1) To check how far can results be obtained using a laboratory X-ray polychromatic diffractometer using CuKα1/Kα2 radiation, such as our Bruker AXS Advance D8 diffractometer in Bragg-Brentano geometry (University of Ioannina), (2) to confirm whether an advanced high-resolution synchrotron powder diffraction synchrotron beamline such as 11-BM (APS/ANL) would allow us to crack our case, and (3) to compare the outcomes of three INDEX/SOLVE distinct strategies used for data analysis.
Regarding the latter, we have compared the three following paths: (1) Index with N-TREOR09/Solve with EXPO2009,Reference Altomare, Camalli, Cuocci, Giacovazzo, Moliterni and Rizzi3 (2) index with N-TREOR09/Solve with FOX,Reference Favre-Nicolin and Cerny4 and (3) index with DICVOLReference Boultif and Louër5/SOLVE with FOX and shall report on all our attempts.
Our conclusions include: (1) The ST unit cell can be found from the laboratory diffractogram, albeit marred with some ambiguity associated with the derived space group(s). (2) The latter ambiguity disappears when the better resolved synchrotron diffractogram is used. (3) Direct methods using EXPO2009 fail, but (4) simulated annealing (SA) using the latter software and a (double) flexible model obtained by molecular modeling solves it. (5) All our attempts to solve the ST crystal structure using FOX and SA have failed so far. (6) None of the employed analysis approaches here have resulted in a successful structure solution when starting with data from our laboratory powder XRD instrument. We find that high-resolution synchrotron data, like that measured at the APS beamline 11-BM, is still required for a successful structure solution of many pharmaceutical compounds using current analysis tools.
The authors thank Prof. Carmelo Giacovazzo (University of Bari, Italy) and his team for making his EXPO2009 software package available to them, and Prof. Daniel Louër (University of Rennes, France) for his help and advice regarding how to improve their laboratory experimental setup to measure organic compounds.
Use of the Advanced Photon Source at Argonne National Laboratory was supported by the U.S. Department of Energy, Office of Science, Office of Basic Energy Sciences, under contract no. DE-AC02-06CH11357.
Calcium (Ca) and phosphorus (P) are the central high Z elements of the bone mineral matrix. Ca is the body's most abundant cation, generally tied up in the mineral phase and partially released into the bloodstream via bone resorption. Similarly, 85% of phosphate concentration is present in the mineral phase. The co-dependence of Ca and P is a prerequisite factor for bone growth and development (R. Shapiro et al., 2003 Bone 32, 532–540) although their concentration does not vary mutually. Various hormonal and physicochemical factors affect their relative content which is critical for sustaining mineral homeostasis and bone metabolism. The Ca/P ratio is a promising biomarker for assessment of bone health (A.M. Coats et al., 2003 Calc. Tissue Int 73, 66–71), whereas, in clinical practice, DXA is physically unable to measure from relative mass variations. Furthermore, the Ca/P ratio has been also associated with rheumatoid arthritis and the generation of reactive oxygen species (1998 Calc. Tissue Int. 62, 193–198). Previous studies have also shown that the value and distribution of Ca/P ratio in bone varies between normal and osteoporotic bone (N. Kourkoumelis et al., 2012 J. Biol. Phys. 38, 279–291, 2012). Thus, it is of importance to carefully select the analytical techniques able to provide accurate relative Ca and P concentration measurements in bone tissue.
Energy dispersive X-ray spectroscopy (EDX) is a sensitive qualitative and semi-quantitative technique for evaluating the mineral content in microscopic regions of bone with spatial resolution of cubic micrometers. The analytical resolution depends on the incident beam energy, the critical excitation energy for the X-rays of interest, the atomic weight, the atomic number, and the density of the sample. Quantitative information is based on the relative elemental abundance. Micro-computed tomography (μ-CT) is an important tool for a wide range of research related to the biology of bone. High spatial resolution and high accuracy in the linear attenuation coefficients, allow different chemical components to be studied throughout the volume of either trabecular or cortical bones. A novel dual energy analysis (DEA) algorithm was developed to differentiate calcium, phosphate, and water which, as a first approximation, can be regarded as the major X-ray attenuators in bone.
Results show that Ca/P ratio values are positively related to induced bone loss, while cortical and trabecular bone exhibit a different correlation between Ca and P. The novel application of the DEA technique has managed to (i) accurately determine mass fractions of Ca, PO4, and H2O in phantoms, and (ii) trace Ca/P variations along the 3D bone structure.
Powder diffraction data are routinely stored in a variety of different file formats. A common problem, prior to any mathematical analysis, is the interconversion of such data between different formats. Simple vendor-neutral formats exist (e.g. 2θ versus intensity) but typically all software packages require files in which more information is included; for example, representative variables are the wavelength of the X-rays, instrumental parameters, sample ID, counting statistics, etc. embedded into a known (documented) or into an unknown (proprietary) format. As a result, software developers of powder diffraction applications need to re-write extensive source code for manipulation of input and output files.
PowDLL is a .NET assembly which offers a simple approach to the interconversion procedure between variable formats of powder diffraction files. The .NET framework (http://www.microsoft.com/net) is a development platform with a modern programming interface that provides Application Programming Interfaces (API) featuring language and architecture interoperability. PowDLL ver. 2.31 is able to handle 28 different formats either ASCII or binary. Each format has been programmed into its own private structure in accordance with the encapsulation concept of the object oriented programming making the assembly easy to use and expandable to future requirements.
The strong point of PowDLL is that it can be used in two ways: (i) as a standalone utility combined with the executable client provided by the author and (ii) as a reusable dynamic link library imported in any .NET language using the “PowDLL.PowderFileTypes” statement which is the fully qualified type name of the assembly. Another unique capability of PowDLL is the massive conversion of multiple file types in one step.
Recent developments include the ability to visualize, inspect, and compare powder diffraction datasets of different file formats simultaneously. The next main release (ver. 3.0) will be able to perform peak searching, background subtraction using four different methods (including one recently proposed by the author in: 2012 Nucl. Instrum. Methods Phys. Res. A 691, 1), smoothing using three different algorithms and multiple diagram manipulation like x-displacement, y-scaling, etc. A peak fitting module is also under development using the open source cross-platform numerical analysis and data processing library alglib (http://www.alglib.net/).
The source code of PowDLL is written in Visual Basic.NET, consists of more than 2000 lines of code and is freely available for academic or commercial use at http://users.uoi.gr/nkourkou/powdll.html
The classification of entries into various important subfiles is vital in enhancing the effectiveness of search/match using the Powder Diffraction File™ keeping in view the huge number of yearly additions to the database. The identification and assignment of subfiles are done in two ways: (i) manually, by the ICDD's editorial team and task group members, and (ii) semi-automatically by query-based assignment that compares entries with matching chemistry and similar crystallographic parameters (with a user-defined tolerance factor). New subfile entries are reviewed by various editors and task group members for consistency. This poster is a report on the subfile population in the upcoming 2013 release.
The PDF-4+ database is becoming progressively more popular among analysts performing quantitative phase analysis using the Rietveld method. The upcoming 2013 release of PDF-4+ will have 183 193 atomic coordinates out of 340 653 entries. To facilitate quantitative phase analysis using the Rietveld method, a new cross reference system has been implemented to map entries with no atomic coordinates to ones with atomic coordinates. In release 2013, we have identified and mapped 36 252 such entries increasing the total number of entries with available atomic coordinates to 219 445. When there is no crystal structure for a given phase, cross referencing has been implemented to relate to the compositionally closest phase. Finally, in responding to the requirements of the non-ambient diffraction community, a new cross referencing has been introduced that groups non-ambient temperature data for a given chemical composition. All these cross references will be discussed in the poster with examples.
For Release 2013, the ICDD has incorporated many new PDF-4 product developments that focus on intelligently linking data. The PDF-4 Release 2013 software will display PDF entries that are cross-linked to other entries as a part of a temperature series. Cross-referenced atomic coordinates are now automatically shown on PDF entries that do not contain atomic coordinates (but are cross-referenced to comparable entries that do). In addition, PDF entries now display a corresponding DOI (Digital Object Identifier) hyperlink, allowing the user “one-click” access to the pattern's primary reference page in a web browser.
Also, for Release 2013, many developments have been made to improve the graphing functionality of the PDF-4 software. The x-axis for all diffraction pattern graphs can now be plotted as d-spacing or Q (as an alternative to the existing 2θ and 1/d-spacing options). The y-axis for all diffraction pattern graphs can now be plotted as a logarithmic intensity (as an alternative to the existing linear intensity option). A dynamic difference plot has been added to SIeve + , which visually shows how well the identified phase(s) peaks match the user's experimental data. In addition, the user can now process plotted PD3 patterns by removing the background, smoothing, and stripping the Kα2 peaks, creating more flexibility when performing a pattern comparison. Linear and quadratic regression plots can now be displayed when plotting database fields for graphical analysis. Also, all graph exports have been upgraded to allow a higher quality resolution using PNG and TIFF format, making graph exports more publication-friendly.
Lastly, the PDF-4 software now incorporates the display of additional modulated structure information. New modulated structure tables such as displacive and/or occupational modulation terms have been added to the PDF entry display. In the eventuality that structural refinements required special functions such as occupational crenel functions or sawtooth functions to treat specific atomic displacements, these terms are also displayed. In the case of a composite structure, the W Matrix, which is used to connect the subsystems, is shown on the PDF entry display. Also, satellite reflections of modulated structures are now distinguished from the main reflections by being plotted as dotted lines on the graph.
These are just some of the many value-added developments designed to make the ICDD PDF-4 products more functional and powerful for 2013.
Modulated and composite crystal structures are fascinating crystal structures which “violate” the main idea that “perfect” crystal structures should possess a three-dimensional periodicity. However, the violations follow rules associated with the existence of periodic “modulation waves”. In that regard, they can be described as the three-dimensional hypersection of a four- or higher-dimensional periodic structure requiring additional mathematical tools to be described.Reference deWolff, Janssen and Janner1
In past few decades, several of these types of structures have attracted various scientists based on their unique physical properties. Indeed, the knowledge of these modulation waves is usually the key for understanding physical properties such as thermoelectricity, ferroelectricity, superconductivity, mineral formation, drug activity, etc. This strong interest by the scientific community in these classes of materials is clearly observed by the number of modulated structures being published.
ICDD is responding to the need of the scientific community by incorporating a significant number of modulated structures into the ICDD database this year. By incorporating almost 250 entries, ICDD will build the largest modulated structures database in the world.
This poster will present the tools developed in-house used to pursue this goal. In particular, we will emphasize the modifications performed on the DataQUACkER software to create a version suitable for import of modulated structures. This version of DataQUACkER, titled “ModQUACkER” has features specific to the unique properties of modulated structures. We will also present its input–output relation with JANA2006,Reference Petricek and Palatinus2 which is used to calculate the patterns as well as to validate the modulated crystal structure before entering it into the database.
Powder diffraction allows for rapid, non-destructive analysis of multi-component mixtures without extensive sample preparation. The most widespread use of powder diffraction is in the identification and characterization of crystalline solids, each of which produces a distinctive diffraction pattern. Both the positions and the relative intensity of the diffraction lines are indicative of a particular phase and material. A multi-phase mixture will result in superimposition of the patterns corresponding to the individual components. Identification is performed by comparison of the diffraction pattern to a known standard or to a database such as the International Centre for Diffraction Data's Powder Diffraction File (PDF) or the Cambridge Structural Database (CSD). The CSD now has almost 625 000 entries and the PDF has over 760 000 entries, thus when attempting to identify an unknown it is often useful to restrict the search to a subset of the database.
In this study, we will examine the explosives subcategory and probe the PDF with an in-house database containing only explosives and related compounds. The in-house database contains results from structural studies on ‘energetic materials’. Energetic materials include explosives, propellants, and pyrotechnics. The overlap of these two databases will be examined and the differences examined in detail. The utility of a simple test to classify materials will also be examined.
Thiocolchicoside is an active pharmaceutical ingredient (API) prescribed as a muscle relaxant. It also has anti-inflammatory and analgesic effects. In the Cambridge Structural Database, there is only one report related to this compound. It is for its ethanol solvate hydrate (Refcode: THCLCS). The ICDD PDF-4/Organics database contains its calculated powder diffraction pattern (entry: 02-073-3591). The powder diffraction pattern recorded for the raw material obtained from a pharmaceutical company does not match the pattern calculated using the single crystal data. The indexing of this pattern carried out with DICVOL06 led to an orthorhombic unit cell with a = 28.018(7) Å, b = 12.519(2) Å, c = 8.519(1) Å, V = 2988.01 Å3, M20 = 56.5, and F20 = 137.6 (0.0035, 42). In the search for possible polymorphs of this API, recrystallization studies under different conditions were carried out. Crystals in the form of irregular blocks were obtained from an aqueous solution in an oven at 37 °C, after 48 h. The powder pattern recorded for this phase indicated a different structure. The X-ray single crystal study concluded that these crystals correspond to a dihydrate phase which crystallizes in an orthorhombic unit cell with space group P212121, and a = 8.564(2) Å, b = 13 537 (3) Å, c = 25 303 (5) Å, and V = 2933.0 (2) A3. The powder diffraction pattern was indexed with good figure-of-merits (M20 = 47.3, F20 = 131.2 (0.0040, 38) in the same unit cell). The powder diffraction pattern obtained for these crystals, after heating them in an oven at 80 °C for 4 h, was totally different from those previously recorded. The results of these studies will be presented in this meeting.
In 2012, the International Centre for Diffraction Data (ICDD) changed publishers of the Powder Diffraction Journal (PDJ) to Cambridge University Press. We are excited to share some publishing statistics and developments from this past year with our new partner. There is no better time than now to subscribe to, write for, and advertise in PDJ! In addition to our regular articles, we look forward to bringing you the best from the Denver X-ray Conference, European Powder Diffraction Conference (EPDIC) proceedings, and select papers from the 11th National Conference on X-ray Diffraction held in Changchun, China.
The increased interest in research and development on thermoelectric materials in recent years is partly because of the soaring global energy demand. To help fulfill the NIST mission, a project entitled “Measurement, Standards and Data for Energy Conversion Materials” has been created in the Materials Measurement Science Division (formerly known as the Ceramics Division) in which thermoelectric research is a main component. The goal of this project is to address innovation in thermoelectric measurement technologies, measurement standards, and materials characterization. This project involves extensive international collaborations. Our current activities include development of standard reference materials (SRM™), measurement tools, methodology, and phase equilibrium and crystallographic data. We have recently completed the certification of a low-temperature Seebeck Coefficient standard (Bi2Te3). In the area of high-throughput combinatorial research for optimization of materials properties, we have developed a set of novel thermoelectric property screening tools. This paper summarizes our current efforts and future plan in the area of standard/metrology/data development of thermoelectric materials.
A list of the top 200 brand name pharmaceutical drugs, by 2011 US sales, is posted on the Internet.Footnote 1,Footnote 2 The active pharmaceutical ingredients (APIs) of 146 of the 200 top drugs are small molecules (total 147 APIs); whereas the rest are biological macromolecules and polymers. The PDF-4/Organics database (2013 release version) was searched to determine if the diffraction patterns of the small molecule APIs corresponding to the brand formulationsFootnote 3 were present. It was found that 63 APIs (and two liquid APIs at room temperature) of 147 do not have patterns in the PDF-4/Organics. For the other 82 APIs, a total of 252 patterns were found, including polymorphic forms and patterns at non-ambient conditions. Thirty-six APIs (24%) have one or more patterns with coordinates (31 APIs have room temperature coordinates which are more useful for phase identification). By quality mark, the 252 API patterns are distributed as follows: “I” 21%, “S” 32%, “R” 4%, “C” 2%, “B” 9%, and “O” 32%. ICDD is working toward collecting diffraction data at the beamline 11-BM, APS, Argonne National Laboratory for the missing APIs. The data will be analyzed to obtain coordinates whenever possible and the patterns will be prepared for the PDF-4/Organics product. At present, the first eight materials were obtained from commercial sources and submitted to the APS through a rapid access mail-in proposal. For these, three crystal structure determinations from powder diffraction data have been achieved, corresponding to risedronate sodium hemipentahydrate (API of Actonel from Warner-Chilcott), capecitabine (API of Xeloda from Roche), and levalbuterol hydrochloride (API of Xopenex from Sunovion).
The crystal structures of these compounds were reportedReference Titov, Belyanina, Markiv, Slobodyanik, Krayevska and Chumak1 in Immm, based on laboratory X-ray powder diffraction data. Our laboratory data indicated that the symmetry was lower, hence we collected synchrotron powder data at beam line 11-BM at the Advanced Photon Source at Argonne National Laboratory, to characterize the distortions from the reported structure.
These compounds crystallize in Pnma, with lattice parameters in the ranges: 5.722 < a < 5.724, 19.995 < b < 20.317, 5.708 < c < 5.770 Å, and 655.661 < V < 671.502 Å3. Although the lattice parameters increase with the size of the lanthanide cation, the increase is not linear. Although the metal atoms have a high-symmetry arrangement, the oxygen polyhedra are distorted and tilted from the arrangement originally reported. The Sc sites are 6-coordinate (octahedral), and are occupied only by Sc. The R sites are 7-coordinate (considering R–O distances <3.0 Å), except for Gd, which is 6-coordinate. For the larger lanthanides, both the Sr and R sites exhibit partial occupancy by the other large cation. As the lanthanide gets smaller, the site occupancies go closer to stoichiometric; in SrGd2Sc2O7 the site occupancies are all unity. The anisotropic strain broadening is more complex than can be described using the normal tensor model; conclusions about the microstructure will be discussed. A density-functional geometry optimization of the Gd compound yielded excellent agreement with the refined structure, and provides an insight into the bonding in these compounds.
Although lattice parameters have been reported for aliphatic dicarboxylic acids up to C46, the crystal structures have been reported only up to C12–13. Odd- and even-numbered acids have different structures, and the odd acids crystallize in two polymorphs. Availability of high-quality recrystallized materials has permitted preparation of an experimental powder pattern of β-azelaic acid (C9), and the determination of the crystal structure of β-brassylic acid (C13) using synchrotron data collected at 11-BM at APS. Both crystallize in C2/c (Table I):
Crystal structure data of β-brassylic acid (C13).

The room-temperature structures of the C14, C16, C18, and C20 diacids have been derived using density functional techniques, with lattice parameters determined by Le Bail fits of powder diffraction data. The initial structure models were derived by adding/subtracting methylene groups from the structures of the C12 and C18 diacids. Each structure contains centrosymmetric molecules in an all-trans configuration, and each molecule forms centrosymmetric hydrogen bonds. The chain packing corresponds to the O⊥ packing of hydrocarbon chains, but the interchain angles are larger than those in the structures of shorter dicarboxylic acids. Accordingly, some of the trends in lattice parameters with carbon number differ from those expected from shorter diacids.
The even-numbered acids crystallize in P21/c.

Continuing a systematic examination of the crystal structures of citrate salts, the structures of several Group 2 salts have been solved and refined using X-ray powder data, combined with density functional calculations. Several patterns were measured using the mail-in program at beam line 11-BM at the Advanced Photon Source at Argonne National Laboratory. New compounds to be presented include: Mg(H2C6H5O7)2, which crystallizes in P21/c with a=23.249 84(8), b = 10.977 78(3), c = 5.924 49(1) Å, β = 97.1860(2)°, V = 1500.241(8) Å3, and Z = 4. The structure was solved using direct methods as implemented in EXPO2009. Mg(HC6H5O7)(H2O)2 crystallizes in Pna21 with a = 26.911 59(14), b = 5.924 42(2), c = 6.151 70(2) Å, V = 980.800(7) Å3, and Z = 4. The structure was solved using Monte Carlo simulated annealing techniques as implemented in Endeavour 1.7. [Ca(H2C6H5O7)2(H2O)](H2O) crystallizes in P1 with a = 8.372 61(3), b = 10.903 06(4), c = 11.062 87(4) Å, α = 105.2026(4), β = 100.6846(4), γ = 110.7096(3)°, V = 867.2026(4) Å3, and Z = 2. This structure was also solved with direct methods in EXPO2009. Several more calcium citrates have been prepared as yet only in mixtures. A compound with the apparent stoichiometry Ba3(C6H5O7)2(H2O)6 crystallizes in P21/a with a = 11.4739(8), b = 13.7361(9), c = 15.0793(11) Å, β = 107.994(5)°, V = 2260.38(34) Å3, and Z = 4. The Ba positions are well defined, but it is proving difficult to refine the light atoms using only laboratory data.
Known structures include Mg3(C6H5O7)2(H2O)10 and Sr3(C6H5O7)2(H2O)5. The crystal structure of the mineral earlandite, Ca3(C6H5O7)2(H2O)4, has been reported recently, but its powder pattern does not correspond to that of commercial calcium citrate tetrahydrate sold as a calcium supplement.
A pattern has been collected for Ba3(C6H5O7)(H2O)7, PDF entry 00-001-0009; this entry is the only reference in the crystallographic literature to this compound. Only amorphous beryllium citrates have been prepared so far. SrCO3 does not react with citric acid at ambient or near-ambient conditions, so more-extreme reaction conditions will have to be used to prepare new strontium citrates.
The ICDD.COM website strives to meet the information and communication needs of ICDD members, customers, scholars, professionals, grant-in-aid participants, developers, and students. Nine months ago, the ICDD embraced social media networks – creating and nurturing Facebook, Twitter, LinkedIn, and Google+ profiles. Our goal is to engage people who might not seek out information on icdd.com regularly. This presentation will describe ICDD's social media evolution and how we plan to appeal to internet users in the future.
It has been reportedReference Ida and Izumi1 that the crystal structure of BaSO4 optimized by the application of maximum likelihood estimation (MLE) to powder diffraction data attached to a Rietveld program RIETANFP Reference Ida and Izumi1 goes closer to that obtained by a single-crystal method rather than the results of the Rietveld refinement applied to the same data, which is likely to be caused by the effect of particle statistics. In this study, we have investigated the effects of crystallite size and rotation of specimens upon the results of powder structure analysis of BaSO4 by the Rietveld and MLE methods.
Commercial BaSO4 powder was treated at 1030 °C for 5 h to prepare a powder sample with larger crystallite size. The particle sizes observed by scanning electron microscopy were about 1 µm and 50–100 µm for the untreated (1) and heat-treated (2) BaSO4 powder samples, respectively. The precession images of a particle picked up from sample 2 have shown that the particles in powder 2 can be regarded as single crystals. Powder diffraction data were collected with a laboratory X-ray diffractometer for stationary and rotating specimens of samples 1 and 2.
The powder diffraction intensity profiles observed for stationary and rotating specimens of sample 1 were both well reproduced by the Rietveld method with Rwp values of 9.1 and 8.0%, respectively, and applications of the MLE method have resulted in only small differences. The diffraction data of a rotating specimen of sample 2 have been fitted with Rwp value of 12.5% by the Rietveld method, and no significant change in the optimized structure has been found either on application of MLE. The diffraction data of a stationary specimen of sample 2 could not be fitted (Rwp ~ 41%) and a reasonable structure could not be derived by the Rietveld method, but the atomic coordinates optimized by the MLE method are in agreement with the single-crystal results almost within estimated statistical errors.
It has been proposedReference Ida, Goto and Hibino1 that the effective crystallite diameter of micrometer order in powder samples can be estimated by a spinner-scan method with a powder X-ray diffractometer. In this study, the method is applied to evaluation of crystallite size in sintered bodies of polycrystalline NaCl.
Pulverized NaCl powder passed through a 20 µm-mesh sieve was divided and uniaxially pressed at 17 MPa to form disks 25 mm in diameter. Four disk samples were sintered under different conditions; disk 1: 585 °C for 2 h, disk 2: 585 °C for 4 h, disk 3: 640 °C for 2 h, and disk 4: 640 °C for 10 h. Effective particle size was estimated from the diameters of circles with equivalent areas to SEM-COMPO particle images of each sample. The spinner-scan intensity data of ten significant diffraction peaks of NaCl were collected with a laboratory X-ray diffractometer. The effective diameter of crystallites was calculated by analysis of the spinner-scan data, and calibrated by the analytical results of a standard Si powder (NIST SRM640c) with known effective diameter of 5.6 µm.Reference Ida, Goto and Hibino1
The effective particle sizes have been estimated at 7.8, 8.3, 13.1, and 22.4 µm for disks 1, 2, 3, and 4, respectively, by SEM image analysis. The effective number of diffracting crystallites n eff evaluated for each powder diffraction peak has shown similarity to m eff/sin θ, where m eff is the effective multiplicity of reflection and θ the Bragg angle, as predicted by the theory for particle statistics. The weighted average values of the effective crystallite diameters estimated for ten diffraction peaks of NaCl are 6.3(3), 6.7(3), 9.4(3), and 12.5(5) µm for disks 1, 2, 3, and 4, respectively. Both the results of SEM and spinner-scan analysis are consistent with the promotion of crystal growth at higher temperature and longer period of heat treatment. It is suggested that the difference between the two methods is caused by missing some grain boundaries with low contrasts in dense coagulates on extraction of particle images from SEM data.
Error in quantitative phase analysis by the multi-phase Rietveld method is a serious problem that still remains in the methodology of powder X-ray diffractometry. The diffraction from highly absorbing component shows lower intensity than expected, in the case of coarse crystallites. This tendency is recognized to be caused by “micro-absorption effect”, which can be ascribed to reduction of diffraction intensity owing to absorption of each crystalliteReference Ida, Goto and Hibino1. In this study, we have experimentally investigated the effects of crystallite size and absorption upon the results of quantitative analysis.
Two-component powder mixtures of commercial LiF (1), and pulverized α-quartz (2, 3) and KCl (4, 5) were prepared. The effective crystallite diameters estimated by scanning electron microscopy and a spinner-scan methodReference Taylor and Matulis2, Reference Ida, Goto and Hibino3 were 2.5, 7, 22, 16, and 21 µm for components 1, 2, 3, 4, and 5, respectively. The powder diffraction intensity data of 1:1 weight fraction mixtures A(1/2), B(1/3), C(2/4), and D(3/5) were collected for flat specimens with a laboratory CuKα (1.54 Å) X-ray diffractometer and for 0.5 mmφ capillary specimens with a synchrotron (1.196 Å) powder diffractometer on the KEK-PF BL-4B2 beamline. The linear absorption coefficients of LiF, quartz, and KCl are 30.8, 95.0, and 251 cm−1 for laboratory CuKα, and 13.1, 42.8, and 120 cm−1 for the 1.196 Å synchrotron X-ray, respectively.
The weight fractions of quartz in the mixtures A, B, C, and D calculated from the scale factors in the Rietveld refinements have been estimated at 0.509, 0.512, 0.518, and 0.697 from laboratory data, and 0.503, 0.387, 0.541, and 0.446 from synchrotron data, respectively. The deviations could hardly be corrected by the Taylor–Matulis method, particularly in the case of synchrotron data of mixture D, which shows a tendency contradictory to that expected for micro-absorption effect.
The ICDD is expanding the high-quality materials found in PDF-4/Organics by adding approximately 5000 targeted single-crystal materials yearly including, but not limited to, materials that have pharmaceutical and/or bioactive characteristics. These materials will go through the same enhanced quality system that PDF customers expect. In addition to these new entries, ICDD continues to abstract and add approximately 4000 atomic coordinates yearly to historically published patterns to make their usefulness in quantitative analysis and data mining even better.
Currently, the Powder Diffraction File (PDF-4) Organics product contains over 350 000 entries of organic compounds that are not located in a specified subfile. Subfile classifications are extremely beneficial for PDF-4 users as they allow a convenient method of filtering through the vast number of reference patterns during the search/match process. The “Trade names Project” was developed with the idea to classify many of these unspecified organic materials into appropriate subfiles; placing specific interest on pharmaceutical and bioactive materials. Since their time of initial publication in PDF-4, various compounds have acquired trade names and are now commercially available drugs. However, the updates of these compounds have not been regularly documented to indicate any status changes of the drugs, side effects, or any new bioactivity findings. Therefore, over the past several months, we have been sifting through the historical organic data, researching the materials, locating and including trade name information, as well as other pertinent information such as CAS numbers, compound bioactivity, and any updates about the exclusion of these materials from US distribution. At this stage, our objective is to properly populate the “PHR” and “BIA” subfiles, but as we are also reviewing all of the compounds we will also use this project to determine whether other subfiles should be added that would enhance the effectiveness of the PDF-4 Organics (i.e. pesticides, insecticides, etc.).
Bi2NaCaNb3O12 (BCNN) is an Aurivillius phase with [Bi2O2]2+ sheets interleaved among perovskite-like blocks. Topochemical conversion to the protonated form may be achieved using simple acid treatment, and subsequent exfoliation into nanosheet suspensions is also possible. The XRD data for protonated BCNN shows two subtle features: anisotropic hkl-dependent peak broadening and shifts from the expected peak positions, especially at high angle. Both characteristics of the XRD pattern suggest disorder in the protonated form, either from stacking faults or topotactic stacking features. Multiple models were used in an attempt to correctly model the XRD data. Of these, only models which allow incommensurate shifts in the a–b-plane of the perovskite sheets can successfully model the data.
Modeling was undertaken using the software TOPAS (Bruker-AXS) and supercells along the c-axis with rigid bodies representing the perovskite sheets. Supercells of 2, 4, 6, 8, 12, 18, and 36 layers were tested, with improved fitting achieved on reaching 12 layers and the finer details better modeled using 18 or 36 layers. Optimized models show that the interlayer shifts between successive perovskite blocks are centered on the expected commensurate value (0.25 along a- and b-axes) but with a broad distribution. Similarly, the interlayer spacings show a broad distribution, ranging from 1.80 to 4.13 Å, not only with an average value of 2.37(53) Å with 1 H2O per formula unit but also with wide distribution.


