Introduction
The buffalo species is used in several countries for milk and mozzarella cheese production and breeding programs have therefore used milk production as the main selection criterion (Aspilcueta-Borquis et al., Reference Aspilcueta-Borquis, Araújo Neto, Baldi, Bignard and Albuquerque2010). Although rarely evaluated in dairy animals, there has been increasing interest in assessing the association between growth traits and selection criteria frequently applied in dairy programs (Coffey et al., Reference Coffey, Hickey and Brotherstone2006; Brotherstone et al., Reference Brotherstone, Coffey and Banos2007; Van De Stroet et al., Reference Van De Stroet, Díaz, Stalder, Heinrichs and Dechow2016).
Animal growth can be expressed in numerical terms and quantitative analyses can be performed. These analyses include growth curves that relate the animal's body weight to age through mathematical models (Marinho et al., Reference Marinho, Freitas, Falcão and Dias2013; Behzadi et al., Reference Behzadi, Aslaminejad, Sharifi and Simianer2014). The livestock growth curve exhibits allometric features resulting from factors such as species, management, feeding and environmental conditions. The growth curve can be quantified more accurately using nonlinear models to synthesize the data over a given time interval for a group of animals in a given physiological state. These data are summarized in a small set of mathematical parameters that can be interpreted biologically (Lopes et al., Reference Lopes, Silva, Marques and McManus2012; Teleken et al., Reference Teleken, Galvão and Robazza2017). Many studies have applied nonlinear models to different species, but few have investigated buffaloes (Agudelo-Gómez et al., Reference Agudelo-Gómez, Hurtado-Lugo and Cerón-Muñoz2009). In this respect, the understanding of the relationship between the coefficients of nonlinear models can be useful for the strategic planning of selection programs for economic traits in buffaloes.
Therefore, the aim of this study was to more accurately estimate growth curve parameters in buffalo cows by evaluating and selecting nonlinear mixed models that employ different types of residuals and include or not contemporary groups (CG) as a covariate.
Materials and methods
Weight records of buffalo cows belonging to the Tapuio Farm were used. This farm participates in the milk control program promoted by the Paulista State University, Jaboticabal Campus and is located in the municipality of Tapuio, Rio Grande do Norte State, Brazil (5°33′57.13″ S latitude and 35°37′37.98″ W longitude). The main activity of the Tapuio Farm is the production of mozzarella cheese. The animals are managed in a Voisin rational pasture system, with daily grazing in paddocks of 0.8 ha formed by Marandu grass (Urochloa brizantha cv. Marandu) and Massai grass (Panicum maximum cv. Massai). The region is characterized by an average annual rainfall of 866.4 mm and average annual temperature of 28°C.
The growth curves were estimated by three nonlinear mixed models (Gompertz, Bertalanffy and Logistic) (Table 1) based on monthly weight recording (up to 60 months), with weight being considered an independent variable. To fit the data to the effects of year and season of birth, the CG were formed by the concatenation of these variables.
Description of nonlinear functions used in the growth curve modelling of buffalo cows

A, b and k represents the estimate of asymptotic weight, integration constant (related to the initial weights of animals) and the maturity rate, respectively; IGR, instantaneous growth rate.
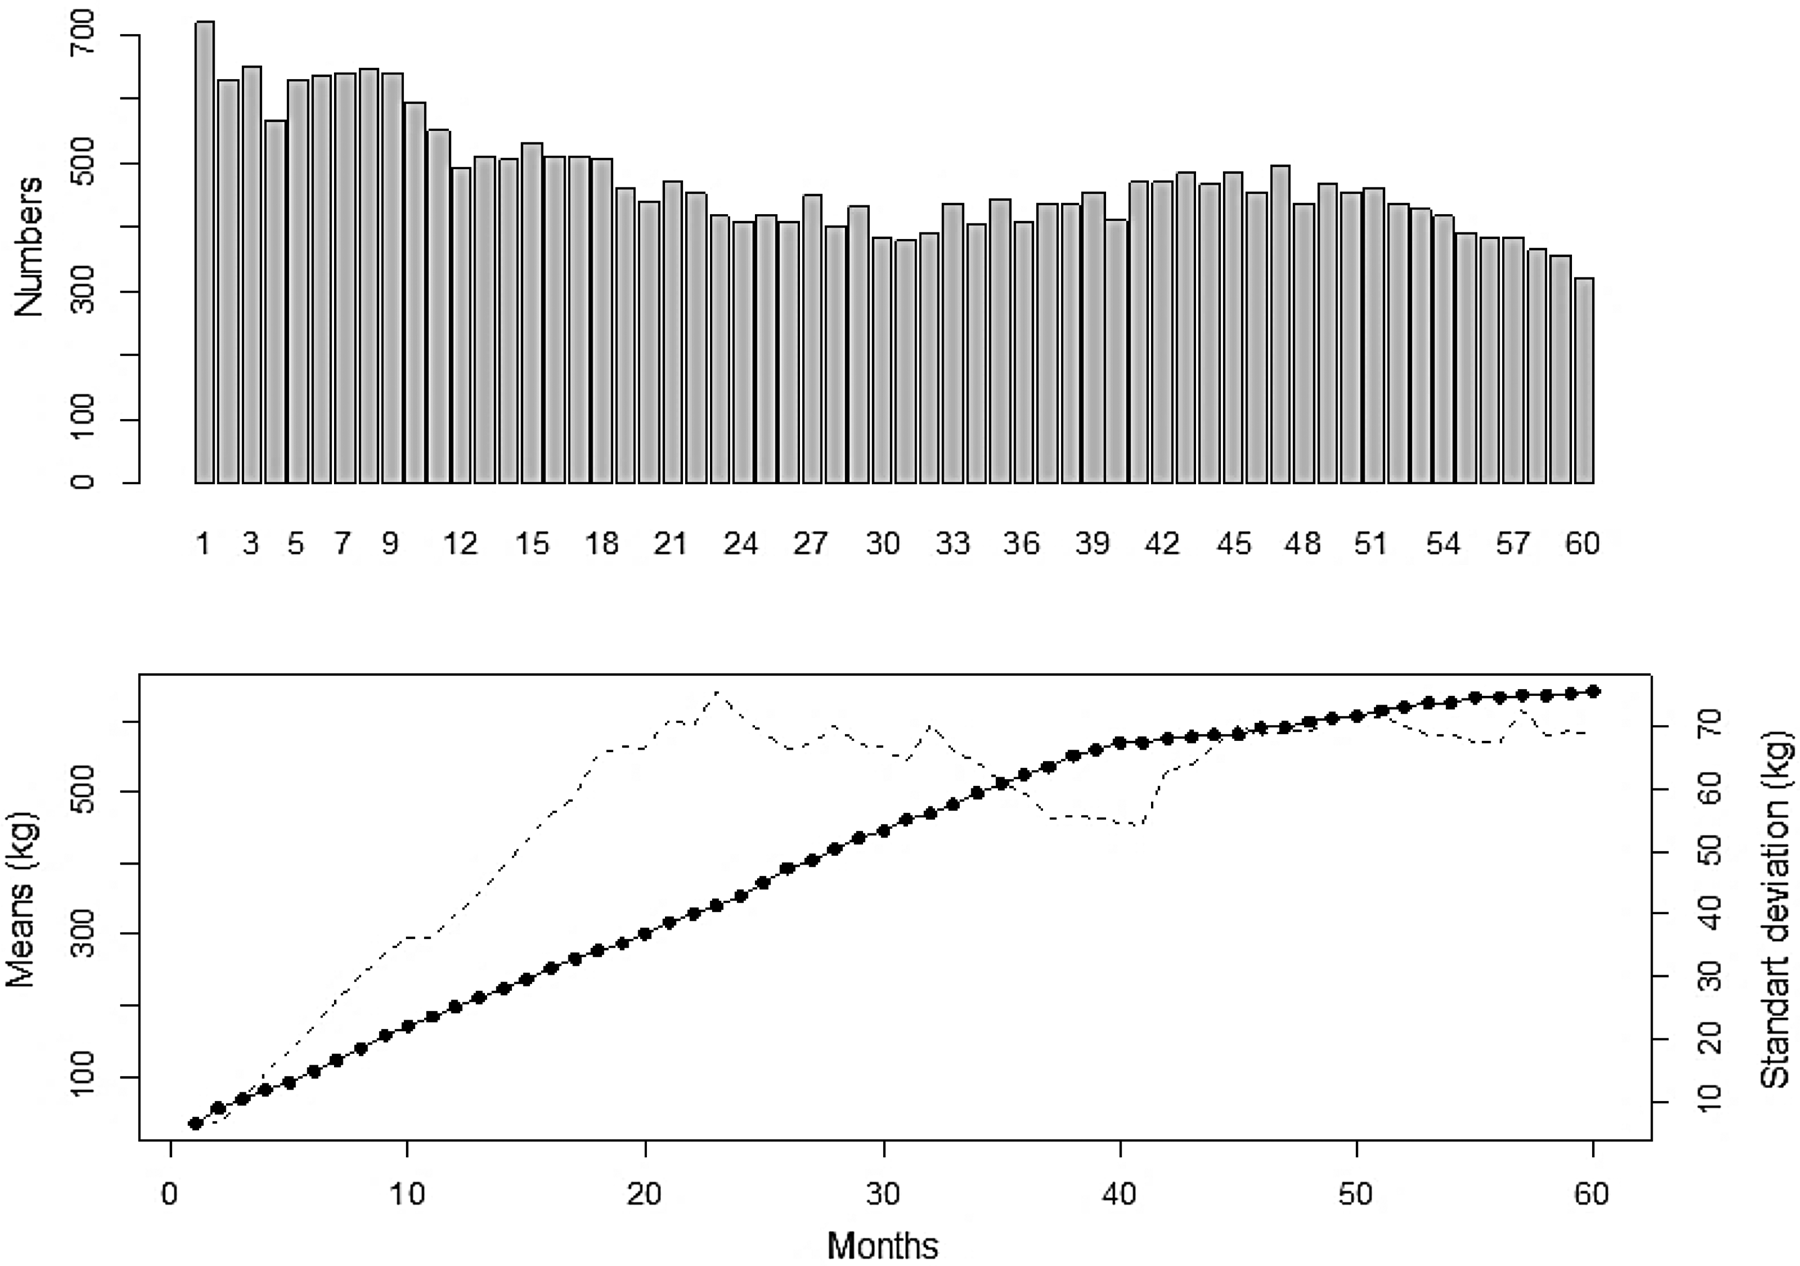
The following preliminary consistency procedures were performed: (a) elimination of animals not weighed in the first month; (b) elimination of animals with fewer than 10 records; (c) elimination of animals younger than 50 months; (d) elimination of CG with fewer than 10 animals and (e) elimination of outliers within the CG and age group. This resulted in a database with 720 animals and 28 429 weight records (Fig. 1).
Number of records (bars), mean (solid line with solid circles) and standard deviation (dashed line) of the monthly weightings used in growth curve modelling of buffalo cows.

The following assumptions of the nonlinear mixed model were considered:


where y ij is the j th reference observation of the i th animal; f is a nonlinear growth function; ψ i is the vector of individual parameters; x ij is the dependent variable (months); g is the residue function of the model; H is the function that describes the covariate model; ci is a vector of known covariates; μ and π i are fixed and random unknown vectors of the parameters, respectively; ɛij is the residual and γ is the vector of parameters related to the residual variance structure used.
The parameters of the nonlinear mixed models were estimated using the Saemix package (Comets et al., Reference Comets, Lavenu and Lavielle2017), in which the EM algorithm with a stochastic approximation is implemented, as proposed by Kuhn and Lavielle (Reference Kuhn and Lavielle2005). The Saemix package uses the following residual variance structures: (a) constant; (b) proportional; (c) combined; and (d) exponential.
The Akaike information criterion (AIC) proposed by Akaike (Reference Akaike1974) and the Bayesian information criterion (BIC) proposed by Schwarz (Reference Schwarz1978) were used to compare the models:


where P is the total number of parameters to be estimated; N represents the number of individuals, as modified by Kass and Raftery (Reference Kass and Raftery1995) for mixed models; $l_M\lpar {y\semicolon \;\hat{\theta }} \rpar$ denotes the likelihood function, here considering the approximation method by linearization. After the definition of the nonlinear mixed model with the best goodness-of-fit, the inflection points (IP) and the instantaneous growth rate (IGR) were also calculated (Table 1). All analyses were carried out using the R Core Team (2018) software, version 3.5.1.
Results
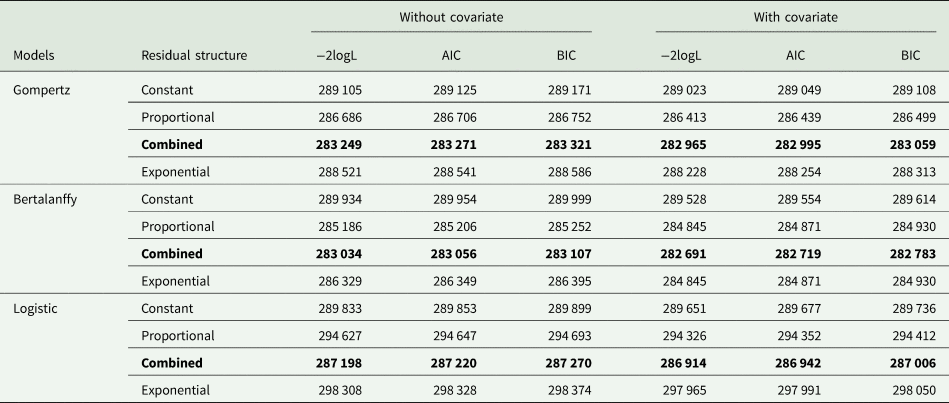
In general, the combined residual variance structure with or without the inclusion of CG as covariate provided a better fit to the growth curve of female buffaloes, resulting in lower AIC and BIC values (Table 2). The same trend was observed when the covariate CG was included, which provided the best fits regardless of the type of residual variance structure or growth function.
Estimates of Akaike information criterion (AIC) and Bayesian information criterion (BIC) for nonlinear mixed models using different residual structures and covariate (bold characters indicate the lowest AIC and BIC values for each model)
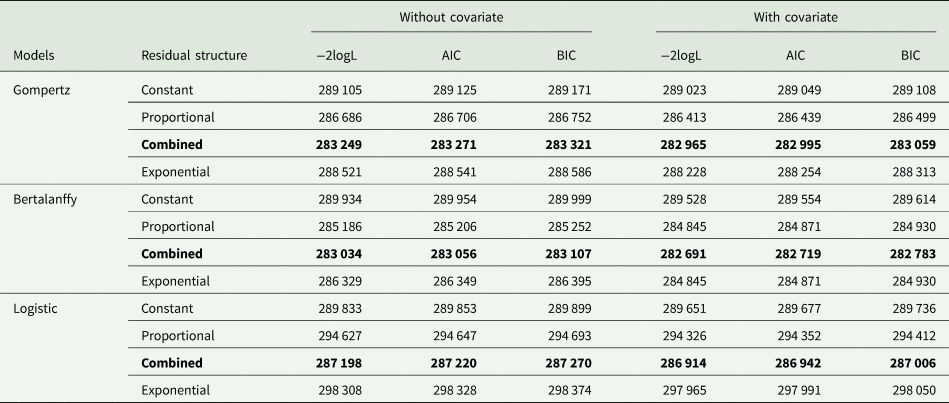
The combined residual structure was followed by the exponential, proportional and constant structure when applied to the Gompertz model, independent of whether or not CG was included as a covariate. However, there was an interaction effect between the residual variance structure and covariate for the other growth functions. For the Bertalanffy model, the combined structure was followed by proportional, exponential and constant when CG was not included. However, when CG was included, the exponential and proportional residual variance structures provided similar results, followed by the constant structure. For the Logistic function, the combined residual structure was followed by the exponential, constant and proportional without CG, and by the constant, proportional and exponential with CG. In summary, the Bertalanffy model with a combined residual variance structure and CG provided the best fit to the growth curve of female buffaloes.
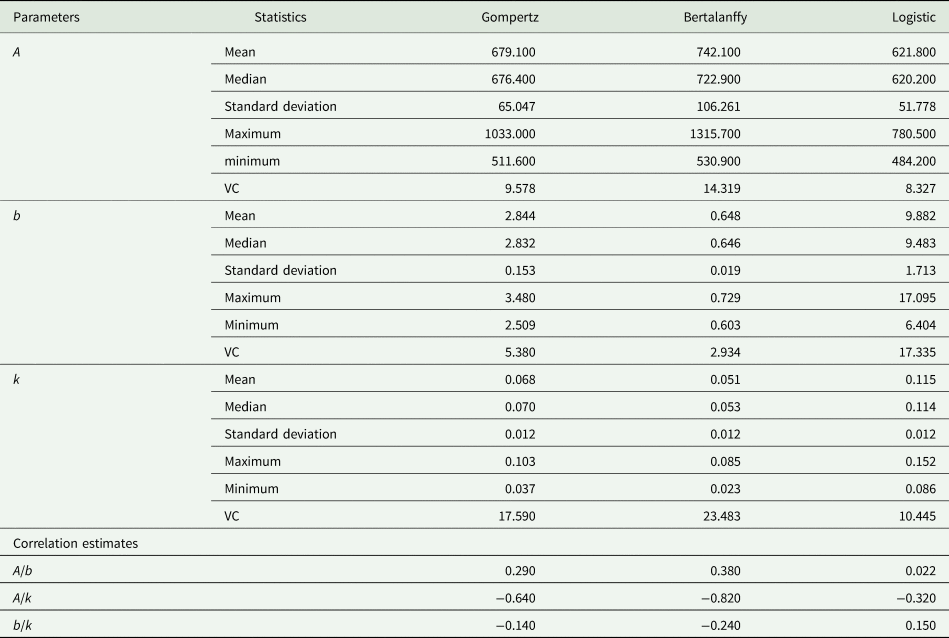
Regarding the parameters estimated using the models with a combined residual variance structure (Table 3), the highest asymptotic weight (A) was estimated with the Bertalanffy model compared to the other models (Gompertz and Logistic, in that order). The opposite trend was observed for the integration constant (b). In addition, the behaviour of the standard deviation (SD) values and the variation coefficient (VC) of A and b are identical to those described above. The highest maturation rate (k) was obtained with the Logistic function, followed by the Gompertz and Bertalanffy functions. However, the SD showed equal values among all models; and the VC was higher for k estimated by the Bertalanffy model, followed by the Gompertz and Logistic.
Parameters estimates of Gompertz, Bertalanffy and Logistic functions in mixed nonlinear models considering the contemporary groups (CG) inclusion and combined residual structure
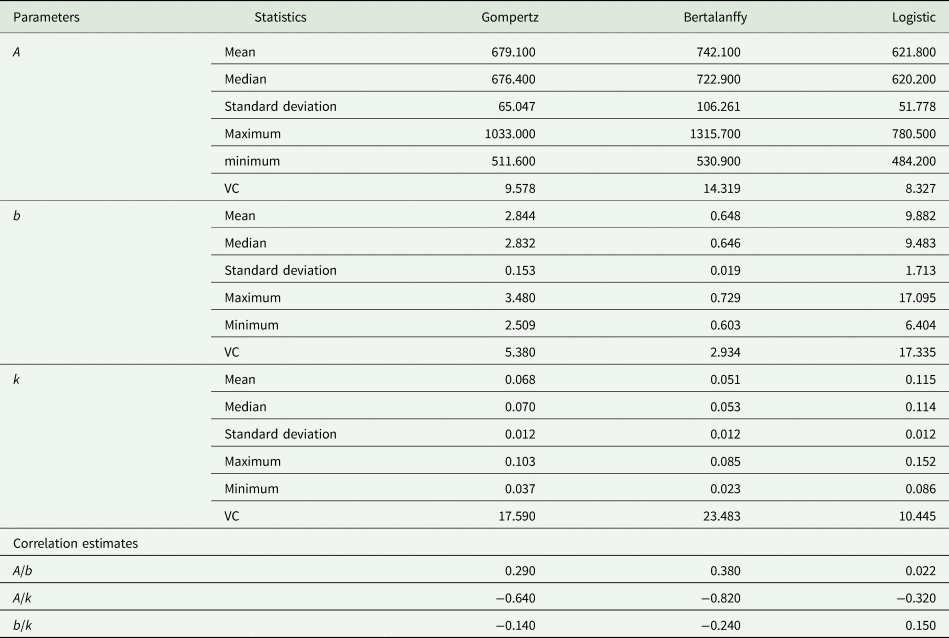
A, asymptotic weight; b, integration constant; k, maturity rate; VC, variation coefficient.
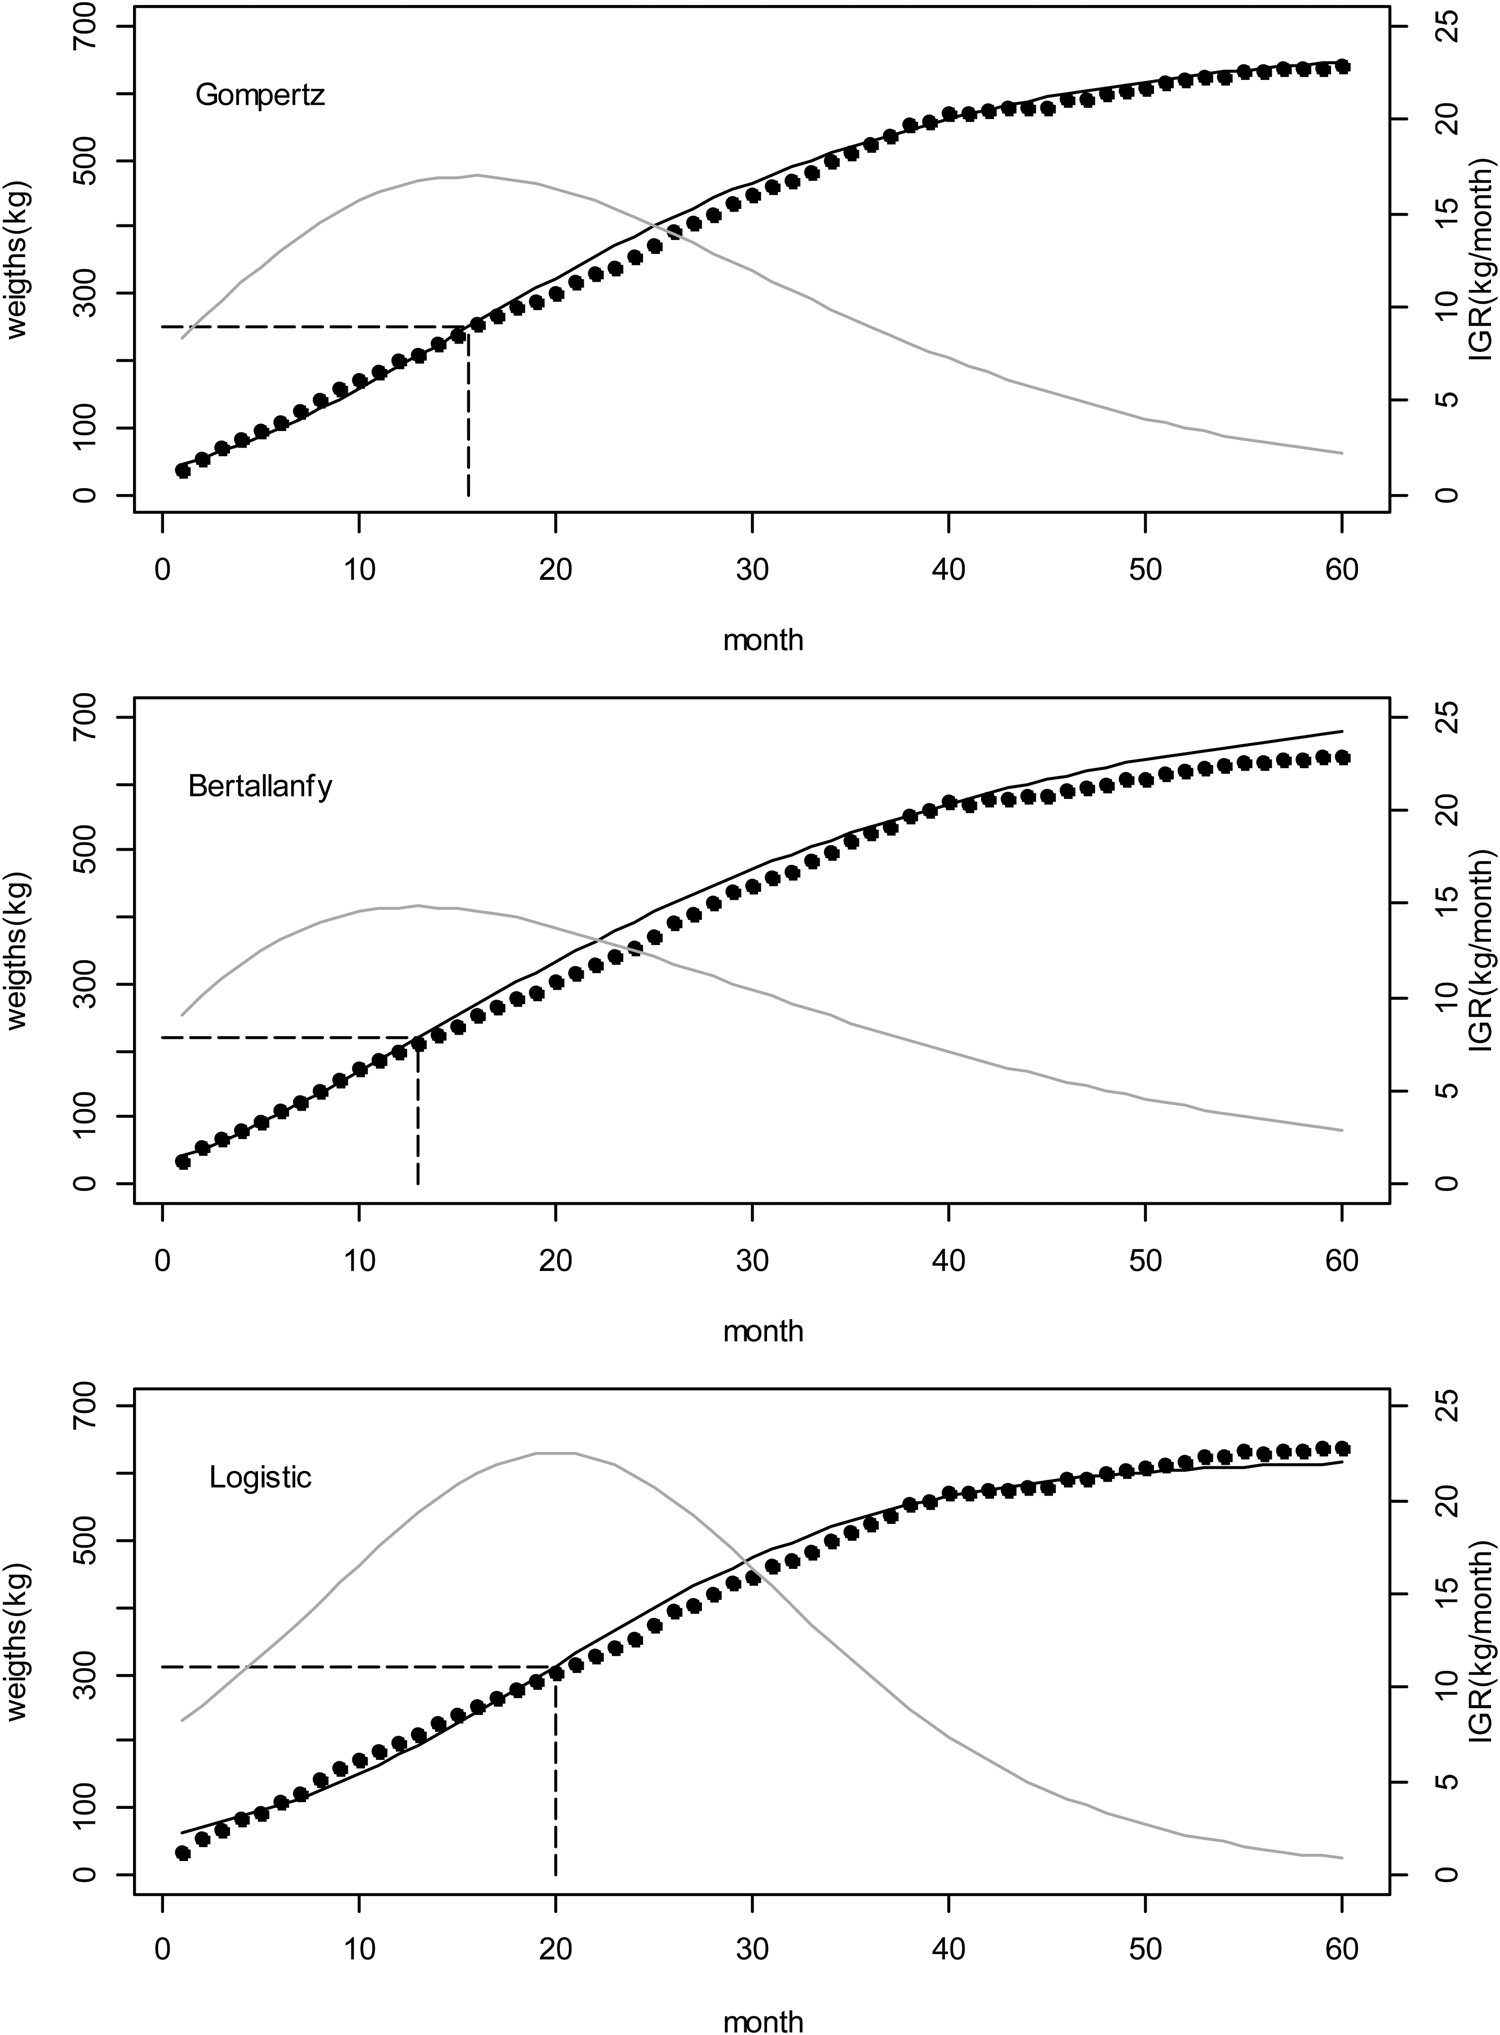
Considering the correlations between parameters, the lowest estimates were found for the Logistic model, followed by the Gompertz and Bertalanffy models. Only the association between A and b was synergistic, while all associations with k were antagonistic (except for b and k for the Logistic model). With respect to IGR (Fig. 2), the Gompertz, Bertalanffy and Logistic models showed similar trends, with initial rates of 8.409, 9.107 and 8.255 kg/month and estimates of 2.145, 2.862 and 0.880 kg/month at older ages, respectively. Inflection points occurred at 15.576, 13.034 and 19.919 months for the Gompertz, Bertalanffy and Logistic models, respectively.
Observed average weight (solid circles), predict model (solid line), instantaneous growth rate (solid grey line) and inflection point (dashed line) using nonlinear mixed models.

Discussion
An important factor for the application of nonlinear models to model growth curves is the time interval used. The reason for this limitation is the need to use measures close to mature weight. In European cattle, Morrow et al. (Reference Morrow, McLaren and Butts1978) reported that accurate estimates of the model parameters can only be obtained for databases in which the animals were weighed after 54 months. The dataset used in this study included weights measured up to 60 months of age, which increased the credibility of the estimates.
Most studies applying nonlinear models to evaluate growth have used data from beef cattle. Studying pasture-fed Angus cows, Goldberg and Ravagnolo (Reference Goldberg and Ravagnolo2015) concluded that the Richards function fitted the data better than the Brody, Bertalanffy or Gompertz model. Lopes et al. (Reference Lopes, Magnabosco, Souza, Assis and Brunes2016) and Moreira et al. (Reference Moreira, Mercadante, Pedrosa, Cyrillo and Henrique2016), using information from Nellore Mocho and Caracu cattle, found evidence that the Brody function is the most suitable for the study of growth in these cattle breeds.
Data for buffaloes or dairy animals like those used in this study are sparse. In addition, there are no published studies that apply nonlinear mixed models using months as an independent variable, or that discuss maturity rate and IGR and the differences and applications of these models. Agudelo-Gómez et al. (Reference Agudelo-Gómez, Hurtado-Lugo and Cerón-Muñoz2009) and Araújo et al. (Reference Araújo, Marcondes, Damé, Garnero, Gunski, Everling and Rorato2012) described Brody and Gompertz models as the best-fitting for buffaloes, respectively. Similarly, Malhado et al. (Reference Malhado, Gonçalves Rezende, Malhado, Azevedo, Souza and Carneiro2017) reported a higher efficiency of the Bertalanffy function to fit growth curves in Murrah, Jaffarabadi and Mediterranean buffaloes. In general, nonlinear models also seem to be dependent on allometric factors characteristic of the species, breed, management, or conditions of the environment where the animals are reared.
Lower values of parameter A were reported by Malhado et al. (Reference Malhado, Ramos, Carneiro, Souza, Wechsler, Eler, Azevêdo and Sereno2008) and Araújo et al. (Reference Araújo, Marcondes, Damé, Garnero, Gunski, Everling and Rorato2012), a finding that might be explained by the shorter time interval during which the weight recordings were performed compared to the present study. Parameter A is an estimate of asymptotic weight when time tends to infinity. If mature weight is not reached, A reflects the weight estimate in the last recordings (Freitas, Reference Freitas2005). However, for any of the models used, the estimated asymptotic weight was higher than the mature weight of species described in the literature (Andrade and Garcia, Reference Andrade and Garcia2005; Marai and Haeeb, Reference Marai and Haeeb2010). However, Agudelo-Gómez et al. (Reference Agudelo-Gómez, Hurtado-Lugo and Cerón-Muñoz2009) reported values of 869.79 and 801.87 for this parameter for two buffalo production systems in Colombia, which are higher than those found in this study. This variation can be attributed to differences in breed composition, production system, and sample effect between the studies.
The k values estimated here were similar to those described in the literature. Using the same nonlinear models, Malhado et al. (Reference Malhado, Ramos, Carneiro, Souza, Wechsler, Eler, Azevêdo and Sereno2008) reported k values ranging from 0.0011 to 0.0026, while Araújo et al. (Reference Araújo, Marcondes, Damé, Garnero, Gunski, Everling and Rorato2012) reported values ranging from 0.002 to 0.0049. Likewise, the values for parameter b were similar to those described in other studies on buffaloes. Using the same models, Malhado et al. (Reference Malhado, Ramos, Carneiro, Souza, Wechsler, Eler, Azevêdo and Sereno2008) and Araújo et al. (Reference Araújo, Marcondes, Damé, Garnero, Gunski, Everling and Rorato2012) reported values of b ranging from 0.58 to 2.38 and from 0.485 to 1.866, respectively. Using the Logistic function, these authors estimated values of 3.23 and 2.54 for parameter b. In this respect, the selection of animals with a higher growth rate (k) implies the selection with a higher intensity of animals that reach maturity weighing less (A).
The negative correlation between A and k indicates that buffaloes with higher growth rates reach mature weight earlier (precocious animals) and are less likely to reach higher weights than buffaloes with slower growth rates (Agudelo-Gómez et al., Reference Agudelo-Gómez, Hurtado-Lugo and Cerón-Muñoz2009). Using the Bertalanffy model, correlations of smaller magnitudes between parameters A and k compared to those found in the present study were reported for Jaffarabadi (−0.33), Mediterranean (−0.70) and Murrah buffaloes (−0.63) in Brazil (Malhado et al., Reference Malhado, Gonçalves Rezende, Malhado, Azevedo, Souza and Carneiro2017).
Negative correlations between A and k have also been described for other species. Using different fixed effects in a mixed Logistic model with sheep data, Houssein-Zahed (Reference Houssein-Zahed2017) reported correlation coefficients between A and k of −0.40 to −0.34. Despite the antagonism, the magnitude is lower than that found in the present study for buffaloes. Correlation estimates between A/b and A/k similar to those found here were described by Coyne et al. (Reference Coyne, Berry, Mäntysaari, Juga and McHugh2015) for pigs (0.29 and −0.74, respectively). However, for the b/k correlation, these authors estimated values of similar magnitude, but synergistic (0.12).
Considering that under favourable conditions female buffaloes enter oestrus between 15 and 18 months of age (Perera, Reference Perera2011), this period coincided with the IP obtained with the models, indicating a possible relationship between these parameters and puberty of the species. A relationship between the IP of nonlinear function parameters and the onset of puberty was also reported by Oliveira et al. (Reference Oliveira, Lôbo and Pereira2000) and Garnero et al. (Reference Garnero, Marcondes, Bezerra, Oliveira and Lôbo2005) in studies on Nellore cattle. Regarding IGR, a large decline was observed at 200 days of age, indicating the need for changes in the nutritional management of the animals in order to maintain higher growth rates. There are no reports in the literature on the IGR and IP of buffaloes and few studies on cattle have addressed these traits. An IGR of 0.66 kg/day (equivalent to 19.8 kg/month) and an IP at 97 days were reported for Nellore cows reared in the Amazon biome at 750 days of age (Marinho et al., Reference Marinho, Freitas, Falcão and Dias2013). The low IGR and the late IP observed in the present study for buffaloes when compared to cattle are due to the massive genetic improvement and the productive management adopted in recent years for the latter, ensuring high efficiency in body weight gain.
Most dairy or beef cattle farms consider females to be eligible for breeding when the heifers reach 60–70% of the mature weight of the breed. A direct consequence of the low IGR values is the increase in age at first calving of females in the herd. In a review, Bergamasco et al. (Reference Bergamasco, Aquino and Muniz2001) reported that the age at first calving of heifers in tropical regions generally tends to be late, which is often due to the fact that the breeder does not correctly choose the age or minimum weight for the breeding of the animals. This trait is of great economic importance since it directly influences milk yield and reproductive efficiency, which will increase the sooner first calving occurs.
Regarding the parameters of the models, many authors attribute greater importance to asymptotic weight (A) and maturity rate (k) in production systems. Considering not only maintenance costs but also the costs related to the production of replacement females, selection based on lower values of A and higher values of k is desirable to increase the efficiency of the system (Torre et al., Reference Torre, Candotti, Reverter, Bellido, Vasco, Garcia and Brinks1992).
The present results indicate that the Bertalanffy model provides the best fit to growth records of buffalo females from birth to 60 months of age. Another important finding was the importance of including the effect of CG in the nonlinear mixed models to obtain better estimates of the growth curve parameters.
Financial support
The authors declare that no financial support was used for the preparation of this study.
Conflicts of interest
The authors declare that they have no conflict of interest.
Ethical standards
Animal Care and Use Committee approval was not necessary for this study because the data were obtained from an existing database.