INTRODUCTION
Little is known about the mechanisms whereby marine shallow-water meiofauna organisms disperse and colonize new habitats (Gerlach, Reference Gerlach1977; Coull, Reference Coull, Higgins and Thiel1988; Giere, Reference Giere2009). Meiofauna in general is thought to have a limited dispersal potential, due to its holobenthic life-cycle and associated morphological adaptations (Giere, Reference Giere2009). As opposed to this, several shallow-water meiofauna species were recorded at locations separated by thousands of kilometres of seemingly insurmountable deep-sea habitats (Giere, Reference Giere2009; Artois et al., Reference Artois, Fontaneto, Hummon, McInnes, Todaro, Sørensen, Zullini and Fontaneto2011; George, Reference George2013), a phenomenon known as ‘meiofauna paradox’ (Giere, Reference Giere2009). Recently several studies have focused on the potential function of seamounts in the dispersal of meiofauna (George & Schminke, Reference George and Schminke2002; Gad & Schminke, Reference Gad and Schminke2004; George, Reference George2004, Reference George2013; Büntzow, Reference Büntzow2011; Koller & George, Reference Koller and George2011; Packmor et al., Reference Packmor, Müller and George2015; Packmor & Riedl, Reference Packmor and Riedl2016). One hypothesis is that islands and seamounts might function as stepping stones supporting the geographic distribution and the colonization of new habitats by chance dispersal (Rosen, Reference Rosen1983, Reference Rosen and Brenchley1984; Cecca, Reference Cecca2002). Furthermore if they are located within the ‘critical dispersion distance’ of small benthic organisms (i.e. within the dispersal range of the respective taxa), islands and seamounts might function as staging posts facilitating continuous faunal exchange and consequently gene flow between the different populations (Rosen, Reference Rosen1983, Reference Rosen and Brenchley1984; Cecca, Reference Cecca2002). The stepping stone hypothesis could be supported if representatives of the same (meiofaunal) species are recorded on several seamounts within a comparably small geographic area.
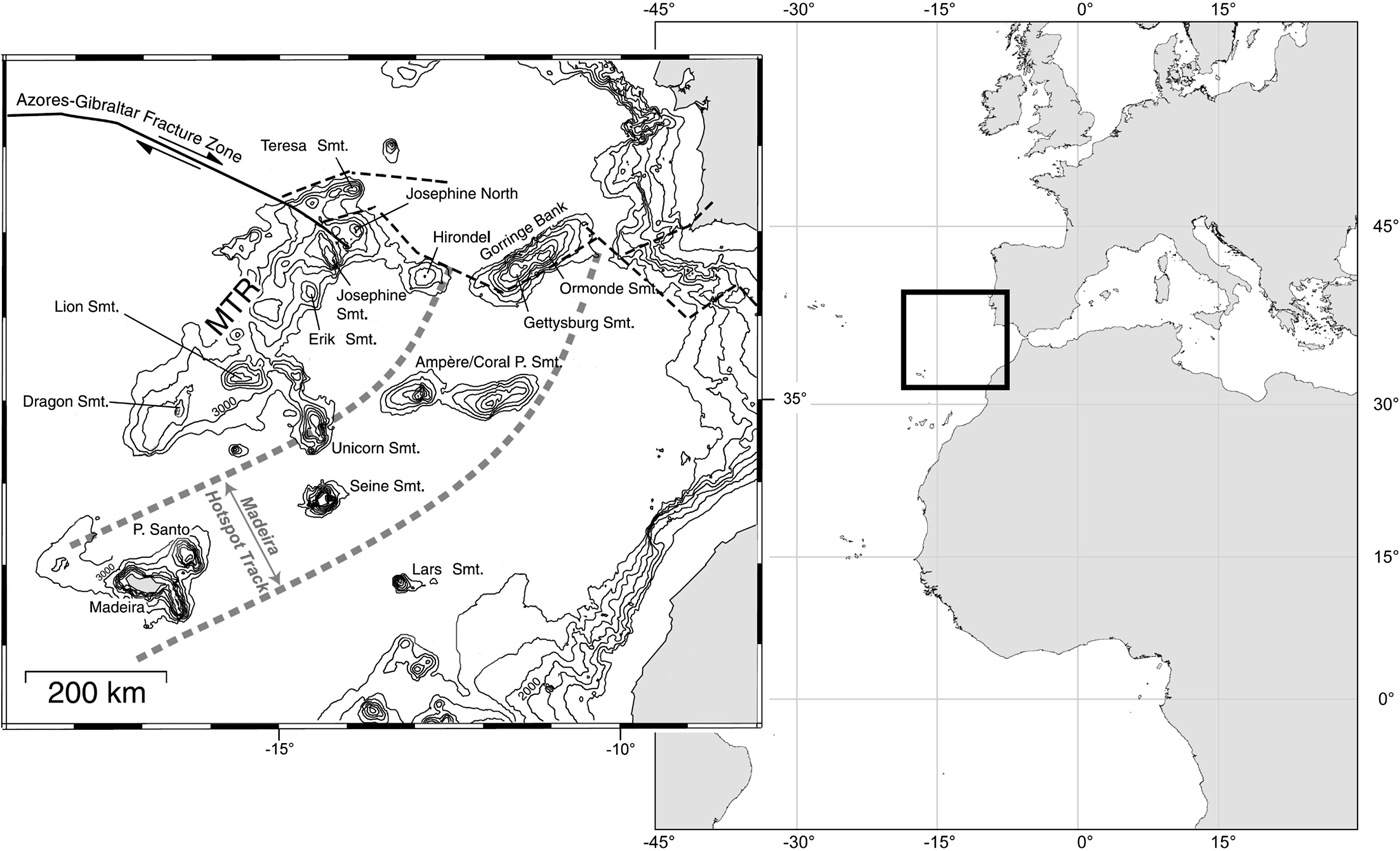
A suitable study area for the investigation of the stepping stone hypothesis is the ‘Madeira Hot Spot Track’ (MHST; Figure 1), an island and seamount chain located in the North-east Atlantic Ocean (Geldmacher et al., Reference Geldmacher, Hoernle, van den Bogaard, Duggen and Werner2005, Reference Geldmacher, Hoernle, Klügel, van den Bogaard and Duggen2006a, Reference Geldmacher, Hoernle, Klügel, van den Bogaard, Wombacher and Berningb). The oldest seamount of this Hot Spot Track, Ormonde Seamount (67 Million years (Ma)), is located relatively close to the Portuguese mainland (about 200 km west), followed by the seamounts Coral Patch/Ampère (32/31 Ma), Unicorn (27 Ma) and Seine (24 Ma; geological dates adopted from Geldmacher et al., Reference Geldmacher, Hoernle, Hanan, Blichert-Toft, Hauff, Gill and Schmincke2011). The youngest mounts are the Portuguese islands Porto Santo (19 Ma; Mata et al., Reference Mata, Fonseca, Prada, Rodrigues, Martins, Ramalho, Madeira, Chachão, Silva and Matias2013) and Madeira (7 Ma; Ramalho et al., Reference Ramalho, Brum da Silveira, Fonseca, Madeira, Cosca, Cachão, Fonseca and Prada2015), located ~900/950 km south-west of the Portuguese coast and 700 km north-east of the coast of Morocco. As most of the seamounts of the MHST rise from the seafloor up to less than a few hundred metres depth (Ormonde 40 m (Ávila & Malaquias, Reference Ávila and Malaquias2003), Coral Patch 650 m (Wienberg et al., Reference Wienberg, Wintersteller, Beuck and Hebbeln2013), Ampère 55 m (Christiansen & Wolff, Reference Christiansen and Wolff2009), Unicorn (information not available) and Seine 160–180 m depth (Christiansen & Wolff, Reference Christiansen and Wolff2009)) they may offer suitable habitats for shallow-water meiofauna organisms. Therefore the MHST has been chosen for extensive faunistic and biogeographic research on harpacticoid copepods as a model meiobenthic taxon. In a first approach Büntzow (Reference Büntzow2011) studied the Harpacticoida of Seine Seamount and surrounding deep-sea habitats. The present contribution focused on littoral Harpacticoida of Madeira and Porto Santo islands as further chain links of the MHST.
Bathymetric map of the ‘Madeira Hot Spot Track’ (framed with grey dashed lines) and neighbouring seamounts of the Madeira-Tore Rise (MTR), adopted from Geldmacher et al. (Reference Geldmacher, Hoernle, Klügel, van den Bogaard, Wombacher and Berning2006b), modified.

The investigation of the potential function of islands/seamounts in the dispersal of meiofauna requires profound knowledge of their faunal composition. However, the harpacticoid fauna of the Madeiran Archipelago is very poorly studied. Besides two investigations from the 19th century, which altogether named 22 species out of 12 families of Harpacticoida for Madeiran waters (Fischer, Reference Fischer1860; Thompson, Reference Thompson1888), only some single species were recorded (Delamare Deboutteville, Reference Delamare Deboutteville1960; Fiers, Reference Fiers1993). With the present contribution we provide a thorough inventory at family and species level, to provide a basis for successive comparison of the harpacticoid faunas of the different elevations of the MHST. In this context we compared the harpacticoid assemblages of all locations sampled along the coastline of Madeira and Porto Santo, and the harpacticoid faunas of both islands. Moreover, remarks on the distribution of single harpacticoid taxa along the MHST are given.
MATERIALS AND METHODS
Study area and sampling procedure
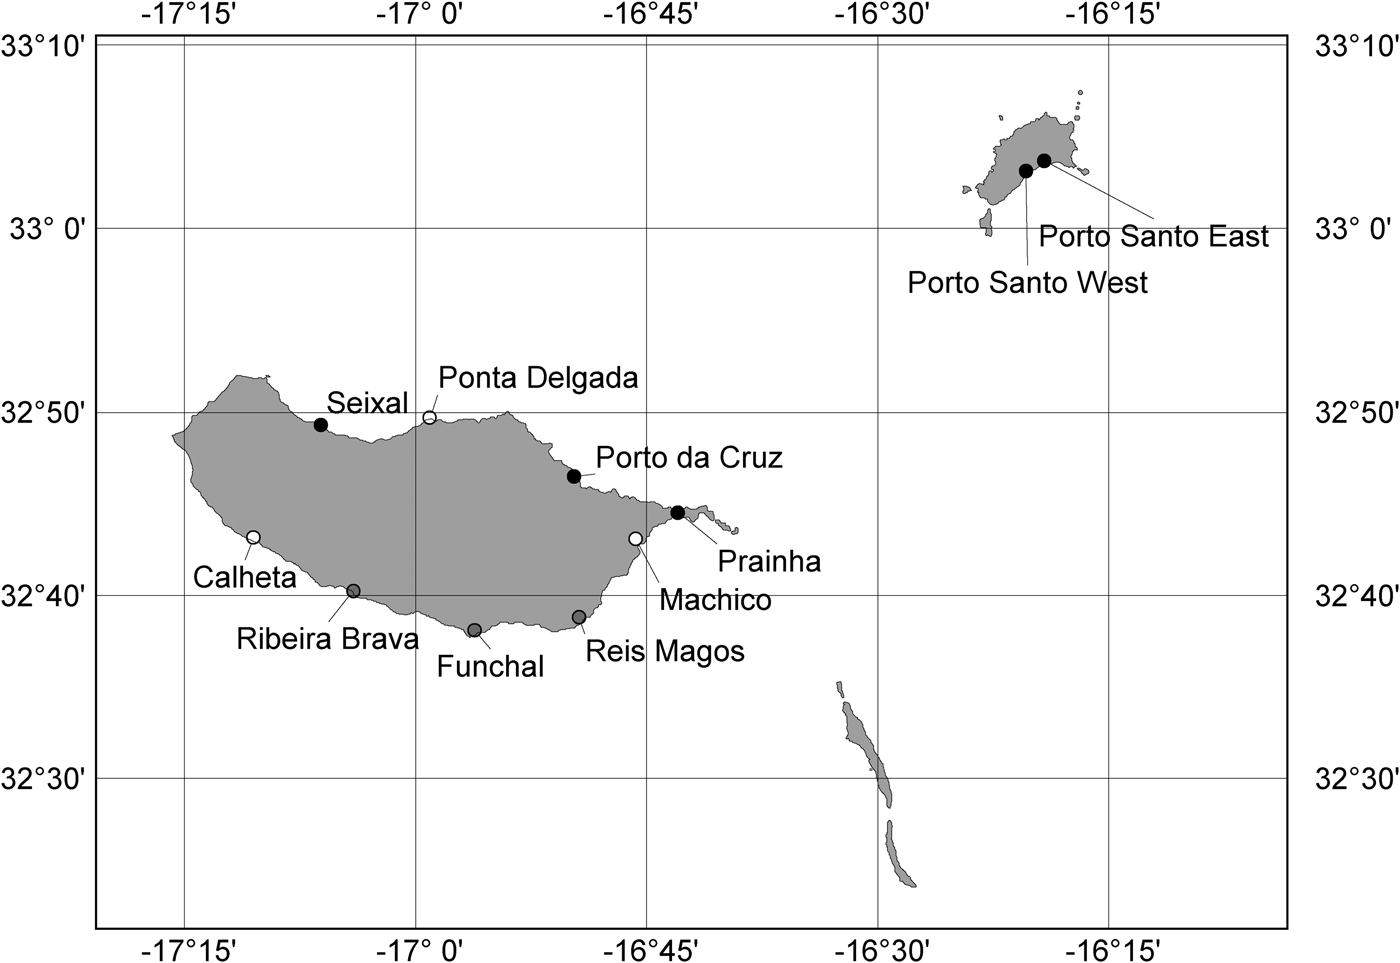
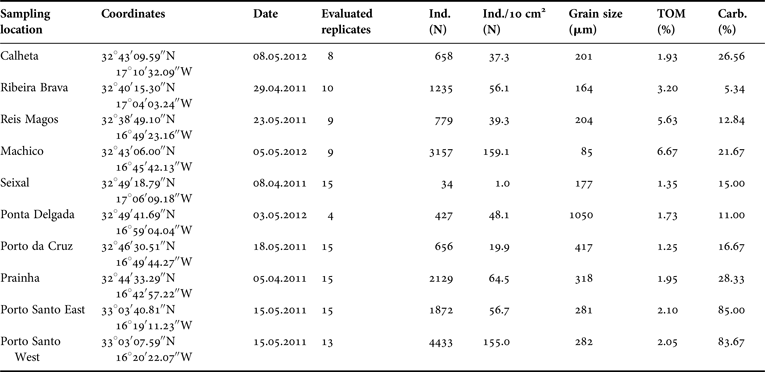
Sediment cores for the quantitative investigation of the harpacticoid communities of Madeira and Porto Santo were taken during April and May 2011 and May 2012. In total, 11 sampling locations were studied, of which 10 will be considered in this publication (Funchal, the 11th sampling location, revealed only qualitative samples). Eight locations are situated along the Madeiran coastline and two on the south coast of Porto Santo (Figure 2). The sampling locations on Madeira were Seixal, Ponta Delgada and Porto da Cruz on the north coast, Prainha in the east and Calheta, Ribeira Brava, Reis Magos and Machico on the south coast (Table 1). The two sampling locations on the south coast of Porto Santo were Porto Santo East and Porto Santo West.
Geographic position of the sampling locations. Grey dots sampled in 2011, white dots sampled in 2012, black dots sampled in 2011 and 2012 (Map Source: Pangaea, PanMap).

Detailed information on the investigated sampling locations on Madeira and Porto Santo. Coordinates, date of sampling, number of evaluated replicates, total number of adult Harpacticoida, number of adult individuals of Harpacticoida/10 cm2 and the median of the analysed environmental variables (grain size, total organic matter (TOM), carbonate content) are provided.

Almost all sediment cores were taken in the littoral zone, at a water depth of 2–3 m below low tide level, using snorkelling equipment. Only Reis Magos was sampled in the uppermost subtidal zone (10–13 m depth) using scuba diving equipment. Single plastic corers with a sampling surface of 22 cm2 were used to sample the uppermost 5 cm of sediment (sediment volume, 110 cm3). At each location two (Calheta, Ribeira Brava, Reis Magos) or three (Seixal, Porto da Cruz, Prainha, Machico, Porto Santo East and West) randomly chosen stations were sampled with six replicates each. Ponta Delgada was sampled at one station only as this sampling location is characterized by coarse sands and gravel mostly, a substrate which could not be sampled with the chosen method, and displays just a comparably small area with finer sands. Five of the replicates of each station were designated for meiofauna investigations and were immediately preserved in 4% buffered formaldehyde solution. The sixth replicate of each station was taken for sediment analyses. The meiofauna samples were sent to the DZMB (Deutsches Zentrum für Marine Biodiversitätsforschung, Senckenberg am Meer, Wilhelmshaven, Germany) while sediment samples were processed on Madeira (laboratory of the Estação de biologia marinha do Funchal).
Sample treatment
The preserved meiofauna samples were washed with tap water. The meiofauna and organic matter were extracted from the sediment by centrifugation using Levasil (colloidal silica polymer) as a flotation medium and kaolin to cover the sand particles (McIntyre & Warwick, Reference McIntyre, Warwick, Holme and McIntyre1984). The samples were centrifuged three times at 4000 rpm for 5 min. Meiofauna samples were sorted using a Leica MZ 125 stereo microscope and all copepod specimens were transferred to a 1:1 water–glycerin solution on hollow-ground glass slides. For determination on family and species level most adult specimens of Harpacticoida were transferred on microscope slides in glycerin and were studied with a Leica DMR compound microscope equipped with differential interference contrast. Note that in the context of the present contribution the taxon Polyarthra Lang, 1944 (comprising the families Canuellidae Lang, 1944 and Longipediidae Sars, 1903) is considered as a harpacticoid taxon following Wells (Reference Wells2007).
The sediment samples were dried (60–70°C until constant weight) and were analysed regarding the grain size composition, content of organic matter (TOM, combustion in a muffle furnace for 4 h at 450°C) and content of carbonates (treatment with hydrochloric acid). The analysis of the grain size composition was done with dried sediment and without any pre-treatment of the samples with hydrochloric acid or other detergents due to the high content of carbonates at some of the sampling locations (Table 1).
Data analysis and visualization
Family and species assemblage similarity between the sampling locations were compared using non-metric multidimensional scaling (nMDS) based on the cosine similarity index, which considers both species composition and abundances. We chose cosine instead of the widely used Bray–Curtis similarity as it retains the structural properties of the assemblages more clearly (Pfeifer et al., Reference Pfeifer, Bäumer, Dekker and Schleier1998). Cosine similarity has the advantage that differences between ‘similar’ units resulting from multiples in abundance of the analysed taxa (which for instance might be caused by different geographic constraints such as exposure of the sampling sites) will not lead to separation of the respective units (Pfeifer et al., Reference Pfeifer, Bäumer, Dekker and Schleier1998). For the similarity analysis of the species assemblages only those families were considered which were determined on species-level. Furthermore we used permutational multivariate analysis of variance (PERMANOVA) to assess differences between the sampling locations. All analyses were performed with non-transformed abundance data of all evaluable quantitative replicates. The replicates of the sampling location Seixal were excluded from the multivariate analyses as the density of Harpacticoida was extremely low at this location in comparison with all other locations (1 adult individual per 10 cm2, see Table 1) which would artificially skew the configuration of the nMDS plot. Multivariate analyses were performed using software PRIMER v6 and PERMANOVA+ (Clarke & Gorley, Reference Clarke and Gorley2006; Anderson et al., Reference Anderson, Gorley and Clarke2008) and PAST v2.17c (Hammer et al., Reference Hammer, Harper and Ryan2001). To test whether the compiled environmental variables influence the species composition at the sampling locations we performed a ‘Biota and Environment Matching’ (BEST) with the software PRIMER v6. The geographic maps (Figures 1 and 2) were created using the program PanMap (NGDC/NOAA, 1993; Diepenbroek et al., Reference Diepenbroek, Grobe and Sieger2000).
RESULTS
Composition of the harpacticoid fauna of Madeira and Porto Santo
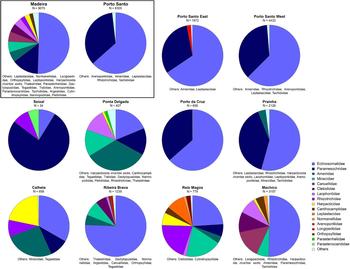
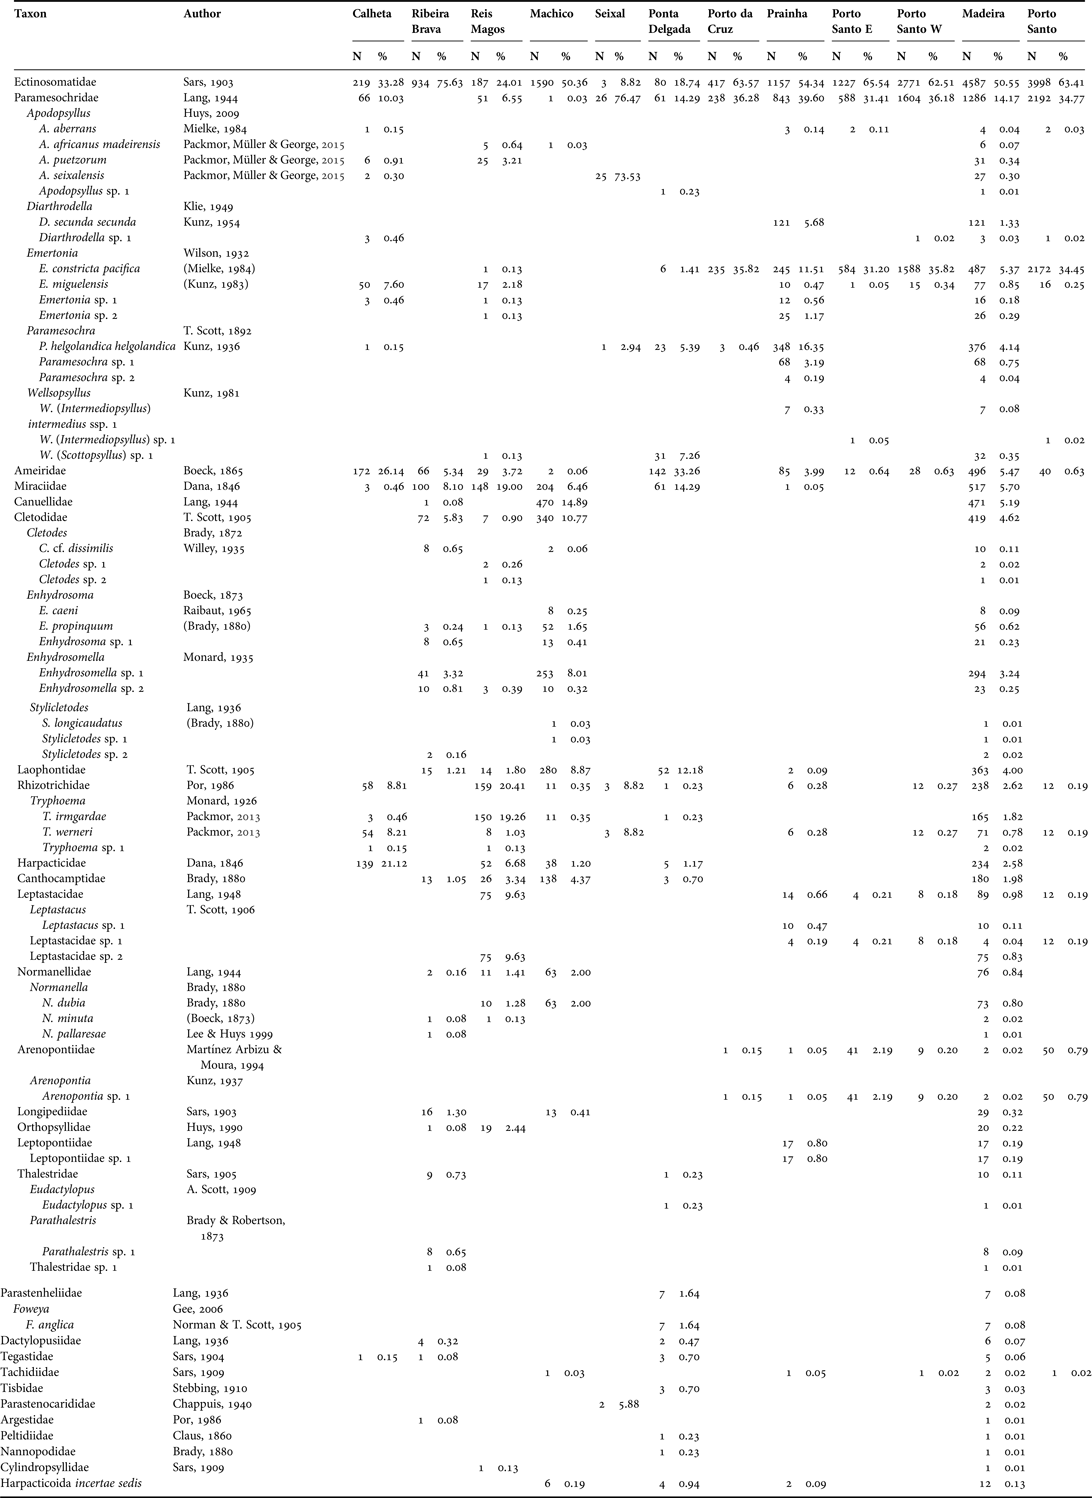
The studied material of all Madeiran sampling locations (Figure 2) revealed a total amount of 12,834 specimens of Harpacticoida of which 9075 were adults (70.7%) and the remaining 3759 copepodids (29.3%). All adult specimens of Harpacticoida were determined on family level amounting to 27 families (Table 2). Twelve individuals could not be assigned to any known family of Harpacticoida and are listed as ‘Harpacticoida incertae sedis (i. s.)’. By far the most abundant families at Madeira are the Ectinosomatidae Sars, 1903 (50.6%) and Paramesochridae Lang, 1944 (14.2%), followed by Miraciidae Dana, 1846 (5.7%), Ameiridae Boeck, 1865 (5.5%), Canuellidae Lang, 1944 (5.2%), Cletodidae T. Scott, 1905 (4.6%), Laophontidae T. Scott, 1905 (4.0%), Rhizotrichidae Por, 1986 (2.6%), Harpacticidae Dana, 1846 (2.5%) and Canthocamptidae Brady, 1880 (2%; Table 2, Figure 3). The remaining 17 families occur in comparably low abundances and comprise together only 3.1% of all investigated Madeiran Harpacticoida. Eight of the latter families were exclusively found at one single sampling location each (Argestidae Por, 1986 (Ribeira Brava); Cylindropsyllidae Sars, 1909 (Reis Magos); Leptopontiidae Lang, 1948 (Prainha); Parastenocarididae Chappuis, 1940 (Seixal); Nannopodidae Brady, 1880, Parastenheliidae Lang, 1936, Peltidiidae Claus, 1860, Tisbidae Stebbing, 1910 (Ponta Delgada)).
Illustration of the harpacticoid family assemblages at all investigated sampling locations of Madeira and Porto Santo. Total number (N) of investigated adult individuals of Harpacticoida per sampling location is provided.

Taxa-station matrix of the investigated Harpacticoida collected along the coasts of Madeira and Porto Santo. Number of individuals (N) and relative abundance values (%) per sampling location are presented.

The three individuals of Diarthrodella sp. 1 that were recorded at Calheta, were accidentally named Diarthrodella secunda secunda in Packmor et al. (Reference Packmor, Müller and George2015).
The investigated material of both sampling locations of Porto Santo revealed a total amount of 9431 specimens of Harpacticoida of which 6305 were adults (66.9%) and 3126 copepodids (33.1%). All adult Harpacticoida belong to seven families, all of which occur at some of the Madeiran sampling locations as well (Table 2). As on Madeira the Ectinosomatidae and Paramesochridae show the highest relative abundances (63.4 and 34.8% respectively), while the representatives of the remaining five families comprise only 1.8% of all investigated Harpacticoida of Porto Santo (Table 2, Figure 3).
The specimens of nine families were determined on species level (Arenopontiidae Martínez Arbizu & Moura, 1994, Cletodidae, Leptastacidae Lang, 1948, Leptopontiidae, Normanellidae Lang, 1944, Paramesochridae, Parastenheliidae, Rhizotrichidae and Thalestridae Sars, 1905), of which four occur on Porto Santo as well (Arenopontiidae, Leptastacidae, Paramesochridae and Rhizotrichidae). On Madeira these families account for 42 species altogether (Table 2). The more abundant Paramesochridae and Cletodidae also showed the highest numbers of different species (16 and 11 species respectively) while Leptastacidae, Normanellidae, Rhizotrichidae and Thalestridae were present with three species and the remaining families with one species each. Thirty of the investigated species (71.4%) from Madeira were undescribed/unknown species and subspecies, five of which had been described successively in recent years (Tryphoema irmgardae and Tryphoema werneri (Packmor, Reference Packmor2013), Apodopsyllus africanus madeirensis, Apodopsyllus puetzorum and Apodopsyllus seixalensis (Packmor et al., Reference Packmor, Müller and George2015)). The remaining 12 recorded species were already described and reported from other shallow-water habitats (Apodopsyllus aberrans Mielke, 1984, Diarthrodella secunda secunda (Kunz, 1954), Emertonia constricta pacifica (Mielke, 1984), Emertonia miguelensis (Kunz, 1983), Paramesochra helgolandica helgolandica (Kunz, 1937), Enhydrosoma caeni Raibaut, 1965, Enhydrosoma propinquum (Brady, 1880), Stylicletodes longicaudatus (Brady, 1880), Normanella dubia Brady, 1880, Normanella minuta (Boeck, 1873), Normanella pallaresae Lee & Huys, 1999 and Foweya anglica (Norman & T. Scott, 1905)). On Porto Santo the determination on species level revealed eight species of which the Paramesochridae account for five species and the remaining three families for one species each. Despite one paramesochrid species (Wellsopsyllus (Intermediopsyllus) sp. 1) all species were found on Madeira as well (Table 2). Three of the species recorded on Porto Santo are already known species (Apodopsyllus aberrans, Emertonia constricta pacifica, Emertonia miguelensis), while the remaining five species were unknown/undescribed species.
Comparison of the sampling locations
Most of the investigated sampling locations show clear differences in their harpacticoid faunal composition, both on family and species level as well as in the densities of adult Harpacticoida (Tables 1, 2, Figure 3). The only locations with apparently similar harpacticoid assemblages are Porto da Cruz, Prainha (north-east and east coast of Madeira) and both sampling locations on Porto Santo, Porto Santo East and Porto Santo West. These locations are characterized by a dominance of Ectinosomatidae (54.3–65.5%) together with Paramesochridae (31.4–39.6%) amounting to 93.9–99.9% of all Harpacticoida respectively. Additionally they are the only sampling locations with an occurrence of Arenopontiidae albeit in low abundances (0.05–2.19%). On species level these four locations are characterized by a remarkably high abundance of Emertonia constricta pacifica which is the dominating species of Paramesochridae at Porto da Cruz, Porto Santo East and West while Prainha shows some additional abundant paramesochrid species as well (Paramesochra helgolandica helgolandica and Diarthrodella secunda secunda). Furthermore these are the only locations with presence of Arenopontia sp. 1.
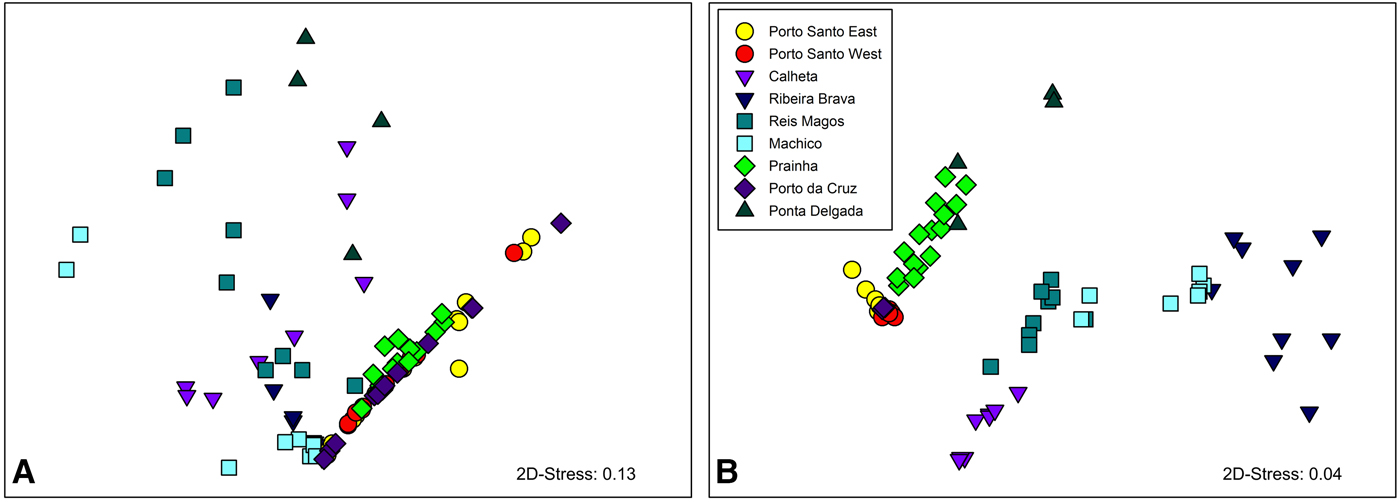
The similarity of all investigated sampling locations was calculated using the cosine similarity index based on the abundances of specimens of the different families and species respectively. Note that all replicates of Seixal were excluded from the similarity analyses as was posed above (see section on data analyses). The results apparently support the observation that the easternmost Madeiran locations and both locations of Porto Santo are similar (Figure 4). The nMDS which was derived from a comparison of the sampling locations on family level (stress: 0.13) shows an almost linear arrangement with several overlaps of the replicates from Prainha, Porto da Cruz and Porto Santo East and West (Figure 4A) while most of the replicates from the remaining locations show a scattered pattern without any recognizable relation. The nMDS based on the similarity matrix of the sampling locations on species level (stress: 0.04) reveals an obvious overlap of several replicates of the sampling locations from Porto da Cruz with Porto Santo East and West (Figure 4B) as well. Additionally several replicates from Prainha are arranged relatively close to those while others show a greater distance. Again most of the replicates from the remaining sampling locations show no particular relation to any other location.
Similarity of the investigated sampling locations of Madeira and Porto Santo with regard to family (A) and species (B) composition of Harpacticoida based on non-transformed abundance data. Non-metric multidimensional scaling (nMDS) ordination (cosine similarity index), stress values are indicated in the respective figure.

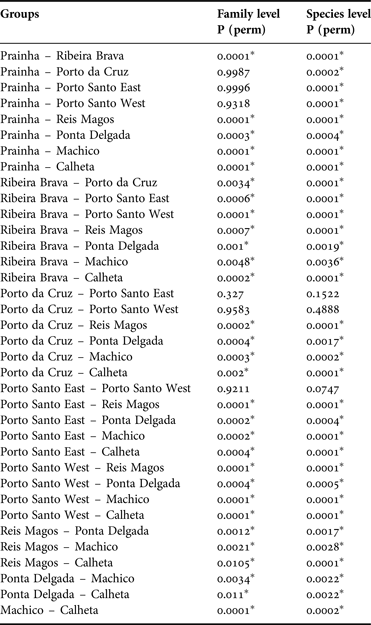
Both similarity matrices were tested with PERMANOVA (pair-wise tests of all investigated sampling locations) revealing further support of the described observations. On family level the sampling locations Prainha, Porto da Cruz, Porto Santo East and Porto Santo West show no significant differences while all remaining locations differ significantly from one another (Table 3). On species level only the locations Porto da Cruz, Porto Santo East and West show no significant differences while all remaining locations differ significantly from one another.
P values of PERMANOVA, pair-wise comparison (number of permutations 9999) of all investigated sampling locations of Madeira and Porto Santo (except Seixal) based on harpacticoid family and species assemblages.

*Significant differences at P < 0.05.
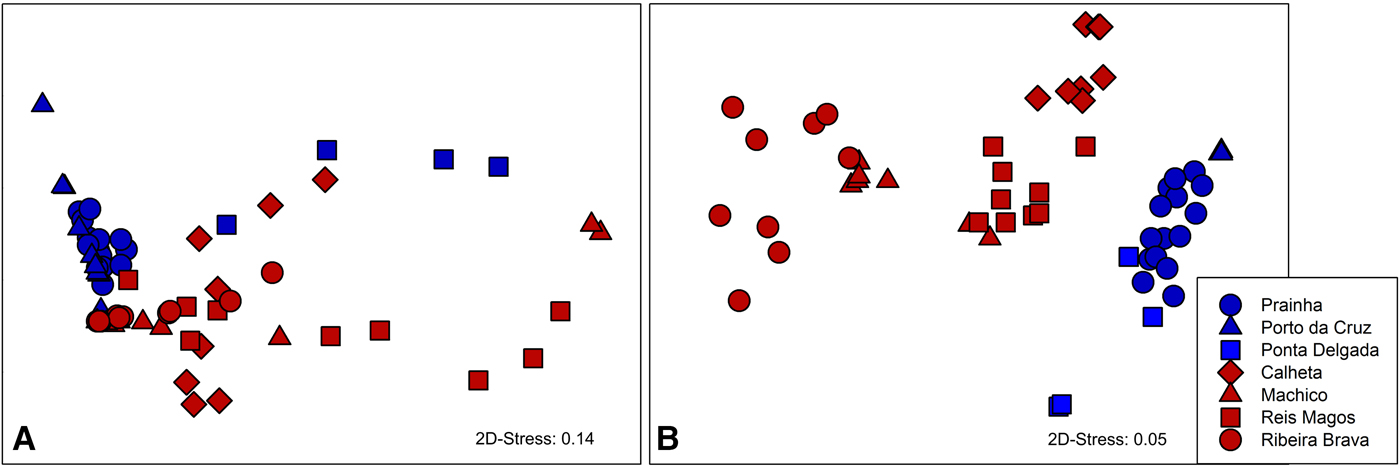
Additionally we calculated the similarity of the harpacticoid assemblages (family and species level; cosine similarity) of the northern (and easternmost) Madeiran sampling locations (Ponta Delgada, Porto da Cruz and Prainha) with those from the south coast (Calheta, Ribeira Brava, Reis Magos, Machico). Both nMDS plots based on the similarity matrices of the Madeiran sampling locations on family (Figure 5A, stress 0.14) as well as on species level (Figure 5B, stress: 0.05) indicate a separation of the northern from the southern replicates which is more obvious in the nMDS on species level. These results were tested with PERMANOVA as well, revealing significant differences between the northern and southern locations on family as well as on species level (P(perm) = 0.0001 in both cases, significant differences at P < 0.05).
Similarity of the Madeiran sampling locations with regard to family (A) and species (B) composition of Harpacticoida based on non-transformed abundance data. Non-metric multidimensional scaling (nMDS) ordination (cosine similarity index), stress values are indicated in the respective figure. Blue = northern and eastern locations, red = southern locations.

To test whether the measured abiotic variables (median grain size, TOM and carbonate content; Table 1) correlate with the patterns of similarity based on the different species of Harpacticoida a ‘Biota and Environment matching’ (BEST) was performed. This analysis revealed a significant correlation (Rho 0.441 with a significance level of 3%) of the abiotic variables with the cosine similarity matrix on species level. The highest correlations were detected for TOM (0.441) and median grain size (0.352; TOM and grain size together 0.335), while the carbonate content apparently had no particular influence on the species composition.
DISCUSSION
Harpacticoida of Madeira and Porto Santo
Hitherto only little information about the Harpacticoida of the Madeiran Archipelago is available. The most comprehensive but still cursory studies were conducted in the 19th century by Fischer (Reference Fischer1860) and Thompson (Reference Thompson1888). Fischer investigated several Madeiran rock pools and freshwater habitats and detected eight species of Harpacticoida while Thompson's investigation of tow-netting samples from the Bay of Funchal (located at the south coast) revealed 14 species. Beyond that only single species were detected at the coast of Madeira, as for example the laophontid species Loureirophonte majacola Fiers, Reference Fiers1993 (Fiers, Reference Fiers1993), or the interstitial species Arenopontia subterranea Kunz, 1937, which was recovered by Delamare Deboutteville (Reference Delamare Deboutteville1960). The present investigation of the intertidal and uppermost sublittoral zone of sandy beaches at the coasts of Madeira and Porto Santo ascertains a very diverse harpacticoid fauna and exceeds the previous knowledge markedly.
Noticeably the sampled Madeiran shallow-water habitats are not characterized by a uniform harpacticoid fauna. Instead all but two of the eight investigated sampling locations differ significantly from one another in terms of their family composition and all concerning their species composition. However the environmental conditions of the eastern flank are apparently more similar to the north coast than those of the south as the two easternmost sampling locations Porto da Cruz (north-east) and Prainha (south-east) are the only Madeiran locations that show no significant differences concerning their harpacticoid family composition. Furthermore the harpacticoid fauna of the sampling locations of the north (except Ponta Delgada) and east is characterized by typical interstitial taxa like Paramesochridae, Leptastacidae, Leptopontiidae, Arenopontiidae as well as slender taxa of Ectinosomatidae like Arenosetella while the locations in the south (Calheta, Ribeira Brava, Reis Magos, Machico) are dominated by more robust burrowing or epibenthic taxa such as Cletodidae, Normanellidae, Harpacticidae, Miraciidae, Longipediidae and robust forms of Ectinosomatidae like Pseudobradya (Table 2 and personal observations).
Reasons for the heterogeneity in the species assemblages and the differences of the north from the south coast may be found in the geographic characteristics of this open ocean island. The coastline of Madeira is predominated by steep cliffs with rocky or coarse gravel beaches if at all. Even the submarine slope of the island is in most parts extremely precipitous resulting in a narrow and very dynamic shallow-water habitat as waves reach the coastline almost unabated. Only few disconnected small-scaled sandy beaches are formed either in sheltered bays (sampling locations at Porto da Cruz and Prainha) or in the lee of breakwaters (sampling locations at Seixal, Ponta Delgada, Calheta, Ribeira Brava, Machico). In the case of Machico and Calheta Saharan sands were artificially applied for beach replenishment purposes (Alves Rodrigues, Reference Alves Rodrigues2010). Additionally there are strong differences between the north and the south coast mainly induced by the topographic disturbance of the oceanic current by the island and the barrier the high mountain range in the centre of Madeira (highest point Pico Ruivo, 1862 m) constitutes to the dominant north-east trade winds (Caldeira et al., Reference Caldeira, Groom, Miller, Pilgrim and Nezlin2002; Caldeira & Tomé, Reference Caldeira and Tomé2013). The sea surface temperature is usually higher at the south side (lee) of the island. Furthermore atmospheric and warm water island wakes are formed leeward, especially in spring and summer. Eddies are formed in the east and west of the island while the north coast shows highest humidity and is generally affected by the highest waves (Caldeira et al., Reference Caldeira, Groom, Miller, Pilgrim and Nezlin2002). Consequently, the higher waves in the north and still rough conditions in the east and west in combination with steep coasts lead to high energetic intermediate beaches (Short & Wright, Reference Short and Wright1983), fine material is washed off by the waves resulting in a small amount of nutrients and medium grained sediments (or even coarse in the case of Ponta Delgada) which are favoured by interstitial harpacticoid species (Noodt, Reference Noodt1971; Hicks & Coull, Reference Hicks and Coull1983). On the other hand the southern locations are less impacted by waves and show higher amounts of organic matter and in the case of Machico finer sediments (Table 1), which are preferred by more robust burrowing species (Noodt, Reference Noodt1971; Hicks & Coull, Reference Hicks and Coull1983). The patchiness of suitable sandy littoral habitats in combination with the differences between the sampling locations in abiotic and biotic variables offer a reasonable explanation for the heterogeneity in their harpacticoid composition. The coherence of the presence of harpacticoid taxa and environmental variables is further supported by the results of the ‘Biota and Environment matching’ which revealed a significant correlation of two analysed environmental variables (median grain size, TOM) and the pattern of the recorded species.
The investigation of the two sampling locations of Porto Santo in comparison with Madeira revealed a relatively low amount of different harpacticoid taxa on family as well as on species level. The main reason is certainly that steep cliffs prevented sampling of shallow waters on the north coast of Porto Santo and, therefore, only the south coast was studied which consists of a 9 km long beach (in contrast to the small-scaled sandy beaches of Madeira). Such results emphasize the importance of an intensive sampling effort, including a large number of sampling locations, in order to optimize a species inventory and validate comparisons between disjunct locations such as islands, seamounts and continental coastlines. Interestingly, all families of Harpacticoida that were found on Porto Santo and almost all species were recovered at Madeira as well, which will be discussed in the following section.
The potential function of oceanic islands and seamounts as stepping stones/staging posts for Harpacticoida
The comparison of the harpacticoid fauna of the islands Madeira and Porto Santo revealed clear similarities between both islands even though their shallow-water habitats are separated by ~40 km linear distance and up to 2500 m depth. Both sampling locations of Porto Santo show no significant differences of the Madeiran sampling locations Prainha and Porto da Cruz on family level. Furthermore they coincide with Porto da Cruz even on species level. It is likely that representatives of the respective species disperse occasionally or steadily along the Madeira Hot Spot Track from Porto Santo towards Madeira with the mainly south-west directed currents (Morton & Britton, Reference Morton and Britton2000; Sziemer, Reference Sziemer2000). The currents from Porto Santo reach Madeira most probably in the east of the island which might cause the faunal similarities of the easternmost Madeiran sampling locations with Porto Santo. However, a further highly probable reason for the similarity might be a close resemblance of the environmental conditions of these locations.
In the course of the present research project further indications for dispersal of at least some harpacticoid taxa along the Madeira Hot Spot Track have already been obtained by first comparisons of single families of Harpacticoida between Madeira, Porto Santo and Seine Seamount, which is the neighbouring seamount of Porto Santo (Packmor et al., Reference Packmor, Müller and George2015; Packmor & Riedl, Reference Packmor and Riedl2016). One species of Normanellidae, Normanella pallaresae, and three species of Paramesochridae, Paramesochra helgolandica helgolandica, Diarthrodella secunda secunda and Apodopsyllus aberrans, that occur at the coastline of Madeira were also present at Seine Seamount. Additionally Apodopsyllus aberrans was detected on Porto Santo (Table 2). Furthermore all of these species were already reported from other mostly inshore shallow-water habitats (records of the respective species are reviewed in Packmor et al. (Reference Packmor, Müller and George2015) and Packmor & Riedl (Reference Packmor and Riedl2016)). The distribution range of Paramesochra helgolandica helgolandica and Diarthrodella secunda secunda, which were previously only reported from shallow-water habitats north-east of the here investigated islands and seamounts, extends remarkably with the detection on Madeira and Seine Seamount (Packmor et al., Reference Packmor, Müller and George2015). Furthermore the disjunct distribution of Apodopsyllus aberrans and Normanella pallaresae which were found at the coast of South America and in the Mediterranean are linked with the detection on some of the elevations of the Madeira Hot Spot Track (Kihara et al., Reference Kihara, Corbisier, Gheller, Rocha and Gómez2010; Packmor et al., Reference Packmor, Müller and George2015; Packmor & Riedl, Reference Packmor and Riedl2016; present study). Altogether these results strongly indicate that seamounts and oceanic islands might play a role at least as stepping stones in the dispersal of shallow-water harpacticoid taxa supporting chance dispersal and enabling the colonization of new habitats.
The inventory of not only the Harpacticoida of the Madeiran Archipelago but also of at least some of the remaining seamounts of the investigated Hot Spot Track and additionally surrounding deep-sea habitats and coastal areas need to be proceeded in future investigations. This will enable a more detailed comparison of the seamount faunas and more profound conclusions on the mechanisms of meiofauna dispersal and the potential function of seamounts. Furthermore, recent and well-preserved sampling material of the different locations is required to allow analyses of the different populations of morphologically identical species with molecular methods. This would help in the understanding of whether seamounts and island allow a continuous faunal exchange between the different populations of harpacticoid taxa and consequently function as staging posts in the dispersal of meiofaunal organisms.
ACKNOWLEDGEMENTS
The authors are indebted to Dr Manfred Kaufmann, Dr Manuela Maranhão, Sérgio Castro, Filipe Henriques (Universidade da Madeira, Madeira Island, Portugal) and Florian Müller (Universität Oldenburg, Germany), for their help and support during the sampling on Madeira and Porto Santo. Elena Friedrich (trainee in 2013 at Senckenberg am Meer, DZMB, Germany), Lena Albers and Jutta Heitfeld (technical assistants at Senckenberg am Meer, DZMB, Germany) are thanked for their help with sorting the samples. Furthermore Tabea Riedl (bachelor student in 2014 at Senckenberg am Meer, DZMB, Germany) is thanked for her help with the determination of harpacticoids. We are grateful to Prof Dr Pedro Martínez Arbizu (Senckenberg am Meer, DZMB, Wilhelmshaven, Germany) for very helpful comments and discussions. Sincere thanks are given to Dr Brian R. Rosen (Natural History Museum, London, UK) for helpful and constructive discussion on stepping stone and staging post concepts. Two anonymous reviewers are thanked for their very helpful and supportive comments.
FINANCIAL SUPPORT
Sampling on Madeira and Porto Santo by JP and processing of parts of the derived material was financially supported by the Deutsche Forschungsgemeinschaft DFG (GE 1086/14/1).