





1 Background
The chronology of Aboriginal occupation along the middle reaches of the Murray River (aka River Murray, or Millewa in Ngintait language), an area in southeast Australia which stretches from Echuca (Victoria) to Morgan (South Australia) (Figure 1), has been of continuing interest to Australian archaeology since the establishment of the radiocarbon dating technique in the 1950s (Broecker et al. Reference Broecker, Kulp and Tucek1956). Besides aiding in the development of regional cultural chronologies on local Yorta Yorta, Barkandji, First Peoples of the Millewa Mallee, and First Peoples of the River Murray and Mallee and surrounding Countries, radiocarbon dating of samples from this region has also been used as a tool to investigate the timing and potential pathways for the peopling of Australia (e.g., Bird et al. Reference Bird, O’Grady and Ulm2016; Crabtree et al. Reference Crabtree, White, Bradshaw, Saltré, Williams, Beaman, Bird and Ulm2021), and the response of populations to significant climatic events, particularly during the Last Glacial Maximum and Holocene (Williams et al. Reference Williams, Ulm, Cook, Langley and Collard2013, Reference Williams, Ulm, Turney, Rohde and White2015, Reference Williams, Ulm, Sapienza, Lewis and Turney2018). While recent research has determined that the region has been occupied for at least the last 29,000 years (Abdulla et al. Reference Abdulla and Dillon2019; Westell et al. Reference Westell, Roberts, Morrison and Jacobsen2020), the apparent 15,000 year gap between this date and the earliest occupation dates for surrounding lake systems (Willandra Lakes World Heritage Area [Bowler et al. Reference Bowler, Jones, Allen and Thorne1970, 1998, Reference Bowler, Johnston, Olley, Prescott, Roberts, Shawcross and Spooner2003; Jankowski et al. Reference Jankowski, Stern, Foley, Jacobsen, Cadd and Smith2025] and Lake Tyrell [Richards et al. Reference Richards, Pavlides, Walshe, Webber and Johnston2007]) attracts ongoing attention and speculation (Bird et al. Reference Bird, O’Grady and Ulm2016; Garvey Reference Garvey2017; Westell et al. Reference Westell, Roberts, Morrison and Jacobsen2020). Thus, the chronology of human presence along the lower and central Murray River is of continuing interest to Australia’s archaeological community.
The collection location of samples used in this study and the previous FRE studies conducted in the Murray-Darling Basin ( Gillespie et al. Reference Gillespie, Fink, Petchey and Jacobsen2009; Wilson Reference Wilson2017 ). Map “a” (top left corner) shows the distribution of the Murray-Darling Basin within Australia, with the relevant states (“SA”: South Australia; “NSW”: New South Wales; and “VIC”: Victoria) labeled; Map “b” (top) shows the location of samples within the wider study region, along with the flow direction of groundwater within the Murray Group and Pliocene Sands Aquifers (drawn based on Evans et al. [Reference Evans, Brown, Kellett, Mackay and Eastburn1990, fig. 5.11]) and the boundaries between the different Murray River geographical regions; Maps “c” and “d” provide closer looks at the collection location of samples used in this study and includes reference letters and numbers (referred to in Table 1). Millewa is the Ngintait word for the Murray River, while Baaka and Tar-Ru are the Barkandji words for the Darling River and Lake Victoria, respectively. Made with QGIS and Natural Earth.

Figure 1. Long description
Panel A: A map of Australia highlighting the Murray-Darling Basin, with the states South Australia, New South Wales, and Victoria labeled. Panel B: A detailed map of the study region showing sample locations, groundwater flow directions within the Murray Group and Pliocene Sands Aquifers, and boundaries between different Murray River geographical regions. Panel C: A closer look at the sample collection locations near Morgan and the Murray River, including specific reference letters and numbers. Panel D: A detailed view of the sample collection locations near Echuca.
Of the radiocarbon-dated material along the middle reaches of the Murray River, freshwater shell is overwhelmingly the most frequently used (54%) (Figure 2). This is well above the Australian average (4%) (Saktura et al. Reference Saktura, Rehn, Linnenlucke, Munack, Wood, Petchey, Codilean, Jacobs, Cohen and Williams2023). The popularity of shell in the study region is likely due to its presence in a variety of archaeological site types, from middens to hearths and ancient burials (Blackwood and Simpson Reference Blackwood and Simpson1973; Clark and Hope Reference Clark and Hope1985; Gallus and Gill Reference Gallus and Gill1973; Garvey Reference Garvey2017; Prendergast et al. Reference Prendergast, Bowler, Cupper, Fairbairn, O’Connor and Marwick2009), and the extensive distribution of shell middens, which line the Murray River and other ancient and modern water sources in the region (Gill Reference Gill1973; Walker Reference Walker1981). Yet, generally in archaeology the dating of freshwater shell is discouraged. In his book, Radiocarbon Dating: An Archaeological Perspective, Taylor (Reference Taylor1987, 53), and in a later edition, Taylor and Bar-Yosef (Reference Taylor and Bar-Yosef2014, 74), recommend against the use of freshwater mollusk shell for the dating of archaeological sites unless there are no other suitable samples available and provided an appropriate investigation into the local reservoir effect has been completed. As no assessment into the local reservoir effect has been completed yet, an investigation into the freshwater reservoir effect of the middle reaches of the Murray River is critical, long overdue, and will allow for a more robust interpretation of the archaeological chronology of this region.
Frequency with which different material types have been dated along the middle reaches of the Murray River. Material located within 20 km of the Murray River between Morgan and Echuca collated from AustArch (Williams and Ulm Reference Williams and Ulm2014) and the SahulArch Radiocarbon Collection (v.2) via the OCTOPUS database (v.2) (Codilean et al. Reference Codilean, Munack, Saktura, Cohen, Jacobs, Ulm, Hesse, Heyman, Peters and Williams2022; Saktura et al. Reference Saktura, Rehn, Linnenlucke, Munack, Wood, Petchey, Codilean, Jacobs, Williams and Ulm2022) databases (n = 237). Category “Other” includes inorganic carbonate, plant material, and unknown materials. The sample list was not exhaustive as the authors noted that databases were missing certain publications which included freshwater mollusk radiocarbon dates (e.g., Garvey Reference Garvey2017), however the above data is expected to be broadly representative of the trend.

1.1 Freshwater reservoir effect
A radiocarbon reservoir effect can affect any organisms living in aquatic environments or any organism with an aquatic resource rich diet. It is primarily the result of disequilibrium between the atmospheric carbon, where 14C is formed and oxidized to CO2, and the carbon that is found in an aquatic habitat (Hajdas Reference Hajdas2008). There have been detailed investigations into the spatial variability and magnitude of the marine reservoir effect (MRE): a recent comprehensive guide to variations in the local MRE around Australian coastlines found that the marine reservoir correction (ΔR) varied from 68 ± 24 14C years to –337 ± 46 14C years, based on the analysis of bivalve mollusks collected from coastal environments (Ulm et al. Reference Ulm, O’Grady, Petchey, Hua, Jacobsen, Linnenlucke, David, Rosendahl, Bunbury and Bird2023).
The freshwater reservoir effect (FRE) has been theorized since the development of the radiocarbon dating technique in the mid-20th century (Godwin Reference Godwin1951; Libby Reference Libby1952; Oana and Deevey Reference Oana and Deevey1960) and was first measured soon afterwards in several locations around the world (Broecker and Walton Reference Broecker and Walton1959; De Vries Reference De Vries1958; Deevey et al. Reference Deevey, Gross, Hutchinson and Kraybill1954). Since these early studies, the shells of freshwater mollusks have been used alongside aquatic plants and other aquatic organisms to quantify the FRE. Despite this early realization by dating specialists, the potential influence of the FRE on archaeological remains was not recognized until the 1980s, when researchers started to test how a predominantly freshwater diet may have affected the dating of human remains and the remains of other terrestrial animals found in archaeological contexts (e.g., Bonsall et al. Reference Bonsall, Macklin, Payton and Boroneaṇt2002; Cook et al. Reference Cook, Bonsall, Hedges, McSweeney, Boronean and Pettitt2001; Eriksson et al. Reference Eriksson, Lõugas and Zagorska2003; Lanting and van der Plicht Reference Lanting and van der Plicht1996), as well as the influence that the FRE could have on the dating of other archaeological material, such as freshwater mussel shells (Hiscock Reference Hiscock1989; Magee and Hughes Reference Magee, Hughes, Ambrose and Duerden1982) and pottery (Fischer and Heinemeier Reference Fischer and Heinemeier2003; Philippsen et al. Reference Philippsen, Kjeldsen, Hartz, Paulsen, Clausen and Heinemeier2010). Published research focused on the determination of FRE offsets (Rfs) for the purpose of improving the reliability of dating using freshwater archaeomalacological material is less common (Culleton Reference Culleton2006; García-Escárzaga et al. Reference García-Escárzaga, Lombardo, Bello-Alonso, Capriles, Colonese, Dudgeon, Duarte and Fernandes2025; Gillespie et al. Reference Gillespie, Fink, Petchey and Jacobsen2009; Osterkamp et al. Reference Osterkamp, Green, Reid and Cherkinsky2014; Zhang et al. Reference Zhang, Qin, Pu, Wei and Piper2024).
The FRE is usually attributed to the introduction of older carbon through the interaction of the water body with weathered bedrock, the input of groundwater into the water body which may also be influenced by weathered bedrock (Broecker and Walton Reference Broecker and Walton1959; Deevey et al. Reference Deevey, Gross, Hutchinson and Kraybill1954), the remineralization of soil organic material (Grimm et al. Reference Grimm, Spero, Harding and Guilderson2017; Raymond et al. Reference Raymond, Bauer, Caraco, Cole, Longworth and Petsch2004; Wang et al. Reference Wang, Huntington, Osher, Wassenaar, Trumbore, Amundson, Harden, McKnight, Schiff, Aiken, Kendall and McDonnell1998), and a slower atmosphere-water mixing rate due to stratification or ice cover (affecting mainly lakes) (Abbott and Stafford Reference Abbott and Stafford1996). In addition, the extent to which a system is closed will determine how much exchange with atmospheric or active soil CO2 occurs; atmospheric CO2 has been found to contribute 40–60% of the dissolved inorganic carbon (DIC) in rivers (Broecker and Walton Reference Broecker and Walton1959; Clark and Fritz Reference Clark and Fritz1997; Hossler and Bauer Reference Hossler and Bauer2012). The size of the FRE has been known to vary from hundreds to thousands of years, even in rivers (Ervynck et al. Reference Ervynck, Boudin and Van Neer2018; García-Escárzaga et al. Reference García-Escárzaga, Lombardo, Bello-Alonso, Capriles, Colonese, Dudgeon, Duarte and Fernandes2025; Inomata et al. Reference Inomata, Sharpe, Palomo, Pinzón, Nasu, Triadan, Culleton and Kennett2022; Keith and Anderson Reference Keith and Anderson1963; Lanting and van der Plicht Reference Lanting and van der Plicht1996; Meadows et al. Reference Meadows, Lübke, Zagorska, Berziņš, Ceriņa and Ozola2014; Philippsen Reference Philippsen2013; Schneider et al. Reference Schneider, Pain, Haberle, Blong, Alloway, Fallon, Hope, Zawadzki and Heijnis2019; Yu et al. Reference Yu, Chen, Cheng, Chen and Hou2018). FRE offsets are highly variable, differing significantly from one lake to another, and within a single river (Du et al. Reference Du, Li, Hu, Bai, Li, Mughal and Qian2021; Fernandes et al. Reference Fernandes, Rinne, Nadeau and Grootes2016; Philippsen Reference Philippsen2013; Vignoni et al. Reference Vignoni, Córdoba, Tjallingii, Santamans, Lupo and Brauer2023). FREs may also vary through time with changes in the balance of hydrologic inputs (i.e., runoff, groundwater, rain, etc.: Geyh et al. Reference Geyh, Schotterer and Grosjean1998; Philippsen and Heinemeier Reference Philippsen and Heinemeier2013; Philippsen and Pigati et al. Reference Pigati, Rech, Quade and Bright2014), seasonal or long-term changes in rainfall or climate (Osterkamp et al. Reference Osterkamp, Green, Reid and Cherkinsky2014; Rech et al. Reference Rech, Tenison, Baldasare and Currie2023), and/or seasonal variations in atmospheric CO2 concentration (Levin et al. Reference Levin, Naegler, Kromer, Diehl, Francey, Gomez-Pelaez, Steele, Wagenbach, Weller and Worthy2010; Turnbull et al. Reference Turnbull, Mikaloff Fletcher, Ansell, Brailsford, Moss, Norris and Steinkamp2017). Finally, the species being dated may influence the reservoir effect reported, with variation even being recorded in individuals from the same species and population, likely as a result of individual differences in diet or vital effects (Dury et al. Reference Dury, Eriksson, Savinetsky, Dobrovolskaya, Dneprovsky, Harris, van der Plicht, Jordan and Lidén2022; Keaveney and Reimer Reference Keaveney and Reimer2012; Petchey et al. Reference Petchey, Ulm, David, McNiven, Asmussen, Tomkins, Dolby, Aplin, Richards and Rowe2013; Trofimova et al. Reference Trofimova, Alexandroff, Mette, Tray, Butler, Campana, Harper, Johnson, Morrongiello and Peharda2020).
Understanding the source of carbon in mollusk shell formation is necessary to understanding how reservoir effects play out. Mollusk shell is composed of calcium carbonate (CaCO3) bound within a crystalline structure along with organic substances (polysaccharides, lipids, pigments, proteins, etc.) (Marin et al. Reference Marin, Le Roy and Marie2012; Schöne and Krause Reference Schöne and Krause2016). The shell’s calcium carbonate is formed by calcium ions (Ca2+) and bicarbonate ions (HCO3 –), following the equation:
 ${\rm{C}}{{\rm{a}}^{2 + }} + \;{\rm{HC}}{{\rm{O}}_3}^ - \; \to {\rm{CaC}}{{\rm{O}}_3} + \;{{\rm{H}}^ + }$
As such, the carbon in the shell derives from bicarbonate ions which enter the mollusks’ system via food and water consumed by the mollusk, and by diffusion with ambient environmental water (Marin et al. Reference Marin, Le Roy and Marie2012). A small number of these bicarbonate ions may also be acquired through the hydration of carbon dioxide, a metabolic process catalyzed by the enzyme carbonic anhydrase and used to maintain the correct acid-base balance in the body, particularly at calcification sites (Marin et al. Reference Marin, Le Roy and Marie2012; McConnaughey and Gillikin Reference McConnaughey and Gillikin2008). While it is believed that the majority of carbon in the shell of aquatic mollusks is derived from environmental DIC, a small percentage may be derived from respired or metabolic carbon, acquired through dietary organic carbon (McConnaughey and Gillikin Reference McConnaughey and Gillikin2008). McConnaughey and Gillikin (Reference McConnaughey and Gillikin2008) predict the contribution of respired carbon to mollusk shell, and therefore shell 14C, to be about 10% in aquatic mollusks, although some studies have found evidence that this number may be either smaller or much greater depending on the taxa (e.g., 2% metabolic carbon incorporation for taxa Melanoides tuberculata (Shanahan et al. Reference Shanahan, Pigati, Dettman and Quade2005); approximately 20% metabolic carbon incorporation for Amblema plicata and approximately 40% metabolic carbon incorporation for Cyrtonaias tampicoensis (Van Plantinga and Grossman Reference Van Plantinga and Grossman2018); and up to 49% recorded in Corbicula fluminea shells under tank experiment conditions (Yan et al. Reference Yan, Dettman, Chen and Shen2020). In sum, 14C measured in mollusk shell should generally be in equilibrium with the ambient water’s DIC content, however it may also be responding to other variables such as the animals’ physiology.
Investigations into FRE of mollusks in Australia are limited. In the 1980s, Hiscock, Magee, and Hughes considered the magnitude of FRE affecting archaeological freshwater mussel shells (Alathyria spp.) excavated and dated from Colless Creek Cave, Lawn Hill, QLD (Hiscock Reference Hiscock1989; Magee and Hughes Reference Magee, Hughes, Ambrose and Duerden1982). They measured 14C content of a live-collected mussel from the nearby creek, collected during the period of their excavations and concluded that the Rf was <1000 years. Gillespie et al. (Reference Gillespie, Fink, Petchey and Jacobsen2009) investigated historically collected (assumed live-collected) bivalve mollusks (four Velesunio ambiguus and one Alathyria jacksoni) from riverine and stream locations throughout the Murray-Darling basin of NSW with a focus on understanding the FRE impacting the highly significant Willandra Lakes World Heritage Area. The study analyzed samples from the Murrumbidgee River and the Darling River drainage systems (sites upstream from the current study region) (Figure 1). The results showed a difference in Rf between the Murumbidgee (weighted average value of +93 ± 23 14C years)Footnote 1 and the Darling River in northern NSW (weighted average value of –39 ± 22 14C years)a, values interpreted as being too small to have a significant influence on the Pleistocene archaeology of the Willandra Lakes World Heritage Area (Gillespie et al. Reference Gillespie, Fink, Petchey and Jacobsen2009). Yet, a negative Rf, as reported by Gillespie et al. (Reference Gillespie, Fink, Petchey and Jacobsen2009) for the Darling River, is unusual and requires further explanation which was not provided by the original study. While samples VA-1 and VA-3 are within 1σ or 2σ uncertainties of zero, sample VA-2 is greater than 2σ uncertainties from zero and therefore should be considered unreliable without a better understanding of any additional processes or factors which may have influenced these results. As such, we propose VA-2 should be removed from the calculation of the Rf weighted average value for the Darling River in northern NSW. The new weighted average value is –28 ± 13 14C years.a
In addition, Wilson (Reference Wilson2017) assessed the FRE for the lower Murray River in South Australia by dating historically collected (assumed live-collected) V. ambiguus samples from four locations in the state (Lake Bonney, Murray River at Berri, Lake Alexandrina, and Murray River at Mannum; Figure 1), alongside six paired charcoal and V. ambiguus shell archaeological samples. From these results, Wilson calculated a weighted mean Rf value of 219 ± 178 14C yearsa, demonstrating a larger reservoir effect than that reported in the Gillespie et al. (Reference Gillespie, Fink, Petchey and Jacobsen2009) study. Despite these findings, there is still a need to investigate the more central portions of the Murray River, given the variability in FREs found along rivers (Philippsen Reference Philippsen2013), and the complexity of Murray River hydrology, which includes surface water inflows from several tributaries, as well as varying contributions from groundwater and precipitation (Leblanc et al. Reference Leblanc, Tweed, Van Dijk and Timbal2012). Furthermore, while the majority of the previous FRE studies were completed on the freshwater mussel V. ambiguus, a species which prefers slow-moving waters such as lakes, there is a demand for an investigation using A. jacksoni, a freshwater river mussel also frequently found in archaeological contexts and recently used extensively in dating programs, in particular to determine the earliest radiocarbon dates for the Riverine region of South Australia (Westell et al. Reference Westell, Roberts, Morrison and Jacobsen2020, Reference Westell, Roberts and Fairhead2024). Thus, this research aims to measure the freshwater reservoir effect for the middle reaches of the Murray River, encompassing the region from Morgan, South Australia, to Echuca, Victoria, using A. jacksoni to improve the interpretation of the archaeological chronology in the region.
1.2 Study area
1.2.1 History and geography of the Murray River
The Murray River is Australia’s largest river, flowing for 2,575 km from its headwaters in the Australian Alps in the country’s southeast, before opening into the Indian Ocean in South Australia (Figure 1). The Murray River is one of the main surface water drainage channels for the Murray Darling Basin (MDB), which spans an area of 1.06 million km2 in eastern Australia. The river has three major tributaries (Darling, Goulburn, and Murrumbidgee Rivers). The length of the Murray River can be divided into 5 broad geographical zones (from upstream to downstream): the Headwaters (450 km reach; Figure 1: R1-R2), the Riverine Plain (800 km reach; Figure 1: R2-R3), the Mallee Trench (850 km reach; Figure 1: R3-R4), the Murray Gorge (280 km reach; Figure 1: R4-R5) and the Lakes and Coorong (Mackay Reference Mackay, Mackay and Eastburn1990) (Figure 1: R5-Ocean). Samples for this study were collected from the Riverine Plain, the Mallee Trench, and the Murray Gorge zones.
As previously mentioned, the middle reaches of the Murray River, specifically the geographical zone of the Mallee Trench, has been settled by Aboriginal communities for at least 29,000 years (Abdulla et al. Reference Abdulla and Dillon2019; Westell et al. Reference Westell, Roberts, Morrison and Jacobsen2020). European settlement of the river and the clearing of native vegetation for the instigation of European farming techniques began from the early 1800s, although the clearing of native vegetation occurred in earnest with the passing of the Crown Lands Alienation Act in 1861 (Bradshaw Reference Bradshaw2012). Paddle steamers were used to transport goods on the river from 1853 (Prideaux Reference Prideaux, Prideaux and Cooper2009). The first irrigation colonies were built at Mildura and Renmark in 1887, and river regulation began in 1922, with the building of 13 locked weirs, barrages, and offstream storage, such as Hume Dam and the development of Lake Victoria. The locked weirs on the lower Murray River have converted the reach from the Murray-Darling confluence to Blanchetown, downstream of Morgan (SA), to a series of low-energy pool environments with reduced flow velocities, which has implications for river wildlife, such as mollusks (Walker and Thoms Reference Walker and Thoms1993), although management of weir pools in recent years has shifted to promote variability (Tonkin et al. Reference Tonkin, Moloney, Lyon, Kitchingman, O’Mahony, Raymond, Hackett, Saddlier, Greenfield and Wood2022). The Murray-Darling Basin supports 40% of all Australian farms and helps to produce AUD$30 billion of food and other agricultural products every year (Australian Government [Murray-Darling Basin Authority] 2024 Sept 17).
The Murray is a relatively slow-flowing, suspended load river with naturally highly variable discharge (Rutherfurd Reference Rutherfurd, Schumm and Winkley1994). Prior to flow regulation, overbank flooding occurred biennially, and flooding continues following river management (Rutherfurd Reference Rutherfurd, Schumm and Winkley1994), with the last major flood event occurring between November 2022 and February 2023. For almost its entire extent, the Murray River flows within the confines of a large paleo-channel. Between Tocumwal (River Plains) and Wakool Junction (Mallee Trench) the river changes from an incised meandering system confined within the ancient channel, to an unconfined vertically aggrading anastomosing channel system, affecting channel capacity and flood behavior (Clark et al. Reference Clark, McPherson, Cupper, Collins, Nelson, Landgraf, Kübler, Hintersberger and Stein2017; Rutherfurd Reference Rutherfurd, Schumm and Winkley1994; Rutherfurd and Kenyon Reference Rutherfurd and Kenyon2005). This change occurred in response to seismic activity, channel avulsion and climatic factors ca. 45 ka (Rutherfurd and Kenyon Reference Rutherfurd and Kenyon2005; Clark et al. Reference Clark, McPherson, Cupper, Collins, Nelson, Landgraf, Kübler, Hintersberger and Stein2017). In the Mallee Trench reach, from the Murray-Darling confluence to the beginning of the Murray Gorge reach, the Murray meanders with increasing size through a wide floodplain (5–10 km) thanks to the easily eroded Mallee sands (Rutherfurd Reference Rutherfurd, Mackay and Eastburn1990). After entering the Murray Gorge reach at Overland Corner, the modern Murray channel varies between running through a narrow gorge with steep cliffs on either side, thick limestone beds incised by the paleo-river, and running through wetlands (Eastburn Reference Eastburn, Mackay and Eastburn1990; Rutherfurd Reference Rutherfurd, Mackay and Eastburn1990). Groundwater is known to enter the river at the beginning of the Mallee Trench and the Murray Gorge reaches (Evans and Kellett Reference Evans and Kellett1989; Evans et al. Reference Evans, Brown, Kellett, Mackay and Eastburn1990; Mackay Reference Mackay, Mackay and Eastburn1990).
1.2.2 Hydrogeology of the Murray River and potential 14C sources
Riverine carbon is composed of two main types: organic carbon and inorganic carbon, each of which can be found in dissolved or particulate forms. As the basis of aquatic mollusk shell formation, DIC is of most interest to this study. Sources of riverine DIC include (1) atmospheric CO2, (2) carbonate/silicate weathering, (3) soil CO2 derived from the respiration of soil, and (4) mineralization of organic matter within the river. DIC from soil CO2 and carbonate/silicate weathering may enter the river via groundwater as well as through surface water. Each source has a different 14CDIC signature which may influence the overall 14CDIC value of the river. Sources (2)–(4) have the potential to introduce carbon aged hundreds to thousands of years old into the system, whereas carbon derived from carbonate weathering may be even older (Dean et al. Reference Dean, Coxon, Zheng, Bishop, Garnett, Bastviken, Galy, Spencer, Tank and Tipper2025; Raymond et al. Reference Raymond, Bauer, Caraco, Cole, Longworth and Petsch2004), therefore these sources are of most concern to the freshwater reservoir effect.
Geologically, the Murray River and the study area sit within the Murray Basin, a shallow, disc-shaped, intra-cratonic basin formed over the last 65 million years (Brown and Stephenson Reference Brown and Stephenson1991; Lawrence Reference Lawrence1966). The 297,000 km2 basin is almost completely bordered by a subdued mountain range which prevents groundwater escaping the basin except as surface water or through evaporation where the water table meets the ground surface (Evans et al. Reference Evans, Brown, Kellett, Mackay and Eastburn1990). The sedimentation across the Murray Basin is a product of the marine, alluvial, lacustrine, and aeolian processes which occurred over the last 65 million years (Bowler et al. Reference Bowler, Kotsonis and Lawrence2006; Brown and Stephenson Reference Brown and Stephenson1991; Lawrence Reference Lawrence1966). These sediments and the resulting stratigraphy have, in turn, influenced the recharge, flow, and discharge of the different aquifer systems within the basin (the Renmark Group, the Murray Group, the Pliocene Sands Aquifer and the Shepparton Formation) the dynamics of which have been discussed in detail by others (Cartwright et al. Reference Cartwright, Weaver, Stone and Reid2007; Evans et al. Reference Evans, Brown, Kellett, Mackay and Eastburn1990; Murray-Darling Basin Commission 1999).
Carbonate sedimentary geology, which may be a source of carbonate weathering in the Murray River (2), exists within several formations of the MDB, from limestone dated to the Lower Devonian to fine earth and carbonate nodules found in Late Pleistocene formations, such as the Kyalite Member of the Woorinen Formation, the Mollineaux-Lowan Sands, and the Bunyip Sands (Brown and Stephenson Reference Brown and Stephenson1991). Pedogenic carbonate of varying ages is also present within the MDB (Bowler and Polach Reference Bowler, Polach and Yaalon1971; Callen et al. Reference Callen, Wasson and Gillespie1983; Williams and Polach Reference Williams and Polach1969). The modern Murray River predominantly sits within the Late Pleistocene to Holocene aged Coonambidgal Formation and associated alluvial deposits which are composed of unconsolidated, grey, red-brown, silt, silty clay, sand and gravel (Brown and Stephenson Reference Brown and Stephenson1991). At times it intersects older carbonate rich layers, such as the Mannum Formation of Murray Group Limestones, however generally this occurs outside of the study region (Brown and Stephenson Reference Brown and Stephenson1991). Ultimately, carbonate weathering in the MDB is believed to be relatively low with <10% of the Murray’s dissolved load resulting from carbonate dissolution (Gaillardet et al. Reference Gaillardet, Dupré, Louvat and Allègre1999). While silicate weathering is believed to make up a larger proportion of the Murray’s total dissolved load (Gaillardet et al. Reference Gaillardet, Dupré, Louvat and Allègre1999), its isotopic composition will reflect that of the soil CO2 (Yao and Gao Reference Yao and Gao2006).
Soil CO2 (3) is derived from the respiration or remineralization of soil organic matter (SOM) which is then washed into the river through surface water and groundwater. The 14C content of remineralized soil organic matter (SOM) is primarily controlled by the relative decomposition of SOM with a long turnover time (decades to thousands of years, aka the “passive pool”) vs. SOM with a relatively fast turnover time (days to years, aka the “fast pool”), and the metabolic respiration of plants (Wang et al. Reference Wang, Huntington, Osher, Wassenaar, Trumbore, Amundson, Harden, McKnight, Schiff, Aiken, Kendall and McDonnell1998; Trumbore Reference Trumbore2000). The latter is usually in equilibrium with atmospheric 14CO2 (Trumbore Reference Trumbore2000). In comparison, SOM is remineralized through the action of heterotrophic respiration, in which microbes release CO2 as a by-product of their consumption of organic carbon (Gougoulias et al. Reference Gougoulias, Clark and Shaw2014). The resulting CO2 should have a 14C value equal to that of the soil organic matter being decomposed (Trumbore Reference Trumbore2000). Recent modeling of global soil carbon age based on their relationship with environmental drivers predicts that the top 1 m of soil in southeast Australia has a mean age of approximately 1–4 ka, however its Δ14C signature is modeled to be between –200 to –100‰ (or ca. 1–2 ka in age) due to the influence of “bomb” 14C, resulting from atmospheric nuclear testing in the 1950s and 1960s (Shi et al. Reference Shi, Allison, He, Levine, Hoyt, Beem-Miller, Zhu, Wieder, Trumbore and Randerson2020). The age of SOM generally increases with depth, and soil type has also been found to influence age, with the oldest 14C ages found in soils with the highest clay content, which is important as various geological formations around the Murray River contain clay (e.g., Shepparton formation, Woorinen formation, Coonambidgal formation) (Brown and Stephenson Reference Brown and Stephenson1991; Scharpenseel and Becker-Heidmann Reference Scharpenseel and Becker-Heidmann1992; Shi et al. Reference Shi, Allison, He, Levine, Hoyt, Beem-Miller, Zhu, Wieder, Trumbore and Randerson2020). The environment and climate may also influence the rate of microbial activity. Precipitation and temperature have been identified as controlling factors for soil organic carbon in southeast Australia (Hobley et al. Reference Hobley, Wilson, Wilkie, Gray and Koen2015, Reference Hobley, Baldock, Hua and Wilson2017). Shifts from flooding to drying have also been shown to affect the composition of microbial communities in the soil and effect the rate of soil respiration, while drought can have long-term negative effects on soil respiration that can last long after the event has ended (Lellei-Kovács et al. Reference Lellei-Kovács, Botta-Dukát, Ónodi, Mojzes and Kröel-Dulay2025; Zheng et al. Reference Zheng, Wang, Yu, Jia, Liu, Wang and Zhang2021; Zhu et al. Reference Zhu, Jia, Mei, Wu and Huang2023). Furthermore, land-use can impact soil carbon by increasing the rate of SOM decomposition through the implementation of practices such as tilling and improved drainage, and by the removal of plant biomass from the surface (Gougoulias et al. Reference Gougoulias, Clark and Shaw2014; Hobley et al. Reference Hobley, Wilson, Wilkie, Gray and Koen2015), leading to great losses of young carbon down the entire soil profile (Hobley et al. Reference Hobley, Baldock, Hua and Wilson2017). As a result, the 14C signature of soil CO2 entering the Murray River could be quite wide, and the factors impacting this are extremely complex.
The groundwater of the Murray Basin has been of continuing interest to researchers due to issues of salinization caused, in part, by the clearing of native vegetation and the development of irrigation (Allison et al. Reference Allison, Cook, Barnett, Walker, Jolly and Hughes1990; Cartwright et al. Reference Cartwright, Weaver, Stone and Reid2007; Evans et al. Reference Evans, Brown, Kellett, Mackay and Eastburn1990; Murray-Darling Basin Commission 1999). The Murray Group aquifer, receiving water from recharge areas in the southern Wimmera (south/central western Victoria) as well as from leakage from the Renmark Group aquifer, discharges straight into the Murray River between Loxton and Morgan in South Australia, and at various other points downstream of the Murray-Darling confluence (Cartwright Reference Cartwright2010; Evans et al. Reference Evans, Brown, Kellett, Mackay and Eastburn1990) (Figure 1). Both the Renmark Group and Murray Group aquifer systems include carbon-rich geological layers which provide the opportunity for radioactively dead carbon to enter the groundwater (Brown and Stephenson Reference Brown and Stephenson1991). Most of the water in this system is estimated to have recharged >30 ka during a wetter climatic period (Cartwright et al. Reference Cartwright, Weaver, Cendón, Fifield, Tweed, Petrides and Swane2012; Leaney and Herczeg Reference Leaney and Herczeg1999). Overlying the Murray Group aquifer system and stretching to the east is the Pliocene Sands aquifer system, composed of the Loxton-Parilla Sands to the west, and Calivil Formation to the east, which is interconnected with the Renmark Group aquifer (Figure 1). The Pliocene Sands aquifer system discharges into the Murray River near Robinvale and the Mallee Cliffs where the Murray has incised the Loxton-Parilla Sands, a component of the aquifer (Evans and Kellett Reference Evans and Kellett1989; Evans et al. Reference Evans, Brown, Kellett, Mackay and Eastburn1990). Some water from the Pliocene Sands aquifer and partially-overlying Shepparton Formation aquifer system has been dated to >30 ka, however the majority of water is suggested to be <30 ka with ages of 15–25 ka occurring at approximately 40–60 m depths (Cartwright et al. Reference Cartwright, Weaver, Tweed, Rivera and Guerrero2008, Reference Cartwright, Weaver, Cendón, Fifield, Tweed, Petrides and Swane2012). Upstream of Robinvale, the Murray River is predominantly a losing stream (Ross and Williams Reference Ross and Williams2024). Therefore, the Murray River may be influenced by old carbon derived from groundwater with long residence times and ancient carbon interactions. However, given that baseflow is 1–2% of the total discharge, old carbon deriving from groundwater is unlikely to have a significant effect on the overall DIC of the Murray River (Cartwright et al. Reference Cartwright, Hofmann, Sirianos, Weaver and Simmons2011; Simpson and Herczeg Reference Simpson and Herczeg1991).
Mineralization of organic matter within the river (4) may contribute a broad 14C signature to the overall river 14CDIC value as the organic matter may derive from modern plants, recent or aged soil organic matter, or aquatic organisms such as phytoplankton (Marwick et al. Reference Marwick, Tamooh, Teodoru, Borges, Darchambeau and Bouillon2015; Raymond et al. Reference Raymond, Bauer, Caraco, Cole, Longworth and Petsch2004). The proportion of these different sources within the river are known to be impacted by various factors such as human land use (Lu et al. Reference Lu, Bauer, Canuel, Chambers, Yamashita, Jaffé and Barrett2014), impoundment (Wang et al. Reference Wang, Liu, Wang, Liu, Li, Guan, Yao and Wu2011), and flooding events (Bianchi et al. Reference Bianchi, Garcia-Tigreros, Yvon-Lewis, Shields, Mills, Butman, Osburn, Raymond, Shank and DiMarco2013), however the impact that these changes have on the 14CDIC is complex and hard to determine.
While no previous studies have investigated 14C variation in the Murray River water, Cartwright (Reference Cartwright2010) conducted a study focused on identifying the sources of carbon in the river. After measuring a diverse range of geochemical signatures, they concluded that DIC concentrations and δ13CDIC measured along the river could be explained by the steady input of organically derived carbon, from either the mineralization of organic carbon in the river or input of soil water into the river, combined with the evasion of CO2 to the atmosphere. This conclusion, Cartwright (Reference Cartwright2010) argued, explains the high DIC concentrations in the river alongside the observed δ13CDIC range (−9.5 to −4.8‰).
A recent study on the age of inorganic carbon in rivers around the globe found that the majority of CO2 emitted from rivers (52 ± 16%) was derived from millennial aged carbon, i.e. carbon that is hundreds to several thousand years old (Dean et al. Reference Dean, Coxon, Zheng, Bishop, Garnett, Bastviken, Galy, Spencer, Tank and Tipper2025). The study found that catchment size, river lithology, and river biome all had a significant influence on the age of the river DIC and/or CO2. Certain environmental parameters, such as mean annual precipitation and mean elevation, were also important for catchments >10 km2, such as the MDB (Dean et al. Reference Dean, Coxon, Zheng, Bishop, Garnett, Bastviken, Galy, Spencer, Tank and Tipper2025).
2 Materials and methods
2.1 Water collection and analysis
Water samples for radiocarbon analysis of DIC were collected from four sites along the Murray River in May 2024 (Figure 1). Samples were collected approximately 50 cm below the surface of the water. 1 L of water was filtered in the field using Stericup® 0.45 μm 150 mL filters and stored in opaque plastic bottles. Samples were kept cold during transportation and refrigerated below 4°C when in the lab. Samples were analyzed within three weeks of collection.
The DIC in the water was processed for radiocarbon analysis at the Australian Nuclear Science and Technology Organisation (ANSTO) Centre for Accelerator Science. The samples were sub-sampled for radiocarbon dating in a glove box under a nitrogen atmosphere. CO2 was extracted from the water by treatment with 85% H3PO4 and cryogenically collected in a glass tube containing silver wires (Hua et al. Reference Hua, Jacobsen, Zoppi, Lawson, Williams, Smith and McGann2001). The sample tube was placed in a furnace at 600 °C overnight to eliminate possible SOx associated with sample CO2.
Other physico-chemical water properties were measured alongside this study and are described in the Supplementary Material (Appendix 2).
2.2 Shell
Historical shell and modern bivalve shell samples were used in this study. All specimens were identified as belonging to the species Alathyria jacksoni Iredale, 1934 (Family: Hyriidae), aka Southern River Mussel, a freshwater mussel species which is commonly found in archaeological shell middens along the Murray River and used for previous dating studies (Garvey Reference Garvey2017; Prendergast et al. Reference Prendergast, Bowler, Cupper, Fairbairn, O’Connor and Marwick2009; Westell et al. Reference Westell, Roberts, Morrison and Jacobsen2020). This species is a filter feeder that is endemic to the MDB, preferring habitats of moderate to strong river currents (Walker Reference Walker1981; Walker et al. Reference Walker, Byrne, Hickey, Roper, Bauer and Wächtler2001). It is relatively sympatric with the related species, Velesunio ambiguus Philippi, 1847, aka the Billabong Mussel, although the latter has a wider distribution and prefers more lentic habitats, such as lakes and billabongs (Baker et al. Reference Baker, Sheldon, Somerville, Walker and Hughes2004; Walker Reference Walker1981). Identifications were made by author CS with the help of the literature (i.e., Ponder et al. Reference Ponder, Hallan, Shea, Clark, Richards, Klunzinger and Kessner2024) or by specialists in museum settings. All specimens used here are believed to have been collected live: although this was not always stated explicitly in the museum collection records for the historical shells, authors observed minimal wear to the periostracum which would suggest live-collection.
2.2.1 Historical shell
Eight historically collected shells from the middle reaches of the Murray River were selected for radiocarbon dating. These specimens were loaned from Museums Victoria and the Australian Museum collections. All shells are assumed to have been live-collected and were collected prior to the influence of bomb radiocarbon starting in 1955 (Table 1).
Collection details for material used in this study.

Table 1. Long description
The table contains 19 rows and 7 columns. The columns are labeled as follows: Map, Museum in-house sample number, Material, Collection year, Collection location, Coordinates, and Collected by. The rows provide specific details for each sample collected. Row 1: Map 1, F23860-1 (MV), Shell, 1952, Murray River at Morgan, First Peoples of the River Murray and Mallee Country, 34°14’ S, 139°40’12’’ E, F.S. Colliver. Row 2: Map 2, C.57944 (AM), Shell, 1857, Junction of Murray and Darling Rivers, reedy lake, Barkandji Country, 34°25’08’’ S, 142°0’12’’ E, W. Blandowski. Row 3: Map 3, F1376-1 (MV), Shell, 1857, Vicinity of junction of Murray and Darling Rivers [precise locality not known], W. Blandowski. Row 4: Map 4, F1146-1 (MV), Shell, 1857, Vicinity of junction of Murray and Darling Rivers [precise locality not known], Barkandji and First People of the Millewa Mallee Country, 34°6’43’’ S, 141°54’25’’ E, W. Blandowski. Row 5: Map 5, C.57946 (AM), Shell, 1857, Murray and Darling Rivers junction, W. Blandowski. Row 6: Map 6, F14703 (MV), Shell, 1857, Mondellimin [near Merbein], First People of the Millewa Mallee Country, 34°9’54’’ S, 142°4’51’’ E, W. Blandowski. Row 7: Map 7, C.61703 (AM), Shell, 1857, 17 km (10 mi) S of Murray-Darling junction, W. Blandowski. Row 8: Map 8, C.43062 (AM), Shell, 1940, Echuca, Murray River, Yorta Yorta Country, 36°7’59’’ S, 144°45’0’’ E, M. Ward. Row A: Map A, MOR-1, Water, 14 May 2024, Murray River at Morgan, SA, First Peoples of the River Murray and Mallee Country, 34°14’ S, 139°40’12’’ E, CS & AP. Row B: Map B, LOX-1, Water, 14 May 2024, Murray River at Loxton, SA, First Peoples of the River Murray and Mallee Country, 34°26’5’’ S, 140°37’12’’ E, CS & AP. Row C: Map C, MRM-1, Water, 15 May 2024, Murray River at Neds Corner, VIC, First People of the Millewa Mallee Country, 34°12’28’’ S, 142°15’3’’ E, CS & AP. Row D: Map D, MER-1, Water, 15 May 2024, Murray River at Merbein, VIC, First People of the Millewa Mallee Country, 34°19’18’’ S, 142°4’51’’ E, CS & AP. Row E: Map E, MRS-M0070, Shell, 18, September 2023, Millewa Creek at MUL1, VIC, First People of the Millewa Mallee Country, 34°7’19’’ S, 141°8’6’’ E, CS. Row CS E: Map CS E, MRS-M0072, Shell, 18, September 2023, Millewa Creek at MUL2, VIC, First People of the Millewa Mallee Country, 34°7’19’’ S, 141°8’6’’ E, CS. Row CS F: Map CS F, MRS-M0044, Shell, 20 April 2022, Millewa Creek at MUL2, VIC, First People of the Millewa Mallee Country, 34°6’54’’ S, 141°9’21’’ E, CS. Row G: Map G, MRS-M0066, Shell, 19, September 2023, Murray River at Neds Corner, Station boat ramp, VIC, First People of the Millewa Mallee Country, 34°9’6’’ S, 141°19’51’’ E, CS. Row CS G: Map CS G, MRS-M0068, Shell, 19, September 2023, Murray River at Neds Corner, Station boat ramp, VIC, First People of the Millewa Mallee Country, 34°9’6’’ S, 141°19’51’’ E, CS.
a MV = Museums Victoria; AM = Australian Museum.
b Samples are recorded in the Australian Museum database as being collected in 1869, but we have determined that this is likely incorrect (see text).
c Longitude and Latitude estimated based on location description.
Six shells are recorded as being collected by Wilhelm Blandowski, whose sole excursion to the Murray/Darling junction occurred from December 1856 to late 1857 prior to his return to Germany in 1859 (Darragh Reference Darragh2009). It is therefore believed that the three specimens from the Australian Museum documented as being collected by Blandowski in 1869 (C.57944; C.57946; C.61703), were actually collected in 1857 during the same expedition after which they were gifted to the Australian Museum in 1861 or 1862 (Darragh Reference Darragh2009).
The shells from Museums Victoria (F23360-1; F13736-1; F13140-1; F13141-1) were sampled at the ANSTO Radiocarbon Laboratory, while the other shells were sampled in-house at the Australian Museum. Periostracum was first removed and the shell surface was cleaned by abrasion with a Dremel® tool. A diamond cutting wheel bit, first cleaned with acetone and ethanol, was then used to remove a thin portion of shell close to the ventral edge (approx. 10–20 mm × 5 mm; 10–30 mg). This was to capture the 14C value at the time of death, minimize the amount of time averaging, and reduce the impact on museum specimens by avoiding diagnostically significant areas, such as the hinge, while still having sufficient material for analysis.
2.2.2 Modern shell
Five modern shells were sampled for radiocarbon dating. These samples were collected in April 2022 and September 2023 from the Murray River near Neds Corner Station, and Mullaroo Creek, an anabranch of the Murray River (Figure 1). Samples were collected from the riverbed, at approximately 1.5 m depth. For further collection details for each specimen, see Table 1.
Shell MRS-M0044 was coated in metal epoxy resin (JB Weld® Kwikweld) and then cut into an approximately 3 mm thick section using a low-speed saw (Buehler® Isomet 1000 Precision Saw). Carbonate powder was milled from the ventral edge of the shell section (OZBJ10) using a Rexim Minimo drill attached to a stereo light microscope at the School of Geography, Earth and Atmospheric Sciences at the University of Melbourne. The drill bit was first cleaned with alcohol and ethanol.
A period of growth near the ventral edge was sampled from the four modern specimens collected in September 2023. A piece of the final growth band (approx. 2 mm thick along the direction of growth) was cut from the ventral edge of each shell using drilling tools, first cleaned with acetone and ethanol, at the School of Geography, Earth and Atmospheric Sciences at the University of Melbourne.
2.2.3 Shell preparation
All shell preparation and analyses were conducted at the ANSTO Centre for Accelerator Science at Lucas Heights, Australia. Samples were etched with 0.5 M HCl for 0.5–3 min at room temperature, depending on sample size and fragility. The powdered sample (OZBJ10) was not etched. Most samples were also ultrasonicated during this process, except for those determined to be too fragile or fragmented. Samples were rinsed with Milli-Q water and dried in the oven overnight at 60 °C. Hydrolysis was performed with 85% H3PO4 at 90 °C overnight and the resulting CO2 was cryogenically purified (Hua et al. Reference Hua, Jacobsen, Zoppi, Lawson, Williams, Smith and McGann2001).
2.3 Graphitization, 14C measurement, and data analysis
All CO2 from the water DIC and shell samples was converted to graphite using H2 and Fe catalyst at 600 °C (Hua et al. Reference Hua, Jacobsen, Zoppi, Lawson, Williams, Smith and McGann2001) for AMS 14C measurement on the 1MV VEGA Accelerator at ANSTO (Wilcken et al. Reference Wilcken, Hotchkis, Levchenko, Fink, Hauser and Kitchen2015). A portion of graphite was used for IRMS δ13C measurement for fractionation correction. The 14C results are reported in percent Modern Carbon (pMC) and Conventional Radiocarbon age (CRA) in year BP defined according to Stuiver and Polach (Reference Stuiver and Polach1977). Reporting of results follows conventions set out in Millard (Reference Millard2014).
Following the method used by Gillespie et al. (Reference Gillespie, Fink, Petchey and Jacobsen2009), a FRE offset (Rf) for historically collected shell specimens was calculated using the following equation:
 $Rf = Rs\left( t \right) - Rg\left( t \right)$
where Rs(t) is the conventional radiocarbon age of the specimen measured by AMS, and Rg(t) is the atmospheric radiocarbon age for the collection year (determined using R packages “rintcal” and “rice” [Blaauw Reference Blaauw2022, Reference Blaauw2024] and SHCal20 calibration curve for pre-bomb samples [Hogg et al. Reference Hogg, Heaton, Hua, Palmer, Turney, Southon, Bayliss, Blackwell, Boswijk and Bronk Ramsey2020]). The uncertainty of Rf is the uncertainty of the 14C measurement (1σ) of the individual sample, following Ulm et al. (Reference Ulm, O’Grady, Petchey, Hua, Jacobsen, Linnenlucke, David, Rosendahl, Bunbury and Bird2023). A weighted mean average was estimated using Bevington (Reference Bevington1969).
To calculate the FRE offset of modern collected samples (RfM), we used the following equation (Philippsen Reference Philippsen2013, 2; Rech et al. Reference Rech, Tenison, Baldasare and Currie2023, 2):
 ${\rm R{f_{\it{M}}}} = 8033 \cdot {\rm In}\left( {{{pM{C_{atm}}} \over {pM{C_{aq}}}}} \right)$
where pMC aq is the pMC value of the aquatic specimen (water DIC or mollusk shell) measured by AMS, and pMC atm is the atmospheric 14C content in pMC measured at Baring Head, Wellington, New Zealand for that collection month (Turnbull et al. Reference Turnbull, Mikaloff Fletcher, Ansell, Brailsford, Moss, Norris and Steinkamp2017). Each atmospheric 14C value used was the weighted mean of two separate measurements. As no value for May 2024 was available at the time of manuscript writing, we used the March 2024 value in its place as the two values were likely to be very similar given they were only two months apart (pers. comm. J. Turnbull). Previous studies have shown that this data is generally comparable to that collected from southeast Australia (Turnbull et al. Reference Turnbull, Mikaloff Fletcher, Ansell, Brailsford, Moss, Norris and Steinkamp2017). As such the final data points compared to the modern shell and water samples in this study were (all pMC): 100.94 ± 0.11 (April 2022); 100.82 ± 0.17 (September 2023); 100.36 ± 0.18 (May 2024).
Similar to the historical shells, uncertainty of RfM only considered the uncertainty of the 14C measurement of the individual sample. It was calculated as follows:
 ${\rm \sigma \;of\;R{f_{\it{M}}}} = 8033 \cdot {{\sigma pM{C_{aq}}} \over {pM{C_{aq}}}}$
where σpMC aq refers to the error associated with pMC aq .
Δ14C for water samples was calculated to compare to existing research. It was calculated using equations set out in Shi et al. (Reference Shi, Allison, He, Levine, Hoyt, Beem-Miller, Zhu, Wieder, Trumbore and Randerson2020, 1):
 ${{\it{\Delta}}^{14}}{\rm{C}} = \left[ {\left( {\frac{{pMC}}{{100}}} \right) \times {e^{\lambda \left( {1950 - {Y_c}} \right)}} - 1} \right] \times 1000$
where pMC is the pMC value for that sample, λ is 1/(true half-life) of radiocarbon (1/8267 or 0.00012097), and Yc is the year of collection. Uncertainties for Δ14C were calculated using the following equation:
 $\sigma {{\it{\Delta}}^{14}}{\rm{C}} = 10 \times {e^{\lambda \left( {1950 - {Y_c}} \right)}} \times \sigma pMC$
where λ and Yc are as above, and
 $\sigma pMC$
is the 1σ error of the pMC value of the same sample.
3 Results
3.1 Historical shells
Radiocarbon ages between 204 ± 22 and 638 ± 24 years BP result in estimated Rf of 55 ± 22 to 477 ± 24 14C years (Figure 3 and Table 2). The sample from Morgan, SA (OZAZ48 or Map Ref 1) has a much larger Rf (477 ± 24 14C years) than the other samples. The Rf range of the remaining samples (OZAZ49-AZ51, OZAZ57_avg, OZAZ58-AZ60; or Map Refs 2–8) is 190 14C years, with a weighted average value of 138 ± 67 14C years.

Results of radiocarbon dating for historical shell samples.

a δ13C was measured on graphite for the fractionation correction.
b Two separate measurements on OZAZ57 (OZAZ57_1 and OZAZ57_2) were used to calculate an average result for OZAZ57_avg (pMC calculated using weighted average, δ13C calculated using simple average).
3.2 Modern water samples
The results of the water samples vary from 99.87 ± 0.28 (MER-1) to 100.56 ± 0.27 pMC (MOR-1) (Table 3; Figure 4a, b). The RfM range from −16 ± 22 to 39 ± 23 14C years. The atmospheric 14C value for May 2024 used in this study (100.36 ± 0.18 pMC) agrees well with the pMC values for the modern water samples within 1σ (OZBU68-BU70) and 2σ (for OZBU67) uncertainties (Figure 4b). This suggests that they were in equilibrium with the atmospheric 14CO2. As a result, the RfM values calculated for these samples are within 1σ or 2σ of zero.
Results of radiocarbon dating for modern water and shell samples.

Table 3. Long description
The table presents radiocarbon dating results for modern water and shell samples. It includes columns for map reference, ANSTO sample code, material type and in-house sample code, atmospheric 14C for collection period, delta 13C, pMC with error, CRA with error, RfM with error, and delta 14C. The table has 8 rows and 10 columns. Row 1: Map ref., A; ANSTO sample code, OZBU68; Material type and in-house sample code, Water (MOR-1); Atmospheric 14C for collection period (pMC), 100.36 ± 0.18; delta 13C (‰), -5.2; pMC (1σ error), 100.56 ± 0.27; CRA (yrs BP) (1σ error), Modern; RfM (14C years) (1σ error), -16 ± 22; delta 14C (‰), -3.4 ± 2.7. Row 2: Map ref., B; ANSTO sample code, OZBU69; Material type and in-house sample code, Water (LOX-1); Atmospheric 14C for collection period (pMC), 100.36 ± 0.18; delta 13C (‰), -5.6; pMC (1σ error), 100.40 ± 0.27; CRA (yrs BP) (1σ error), Modern; RfM (14C years) (1σ error), -3 ± 22; delta 14C (‰), -4.9 ± 2.7. Row 3: Map ref., C; ANSTO sample code, OZBU70; Material type and in-house sample code, Water (MRM-1); Atmospheric 14C for collection period (pMC), 100.36 ± 0.18; delta 13C (‰), -6.3; pMC (1σ error), 100.56 ± 0.25; CRA (yrs BP) (1σ error), Modern; RfM (14C years) (1σ error), -16 ± 20; delta 14C (‰), -3.4 ± 2.5. Row 4: Map ref., D; ANSTO sample code, OZBU67; Material type and in-house sample code, Water (MER-1); Atmospheric 14C for collection period (pMC), 100.36 ± 0.18; delta 13C (‰), -7.6; pMC (1σ error), 99.87 ± 0.28; CRA (yrs BP) (1σ error), 10 ± 23; RfM (14C years) (1σ error), 39 ± 23; delta 14C (‰), -10.2 ± 2.8. Row 5: Map ref., E; ANSTO sample code, OZBU81; Material type and in-house sample code, Modern shell (MRS-M0070); Atmospheric 14C for collection period (pMC), 100.82 ± 0.17; delta 13C (‰), -8.5; pMC (1σ error), 107.08 ± 0.28; CRA (yrs BP) (1σ error), Modern; RfM (14C years) (1σ error), -484 ± 22; delta 14C (‰), 61.4 ± 2.8. Row 6: Map ref., E; ANSTO sample code, OZBU82; Material type and in-house sample code, Modern shell (MRS-M0072); Atmospheric 14C for collection period (pMC), 100.82 ± 0.17; delta 13C (‰), -9.0; pMC (1σ error), 106.33 ± 0.20; CRA (yrs BP) (1σ error), Modern; RfM (14C years) (1σ error), -427 ± 16; delta 14C (‰), 54.0 ± 2.0. Row 7: Map ref., F; ANSTO sample code, OZBJ10; Material type and in-house sample code, Modern shell (MRS-M0044); Atmospheric 14C for collection period (pMC), 100.94 ± 0.11; delta 13C (‰), -9.3; pMC (1σ error), 102.40 ± 0.31; CRA (yrs BP) (1σ error), Modern; RfM (14C years) (1σ error), -115 ± 25; delta 14C (‰), 15.1 ± 3.1. Row 8: Map ref., G; ANSTO sample code, OZBU79; Material type and in-house sample code, Modern shell (MRS-M0066); Atmospheric 14C for collection period (pMC), 100.82 ± 0.17; delta 13C (‰), -9.0; pMC (1σ error), 104.71 ± 0.32; CRA (yrs BP) (1σ error), Modern; RfM (14C years) (1σ error), -304 ± 25; delta 14C (‰), 37.9 ± 3.2. Row 9: Map ref., G; ANSTO sample code, OZBU80; Material type and in-house sample code, Modern shell (MRS-M0068); Atmospheric 14C for collection period (pMC), 100.82 ± 0.17; delta 13C (‰), -10.1; pMC (1σ error), 103.96 ± 0.28; CRA (yrs BP) (1σ error), Modern; RfM (14C years) (1σ error), -246 ± 22; delta 14C (‰), 30.5 ± 2.8.
a δ13C was measured on graphite for the fractionation correction.
pMC values measured for modern water samples (a & b) and modern shell samples (a & c) plotted against atmospheric 14C content measured at Baring Head, Wellington, New Zealand (Turnbull et al. Reference Turnbull, Mikaloff Fletcher, Ansell, Brailsford, Moss, Norris and Steinkamp2017). Figure 4a shows all measurements at Baring Head taken between January 2020 and March 2024, while Figures 4b and 4c show the weighted mean (and uncertainty [1σ unless otherwise specified]) of the atmospheric 14C measurements for the relevant collection months as a gray band (b: May 2024; c: April 2022 and September 2023). Letters A–G refer to collection site Map Refs (Table 3; Figure 1).

3.3 Modern shell samples
The ventral edge samples of the shells collected in 2022/2023 vary from 102.40 ± 0.31 pMC to 107.08 ± 0.28 pMC (Table 3; Figure 4a, c). These values all fall outside the uncertainty range for the atmospheric 14C value for their respective months, suggesting that they were not in equilibrium with the prevailing atmospheric 14CO2. The RfM range from –484 ± 22 to –115 ± 25 14C years.
4 Discussion
4.1 Potential sources of the reservoir effect on the Millewa (Murray River)
14CDIC measured from the water samples at each site shows equilibrium (within 1–2 σ) with atmospheric 14CO2 measurements. Although MER-1 (OZBU67) has a much larger RfM, it is still within 2 σ of the atmospheric 14CO2 value for that month and could be the result of a localized carbon source. It could alternatively be evidence of the more variable water carbon geochemistry present upstream of the Murray-Darling confluence, as noted in previous research (Cartwright Reference Cartwright2010).
As the 14CDIC are all slightly greater than 100 pMC or within 1σ uncertainty of this value, this suggests that they are primarily composed of DIC formed recently. Young sources of carbon recently formed include exchange and equilibration with atmospheric CO2, carbonate and silicate weathering, soil CO2, and within-river respiration of organic matter. These latter three sources provide young carbon when derived from near surface soil respiration, but they can provide millennial aged carbon when derived from deeper in the soil profile (Dean et al. Reference Dean, Coxon, Zheng, Bishop, Garnett, Bastviken, Galy, Spencer, Tank and Tipper2025; Raymond et al. Reference Raymond, Bauer, Caraco, Cole, Longworth and Petsch2004). The Δ14C value for soil organic carbon in the surface soil (0–30 cm) of the region was modeled at –50 to 0‰ (Shi et al. Reference Shi, Allison, He, Levine, Hoyt, Beem-Miller, Zhu, Wieder, Trumbore and Randerson2020). The modeled range includes the Δ14C of the modern water measured in this study (–10.2 to –3.4‰; Table 3), thus supporting the conclusion that relevant DIC sources could have been deriving carbon from these layers.
Research by Cartwright (Reference Cartwright2010) concluded that exchange and equilibration with atmospheric CO2, soil CO2, and within-river respiration of organic material were likely responsible for the DIC concentrations and δ13CDIC measured in the river. Thus, these sources may be predominantly contributing to the 14CDIC in this study, although it is documented that changes in DIC concentrations and δ13CDIC are not always caused by the same processes as 14CDIC (Raymond et al. Reference Raymond, Bauer, Caraco, Cole, Longworth and Petsch2004; Yao and Gao Reference Yao and Gao2006). Other physico-chemical water measurements recorded by Cartwright (Reference Cartwright2010) generally align with values observed in this study (Supplementary Material: Appendix 2), supporting the idea that the results of these two studies can be compared, despite Cartwright’s study being conducted during the Millennium Drought (1997–2009).
The modern water ages in this study are above the mean 14CDIC values for global rivers analysed by Dean et al. (Reference Dean, Coxon, Zheng, Bishop, Garnett, Bastviken, Galy, Spencer, Tank and Tipper2025) but within the expected interquartile range. Only 35% of global rivers were found to have a pMC >100. This would suggest that the Murray River is more influenced by recent carbon compared to the majority of the world’s rivers. The pMC values measured in this study are also higher than most samples taken from a similar catchment size (>10km2) and lithology (sedimentary) (Dean et al. Reference Dean, Coxon, Zheng, Bishop, Garnett, Bastviken, Galy, Spencer, Tank and Tipper2025), which may point to the need to include data from the MDB or other arid riverine stretches in such global studies.
4.2 Influences on the shell results
The Rf calculated for the historical shell samples is 55 ± 22 to 477 ± 24 14C years, which is much larger than the RfM for 14CDIC in modern water samples. There appears to be no clear age or geographical trend to the Rf results of the historical shells, except that the sample from Morgan (OZAZ48 or Map Ref 1), the most downstream site, has the largest Rf value. This is despite two of the samples (OZAZ59 and OZAZ57_avg) being collected at sites not necessarily within the main course of the Murray River, but from closely related waterways. Although there is some variability between the other samples, similar variability prevails in the literature and may be attributed to individual biological effects, diet preferences, or microhabitat conditions, all of which are explored below (Culleton Reference Culleton2006; Keaveney and Reimer Reference Keaveney and Reimer2012; Inomata et al. Reference Inomata, Sharpe, Palomo, Pinzón, Nasu, Triadan, Culleton and Kennett2022).
The RfM values for the modern shells (–484 ± 22 to –115 ± 25 14C years) are negative because the atmospheric pMC value associated with each shell collection is lower than the shell pMC. This indicates that the carbon used by the mollusks to build their shells included carbon which was older than their associated atmospheric values, dated to the post bomb period from the mid-1950s onwards when the atmospheric 14C values were higher than current values. The RfM of the modern shells are more negative than those of the modern water samples, which suggests that the mollusks had access to older carbon which was present in the water samples. Potential sources of this carbon are discussed below. A range of environmental changes which have affected the MDB since the collection of the historical shells may also be influencing the results of the modern shells analysed in this study, including the presence of bomb carbon in the soil (Shi et al. Reference Shi, Allison, He, Levine, Hoyt, Beem-Miller, Zhu, Wieder, Trumbore and Randerson2020), changes to land-use (Trumbore Reference Trumbore2000; Bradshaw Reference Bradshaw2012; Grimm et al. Reference Grimm, Spero, Harding and Guilderson2017) and long-term, as well as short-term, alterations to the flow of the Murray River, such as the 2022–2023 flood event (Jacobs Reference Jacobs, Mackay and Eastburn1990; Walker and Thoms Reference Walker and Thoms1993). Therefore, while the negative value demonstrates that there is a reservoir offset present for modern shell samples, in this case, these values cannot be used to elucidate on the FRE offset of the historical shells in this study.
It is difficult to quantify the influence of biological effects and respired carbon on the shell results as these effects remain unknown for A. jacksoni. Furthermore, the age of dissolved or dietary organic carbon available in the Murray River remains uninvestigated. Previous radiocarbon dating studies where FRE offsets have been attributed to metabolic carbon have involved mollusks, particularly gastropods, whose habitat or food is situated on a substrate containing old carbon and who are prone to scraping as they feed, leading to the ingestion of radioactively dead rock fragments (Dye Reference Dye1994; Hill et al. Reference Hill, Reimer, Hunt, Prendergast and Barker2017). As A. jacksoni are obligate filter feeders, they filter food particles out of the ambient water rather than scraping the surrounding substrate while eating, thus minimizing the amount of old carbon ingested, and thus a metabolic offset derived from dead carbon consumption is unlikely to be an issue. While diet preferences have been shown as a potential explanation for inter-individual differences in past 14C studies of aquatic fauna (Dury et al. Reference Dury, Eriksson, Savinetsky, Dobrovolskaya, Dneprovsky, Harris, van der Plicht, Jordan and Lidén2022; Keaveney and Reimer Reference Keaveney and Reimer2012; Petchey et al. Reference Petchey, Ulm, David, McNiven, Asmussen, Tomkins, Dolby, Aplin, Richards and Rowe2013), a filter-feeder’s food source is primarily controlled by the suspended load present in their microhabitat. Research has shown that filter-feeders actively select the size and shape of the particles they consume and may even select based on the nutritional content of the particles (Jørgensen Reference Jørgensen1996; Allison et al. Reference Allison, Millward and Jones1998). Experiments on A. jacksoni have also shown that environmental conditions such as water flow impact feeding activity (Walker Reference Walker1981). Thus, the variation observed in this study may be less attributable to “diet preferences” and more consistent with “microhabitat conditions,” especially given this species is sedentary in adulthood.
Metabolic carbon derived from older, but not ancient, carbon sources may explain the negative RfM values measured for the modern shells. Ultimately, metabolic carbon is likely to contribute between 2–49% of carbon to the mollusks’ shells (Shanahan et al. Reference Shanahan, Pigati, Dettman and Quade2005; Yan et al. Reference Yan, Dettman, Chen and Shen2020). Variation in the contribution of metabolic carbon to a mollusk’s shell is also known to vary with ontogeny, life events, and food source, among other things (Dettman et al. Reference Dettman, Reische and Lohmann1999; Gillikin et al. Reference Gillikin, Hutchinson and Kumai2009; Yan et al. Reference Yan, Dettman, Chen and Shen2020). The influence of the metabolic carbon would also explain the offset between the modern water samples and modern shell samples as only the age of DIC was measured in the river water. The historical mollusks’ shells would have also been affected by metabolic carbon however its influence is less apparent due to the nature of the contemporary atmospheric radiocarbon curve when compared to the steep fall seen in the modern post bomb radiocarbon curve.
The microhabitat conditions of the mollusks possibly have an important influence on 14C stored in their shells. First, the general habitat of A. jacksoni on the riverbed may partly explain why the modern water samples closely resemble the atmospheric values, while the results of the modern mollusks display an offset. While our water samples were taken from the top 50 cm of water, the modern A. jacksoni inhabit the riverbed and were collected at a depth of about 1.5 m, where the mollusks burrow partially into the channel bed. Thus, they may be exposed to different 14C signals than water from closer to the top of the water column, specifically sediment pore water from the river substrate. Previous research has shown that freshwater mollusks can serve as a high-resolution proxy of the geochemical changes occurring at the interface between sediment and water (Lyubas et al. Reference Lyubas, Tomilova, Chupakov, Vikhrev, Travina, Orlov, Zubrii, Kondakov, Bolotov and Pokrovsky2021, Reference Lyubas, Kuznetsova, Bovykina, Eliseeva, Gofarov, Khrebtova, Kondakov, Malkov, Mavromatis and Shevchenko2023; Zhao et al. Reference Zhao, Walliser, Mertz-Kraus and Schöne2017). Although water mixing in the Murray has been shown to occur relatively quickly (Bormans et al. Reference Bormans, Maier, Burch and Baker1997; Cartwright Reference Cartwright2010) mollusks may be incorporating at least some bicarbonate ions into their shells that have their origin from the DIC of the sediment pore water because of their constant proximity to the sediment. The age of the sediment pore water is likely controlled by the mineralization of SOM. Similarly, depending on the mollusks’ position in the river, this could extend to direct contact with the inflow of older or ancient 14CDIC to the river via groundwater inflow, resulting from carbonate dissolution or older layers of soil CO2. Although groundwater inputs are said to only make up about 1–2% of the river’s flow (Cartwright Reference Cartwright2010; Simpson and Herczeg Reference Simpson and Herczeg1991), were a mollusk to be located just downstream of one of these inputs their shell may be substantially more influenced by the presence of older or ancient carbon present in this water, prior to it being mixed into the water channel. Furthermore, other aspects of habitat, such as the presence of flora, may affect what 14CDIC is recorded by the mollusk’s shell. For example, the modern mollusks from MUL1 (Map Ref E; OZBU81 and OZBU82) were found among Phragmites and other aquatic plants on a creek with a high density of woody debris, compared with those collected at the same time from the Murray River which were uncovered from a relatively bare riverbank. This may have resulted in access to different 14CDIC sources, potentially due to the within river mineralization of different organic material, and could help explain the different values measured from ventral edge samples (values of 107.08 ± 0.28 pMC and 106.33 ± 0.20 pMC for the MUL1 samples, compared to values of 102.40 ± 0.31 pMC, 104.71 ± 0.32 pMC, and 103.96 ± 0.28 pMC for samples collected elsewhere). Therefore, the mollusk’s habitat and position along the river may result in direct contact with 14CDIC sources which are not observed in water sampling because of quick water mixing. Unfortunately, due to the limited information we have about the collection of historical shells, it is difficult to pinpoint which microhabitat factors may be playing a role in this case.
Time-averaging may also be influencing the historical shell results. Time averaging refers to the issue of more than one unit of time being represented in a sample. In the case of the shells analyzed here, we aimed to sample an area containing ≤ 1 year of growth. Based on existing understandings of A. jacksoni shell growth (Walker Reference Walker1981), we estimated that the maximum 5 mm portion sampled in the historical shells was representative of 4-12 months of growth, while the 2 mm portion sampled from the modern shells (OZBU79-BU82) was representative of 2–9 months of growth (Supplementary Material: Appendix 3). Therefore, the effect of time averaging on the results is likely quite small.
Therefore, the variability seen in the results of the historical shell samples is seen in other FRE studies and may be explained by factors such as biological effects, time averaging, and microhabitat conditions. While the modern mollusks have negative RfM values, this is likely due to carbon from the period after the mid-1950s forming part of their shell. Although temporal changes to the source of DIC and atmospheric 14CO2 are known to affect FREs (Grimm et al. Reference Grimm, Spero, Harding and Guilderson2017; Osterkamp et al. Reference Osterkamp, Green, Reid and Cherkinsky2014; Philippsen and Heinemeier Reference Philippsen and Heinemeier2013; Turnbull et al. Reference Turnbull, Mikaloff Fletcher, Ansell, Brailsford, Moss, Norris and Steinkamp2017), further research is required to understand the effect that this may have on the historical specimens.
4.3 A regional perspective on the FRE in the MDB
The weighted mean value of 138 ± 67 14C years calculated for samples OZAZ49-AZ51, OZAZ57_avg, and OZAZ58-AZ60 (Map Refs 2 to 8) is larger and more dispersed than that determined for the Darling River in northern NSW (–39 ± 22 14C years, or –28 ± 13 14C years without sample VA-2) and the Murrumbidgee River (93 ± 24 14C years) (Gillespie et al. Reference Gillespie, Fink, Petchey and Jacobsen2009), but smaller than the weighted mean Rf calculated in the study by Wilson (Reference Wilson2017) for the lower Murray River (219 ± 178 14C years). There is some overlap between the Rf calculated for this study and those calculated for the lower Murray River and the Murrumbidgee which makes sense given the proximity and connection between the study site and these other studied regions (Figure 1). In fact, a historical sample used in the FRE study by Wilson (Reference Wilson2017) which was collected within the study region from the Murray River at Berri (ANU-9410), falls within the calculated average for samples from this research (94 ± 40 14C years) (Supplementary Material: Table 1.2), providing further support for the results of this study. Overall, this suggests that the FRE within the MDB and the Murray River itself is variable, as has been suggested for other river systems (Philippsen Reference Philippsen2013), however the results of this study fit into the broader geographical trend.
A different historical sample analyzed by Wilson (Reference Wilson2017) and collected in the 1930s from Mannum in the Murray Gorge portion of the river was found to have a larger offset than the average calculated for this study (ANU-9412; 276 ± 30 14C years) (Supplementary Material: Table 1.2). In combination with the outlier sample from Morgan analyzed in this study (OZAZ48; 477 ± 24 14C years), one could argue that the Murray Gorge reach of the Murray River is characterized by a larger FRE offset to the Mallee Trench and Riverine Plains reaches. Old carbon may be entering the shells through >30 ka groundwater from the Murray Group aquifer, which is discharged near Morgan at the beginning of the Murray Gorge reach (Cartwright et al. Reference Cartwright, Weaver, Cendón, Fifield, Tweed, Petrides and Swane2012; Evans et al. Reference Evans, Brown, Kellett, Mackay and Eastburn1990) as carbonate dissolution in the Murray Group aquifer is known to be significant (Dogramaci and Herczeg Reference Dogramaci and Herczeg2002). Although 14CDIC modern water samples collected at Morgan (sample OZBU68) show no evidence of an “old” carbon effect, this may be explained by the microhabitat of the mollusks, as discussed above. Physico-chemical water data collected alongside this study indicates that water hardness increases downstream between Merbein and Morgan, suggesting increased presence of CaCO3 in the water in Loxton and Morgan, although the influence is only small (Supplementary Material: Appendix 2). Ultimately, however, it is difficult to draw substantial conclusions as the exact collection location for the Morgan sample is unknown. Other influences, such as collection year, may alternatively be influencing these results. Further investigation is required to better quantify the nature of the FRE occurring in the Murray Gorge stretch of the Murray River and areas further downstream.
As these previous studies were predominantly conducted with V. ambiguus shells, some of the variation between this study and past FRE studies in the MDB may be due to inter-species variation in habitat, biological effects, etc. For example, A. jacksoni are known to prefer feeding under the conditions of fast-flowing water, while V. ambiguus prefer still or slow moving water (Walker Reference Walker1981). These different environmental conditions have implications for microhabitat conditions, water-mixing potential, and more, all of which could influence the 14C being incorporated into the mollusk shell (Culleton Reference Culleton2006). Yet, the similarities between the results of this study and previous studies suggest that the inter-species variation is likely minimal.
4.4 Implications for archaeology
To investigate the archaeological implications of the FRE offset calculated in this study, we recalibrated previously published archaeological radiocarbon dates measured on freshwater mussels. No FRE correction had previously been applied to these dates. The offset of 138 ± 67 14C years was used which is the average Rf of all the historical shells measured in this study, except the outlier sample OZAZ48 from Morgan, which is not included for reasons discussed above. The use of historical shell Rf to create an FRE offset for the analysis of archaeological material has been used in several past studies (Rech et al. Reference Rech, Tenison, Baldasare and Currie2023; Ulm et al. Reference Ulm, O’Grady, Petchey, Hua, Jacobsen, Linnenlucke, David, Rosendahl, Bunbury and Bird2023)
A list of previously published radiocarbon ages measured using freshwater mussels were compiled using existing datasets (Codilean et al. Reference Codilean, Munack, Saktura, Cohen, Jacobs, Ulm, Hesse, Heyman, Peters and Williams2022; Saktura et al. Reference Saktura, Rehn, Linnenlucke, Munack, Wood, Petchey, Codilean, Jacobs, Williams and Ulm2022; Williams and Ulm Reference Williams and Ulm2014) and other known publications (Garvey Reference Garvey2017; Jones et al. Reference Jones, Roberts, Westell, Moffat, Jacobsen and Rudd2022, Reference Jones, Roberts, Westell, Moffat, Jacobsen and Scott Cummings2024; Watson and Kucera Reference Watson and Kucera2014). All ages were from sites within approximately 15km of the Murray River and within the region where the FRE study was conducted, however as we identified a need to further investigate the FRE of the Murray Gorge river reach, this study chose to only recalibrate data from upstream of Berri, where other historical dates showed correlation with our FRE offset (Wilson Reference Wilson2017). Calibration of specimens was completed using OxCal 4.4 (Bronk Ramsey Reference Bronk Ramsey2009). All dates were first calibrated using just the ShCal20 calibration curve (Hogg et al. Reference Hogg, Heaton, Hua, Palmer, Turney, Southon, Bayliss, Blackwell, Boswijk and Bronk Ramsey2020) and then calibrated again using the ShCal20 calibration curve and the Rf value calculated in this study (138 ± 67 14C years). Further details are available in the Supplementary Material: Appendix 4.
As would be expected, the inclusion of the Rf value has a proportionally larger influence on dates with a lower measured age, and thus primarily those dated to the Holocene, particularly the Late Holocene; although it does impact samples of all ages. Although these results are unlikely to have a significant impact on our understanding of the initial peopling of the region during the Late Pleistocene, it will influence the chronology of those sites which record more recent significant events, such as the adoption of new food production systems potentially in response to El Niño Southern Oscillation (ENSO) (Jones et al. Reference Jones, Roberts, Westell, Moffat, Jacobsen and Scott Cummings2024), responses to the climate variability of the last 2000 years (Fitzsimmons et al. Reference Fitzsimmons, Cohen, Hesse, Jansen, Nanson, May, Barrows, Haberlah, Hilgers and Kelly2013; Williams et al. Reference Williams, Ulm, Turney, Rohde and White2015), and colonization.
Although the offset has a dominant influence on Late Holocene sites, there does seem to be an influence on some Late Pleistocene sites within the bracket of 12,000–13,000 yrs BP, particularly the dates from Homestead Midden at Ned’s Corner (Wk-41172, Wk-41173) (Garvey Reference Garvey2017) and the Pike floodplain (Wk-47550, Wk-48703) (Westell et al. Reference Westell, Roberts, Morrison and Jacobsen2020). These dates, when calibration with Rf is applied, are dated to 15,517 to 14,362 cal BP (95.4%) (compared to 15,331 to 14,920 cal BP (95.4%) when the Rf is not applied). The influence on these Late Pleistocene dates is significant because 15 cal kBP is known to be a period of increased activity and shell midden formation in the archaeological record for this region (Westell et al. Reference Westell, Roberts, Morrison and Jacobsen2020).
Therefore, the inclusion of the Rf will affect the interpretation of various eras of cultural and environmental change along the central and lower Murray River. The inclusion of a Rf for radiocarbon dates measured on freshwater mollusk material allows for a more accurate comparison with ages from non-aquatic material, ultimately leading to better comparisons across archaeological sites and with paleoenvironmental proxy records. Given the popularity of freshwater mollusks for radiocarbon dating in the region (Figure 2), this will also generally improve larger scale chronologies.
The extension of radiocarbon date ranges as a result of the FRE offset shows an increased need for the application of Bayesian statistics to better constrain the timing of events and sites within the study region. Bayesian chronological modeling, which models radiocarbon dates in relation to the “prior beliefs” available through archaeological excavation (i.e., stratigraphy), can provide valuable answers to archaeological questions relating to how long a site was used for or the length of a behavior/event, rather than just the age of archaeological material (Bayliss et al. Reference Bayliss, Bronk Ramsey, van der Plicht and Whittle2007). The technique has been shown to increase precision and reduce overestimation of event length that can result from the interpretation of radiocarbon dates without statistical methods (Bayliss et al. Reference Bayliss, Bronk Ramsey, van der Plicht and Whittle2007). Unfortunately, in Australia, shell middens are usually afforded only a single age observation limiting the application of Bayesian statistics to these important sites (Saktura et al. Reference Saktura, Rehn, Linnenlucke, Munack, Wood, Petchey, Codilean, Jacobs, Cohen and Williams2023). Within the study region, this trend generally seems to continue, with only one or two age measurements for each midden. Thus, although the application of a Rf goes a long way to improving the accuracy of radiocarbon chronologies along the Murray River, future studies should also focus on the valuable role that Bayesian statistics may play in better understanding past human behavior.
Species identification can be difficult in the archaeological record for a variety of reasons, including taphonomic constraints, and the presence of smaller, potentially younger specimens where species-specific morphological identifiers may not yet be observable (Garvey Reference Garvey2017; Walker Reference Walker1981). As a result, several previous studies did not identify material to species level. Furthermore, advancements in molecular phylogenetic malacological research are increasingly pointing to shell morphology as not being a sufficient tool for species differentiation, even in adult specimens (Baker et al. Reference Baker, Sheldon, Somerville, Walker and Hughes2004). Yet, as discussed above, species-specific habitats and behaviors may play an important role in the intake or metabolism of carbon (Culleton Reference Culleton2006). Although the results of this research point to a relatively small difference between the FRE found in A. jacksoni and V. ambiguus shells when compared to the results of previous FRE studies conducted in the MDB (Gillespie et al. Reference Gillespie, Fink, Petchey and Jacobsen2009; Wilson Reference Wilson2017), an investigation which specifically investigates the differences which exist among species recovered at the same time from the same location would allow the discipline to better understand the effect that taxa may be having on radiocarbon dating results. Furthermore, it is becoming clear that freshwater gastropod species Notopala sublineata is a more significant taxa in archaeological contexts than previously thought, thus inclusion of this species in future FRE studies would be valuable (Blyton Reference Blyton2021; Garvey Reference Garvey2017; Westell et al. Reference Westell, Roberts and Fairhead2024). Studies should also consider that although this material was excavated from sites within 15km on the modern Murray River channel, the mollusk’s likely inhabited diverse habitats, such as billabongs and wetlands, rather than just the Murray River, which would have implications on the FRE affecting each sample.
5 Conclusions
This study establishes a FRE offset for the middle reaches of the Murray River. The results show that although the results of individual mollusk’s are variable, likely affected by various influences, such as mollusk microhabitat conditions and biological effects, the calculated average offset for the middle reaches of the Murray River (138 ± 67 14C years) fits within the geographical trend of previous FRE studies conducted in the MDB. An analysis of how the identified FRE effects archaeological shells demonstrates that it has a larger influence on radiocarbon dates from the Late Holocene, influencing chronologies relevant to the climate variability of the last 2000 years and colonization. Further research should investigate the influences on samples from the Murray Gorge reach onwards, which have been shown to have an increased FRE effect in this study and in past research. Future research may also investigate temporal changes to FRE which may result following certain climatic or historical events, such as drought, blackwater events, or anthropogenic land change or river management. Furthermore, an investigation of species-specific FRE offsets is required to establish the influence that these effects may have on the archaeological record where species identification is not always possible. Finally, more research is needed to investigate the influence of mollusk microhabitats on the intake of 14CDIC, particularly the role of 14C in sediment pore water from river sediment and the age of different DIC and organic carbon sources in Murray River more generally. This research will enable researchers to build more accurate chronologies of the region and precisely compare these to other records, such as paleoenvironmental archives.
Supplementary material
To view supplementary material for this article, please visit https://doi.org/10.1017/RDC.2026.10234
Acknowledgments
The authors pay their respects to the First Nations’ custodians of the land from which the material used in this study was collected, particularly Yorta Yorta, Barkandji, First Peoples of the Millewa Mallee, and First Peoples of the River Murray and Mallee. We acknowledge their continuing connection Country. Sovereignty was never ceded.
The authors would like to acknowledge the following people: Chris Rowley from Museums Victoria and Mandy Reid from the Australian Museum for access to historical mollusk material; Jocelyn Turnbull (GNS Science, New Zealand) for generously providing recent atmospheric 14CO2 data for Baring Head, Wellington; Henri Wong and Chris Vardenega at the Isotope Tracing in Natural Systems facility, ANSTO; the Radiocarbon staff at the Centre for Accelerator Science, ANSTO. We acknowledge the financial support for the Centre for Accelerator Science, at ANSTO, through the Australian National Collaborative Research Infrastructure Strategy (NCRIS).
The research and authors CS, JHM, JG and AP were supported by an Australian Research Council Discovery Project (DP200101875) funded by the Australian Government.
CS was also supported by the Commonwealth through an Australian Government Research Training Program Scholarship [DOI: https://doi.org/10.82133/C42F-K220]; an AINSE Ltd. Postgraduate Research Award (PGRA); and an ANSTO Research Portal grant. During the course of this research, AP was additionally supported by an ARC DECRA (DE200100890). This research was conducted by the Australian Research Council Centre of Excellence for Indigenous and Environmental Histories and Futures (CIEHF) (project number CE230100009). The views expressed herein are those of the authors and are not necessarily those of the Australian Government or Australian Research Council.
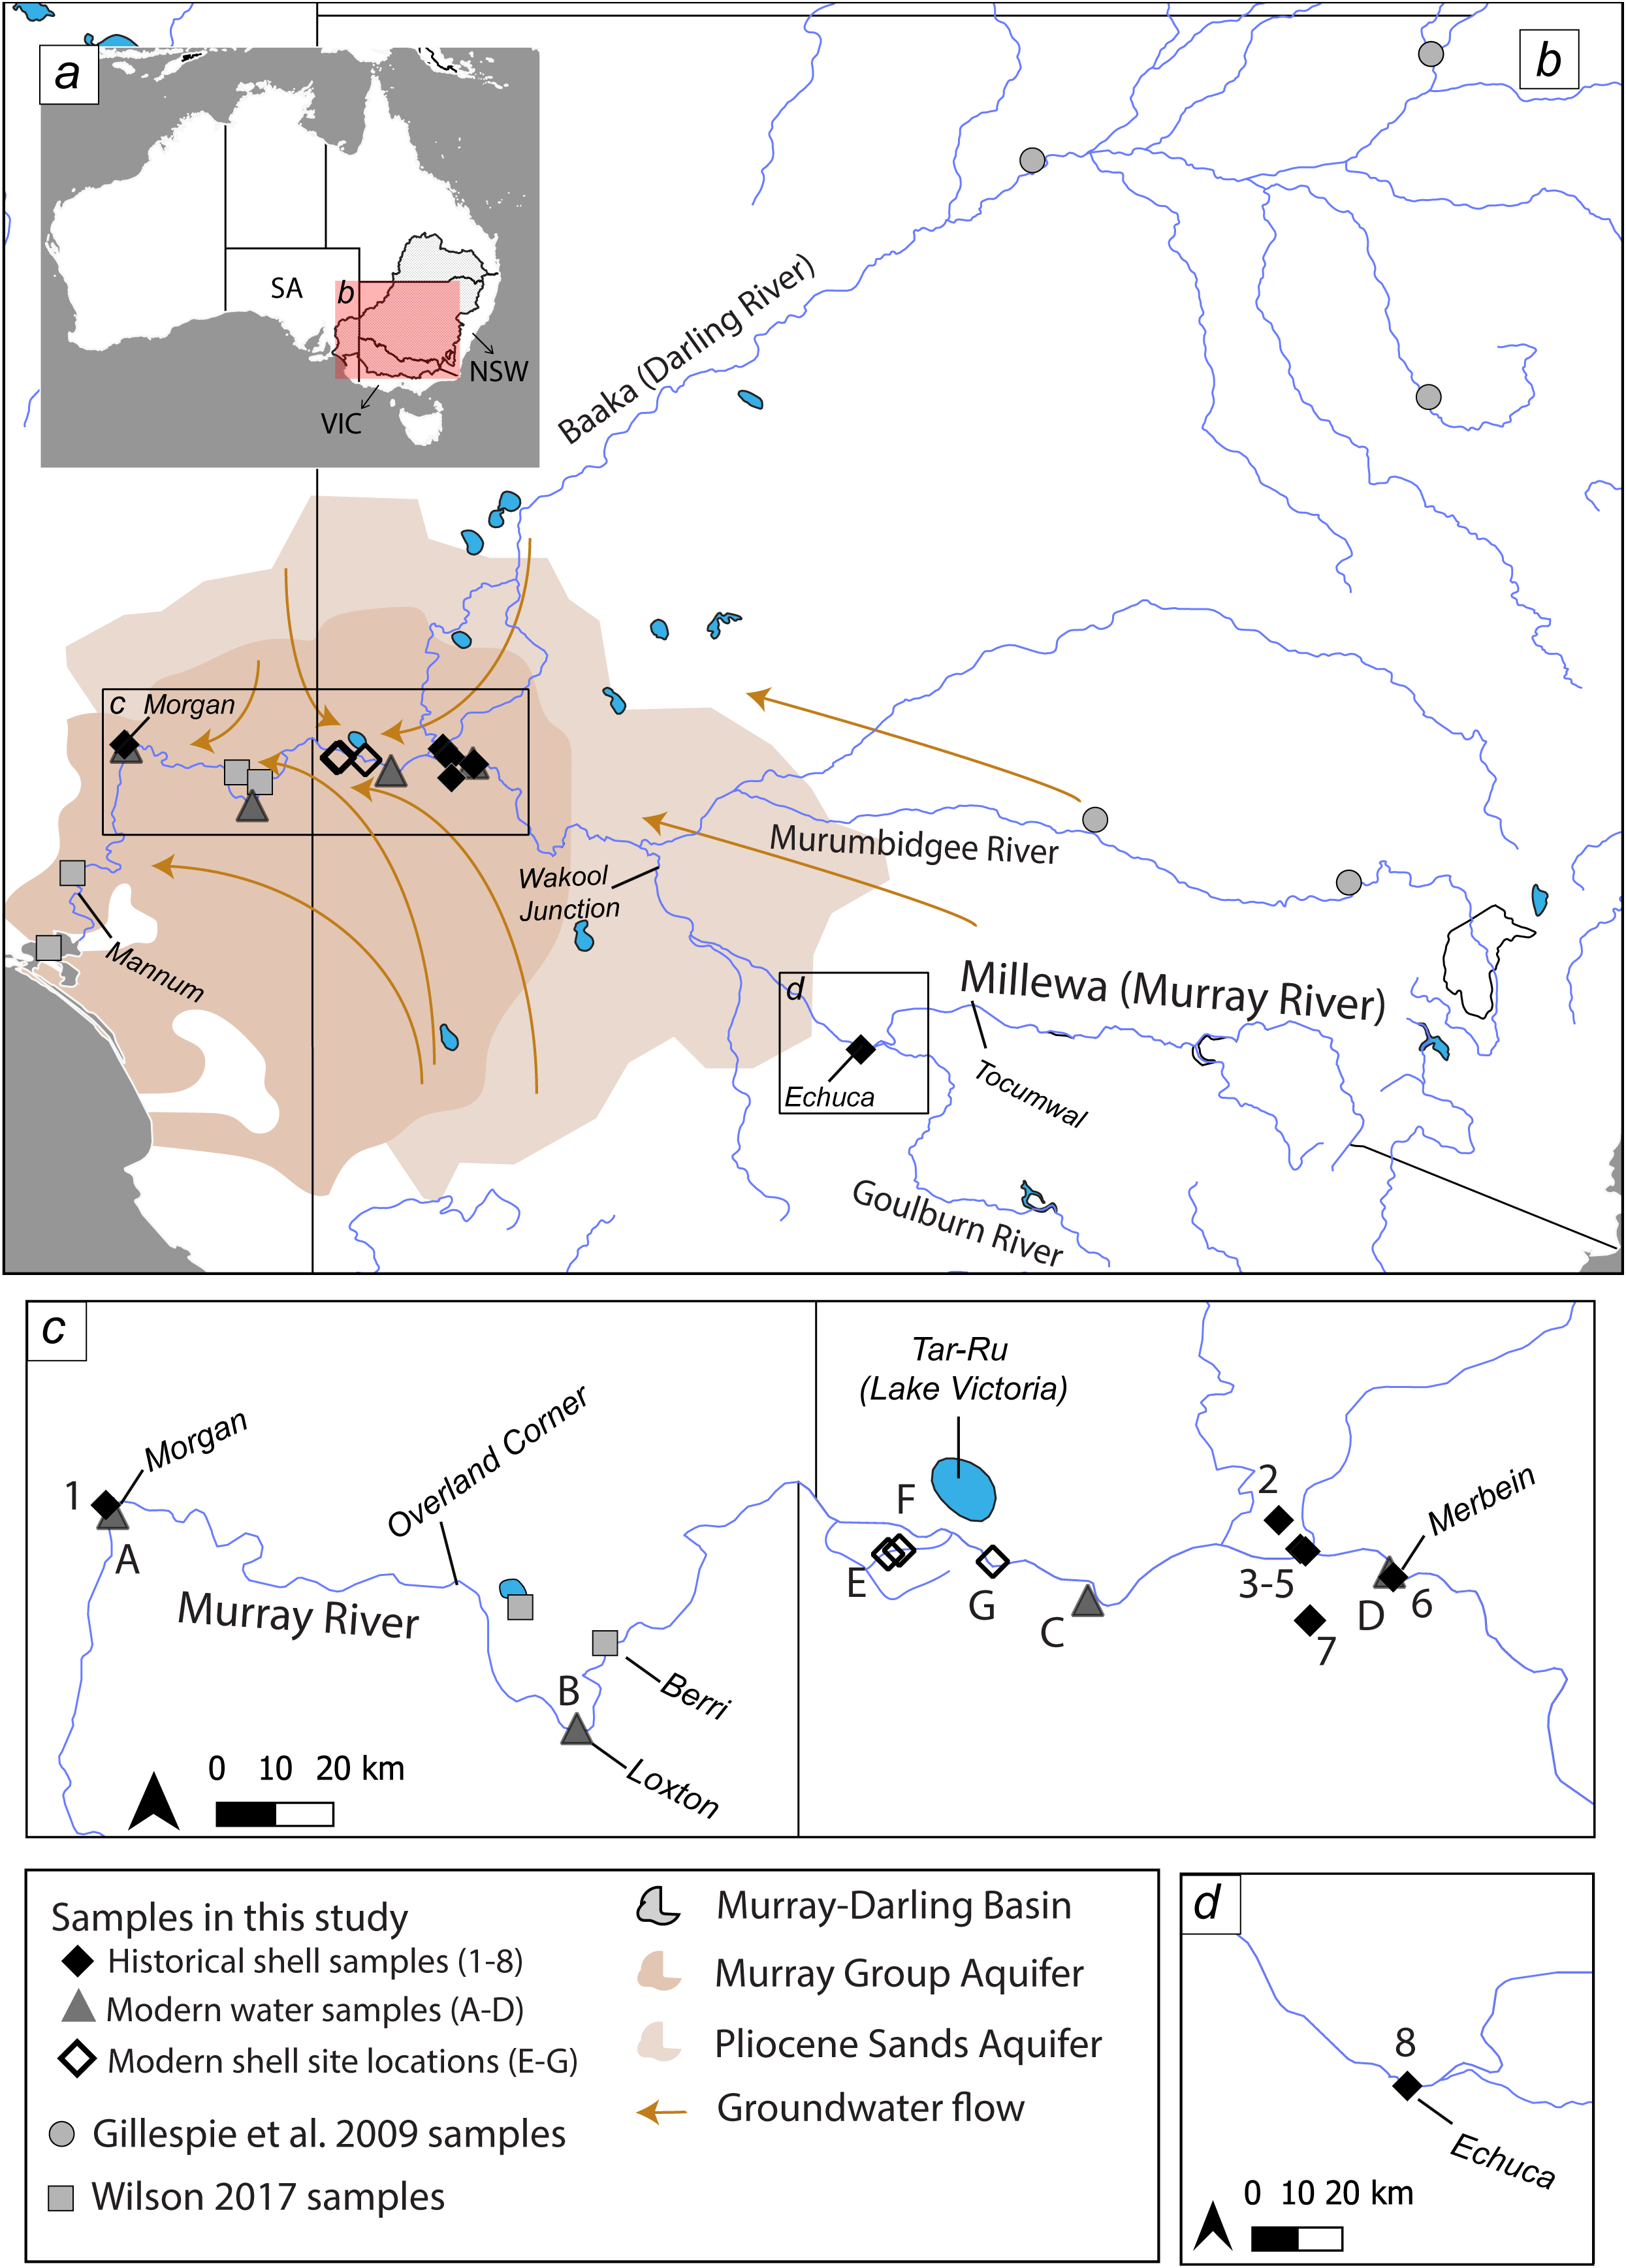
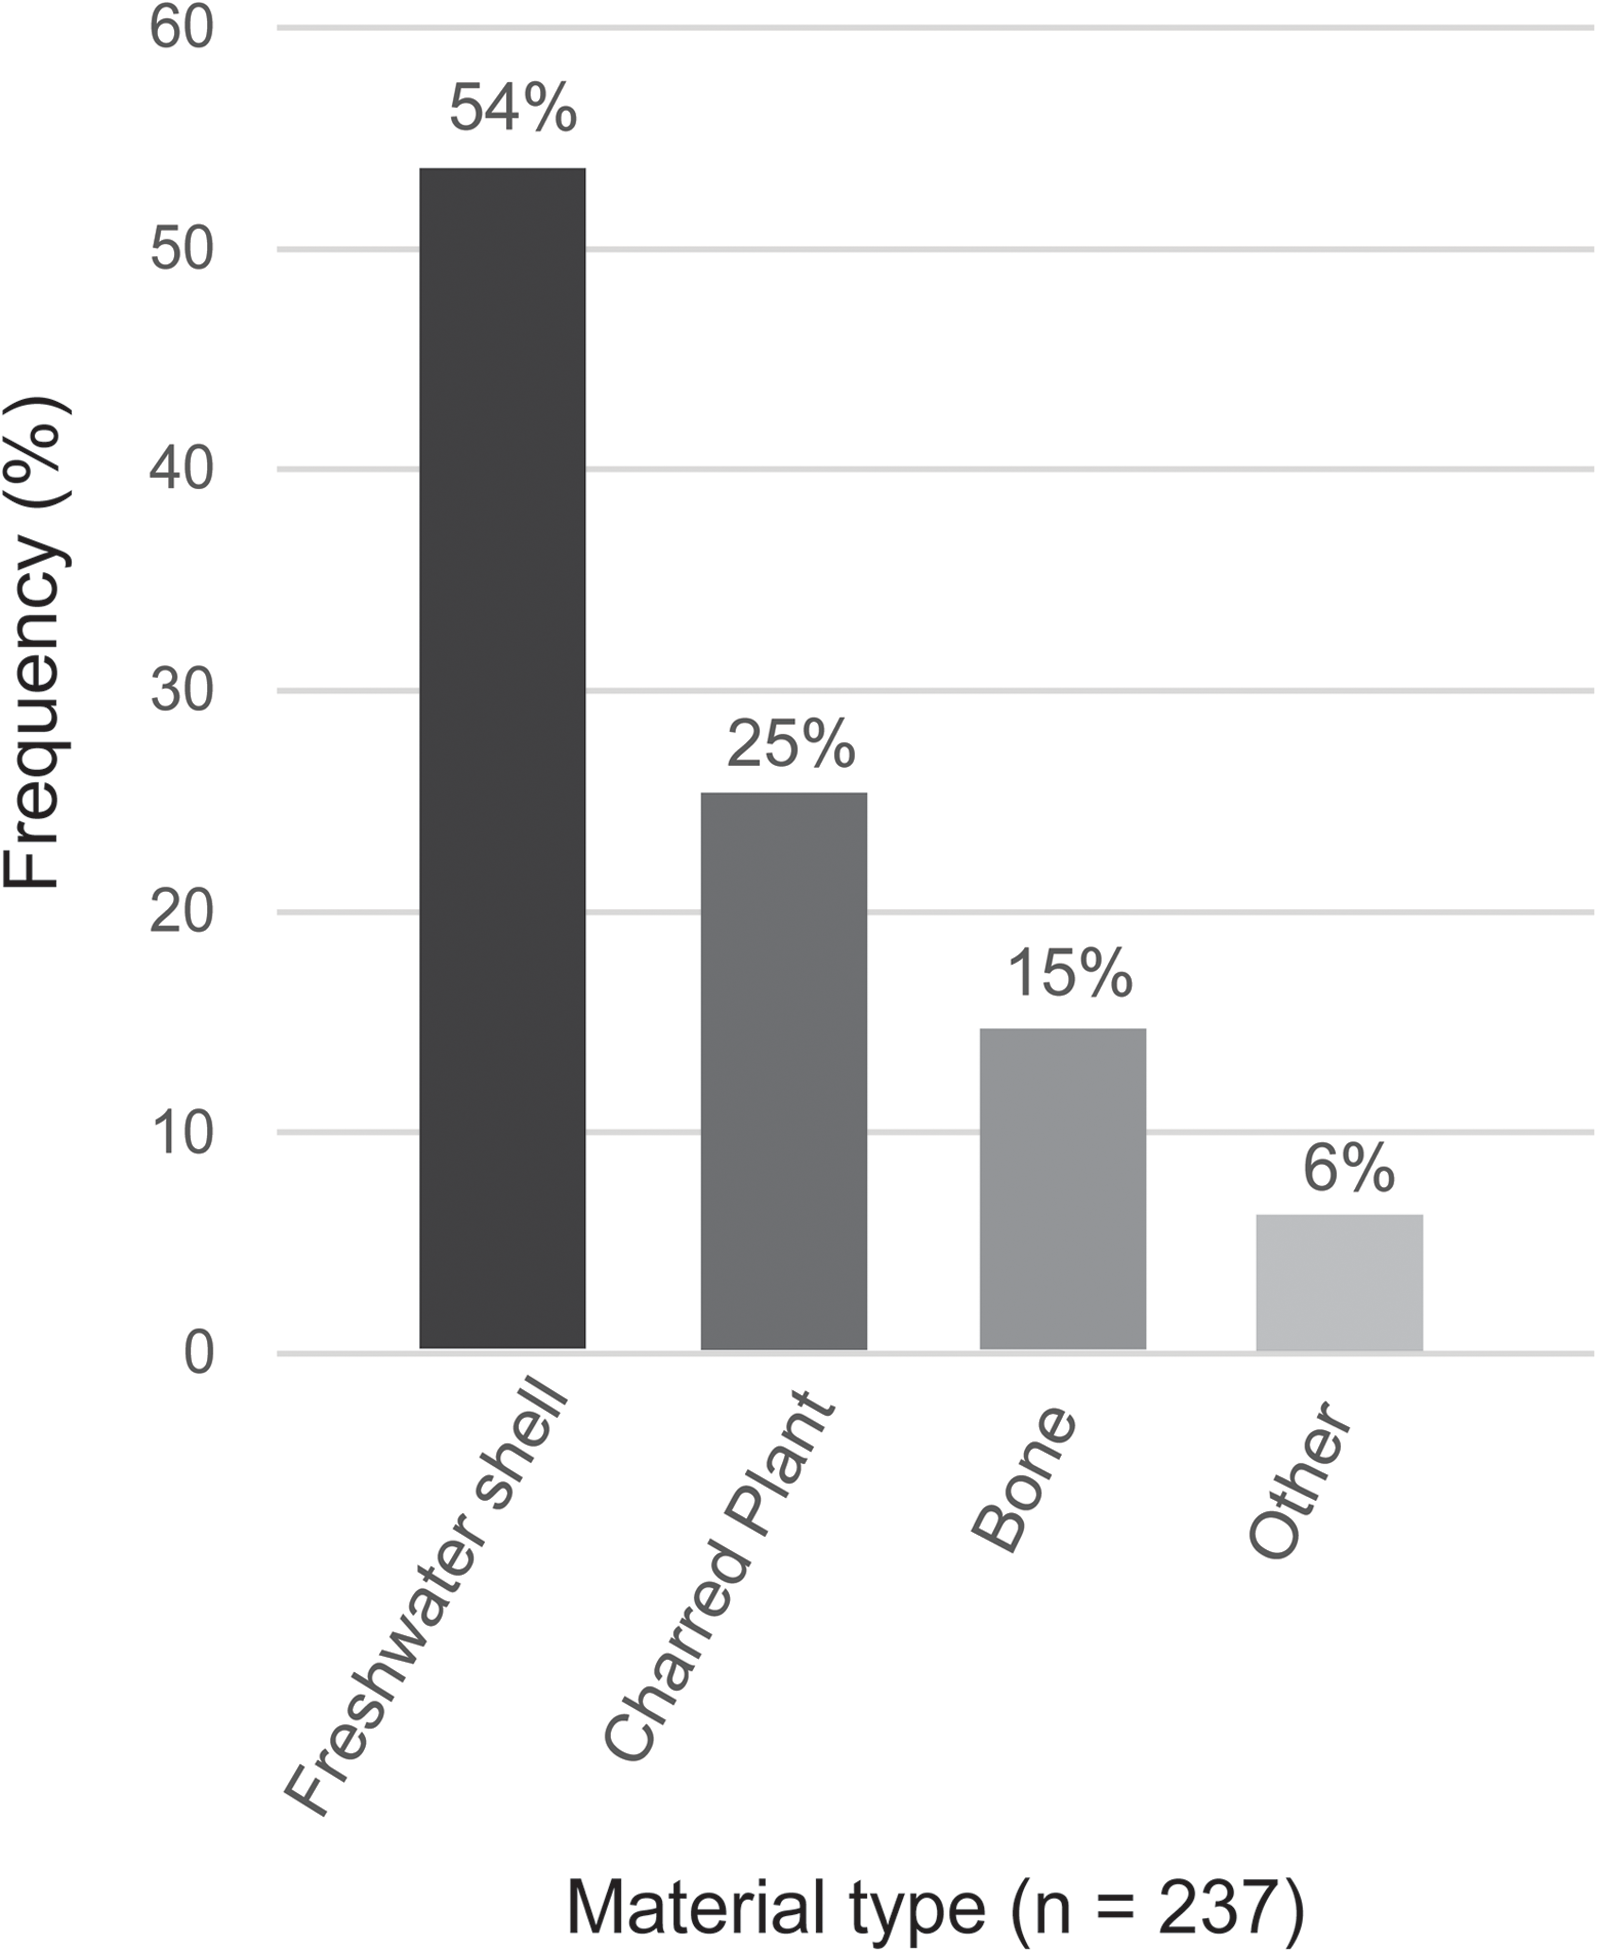
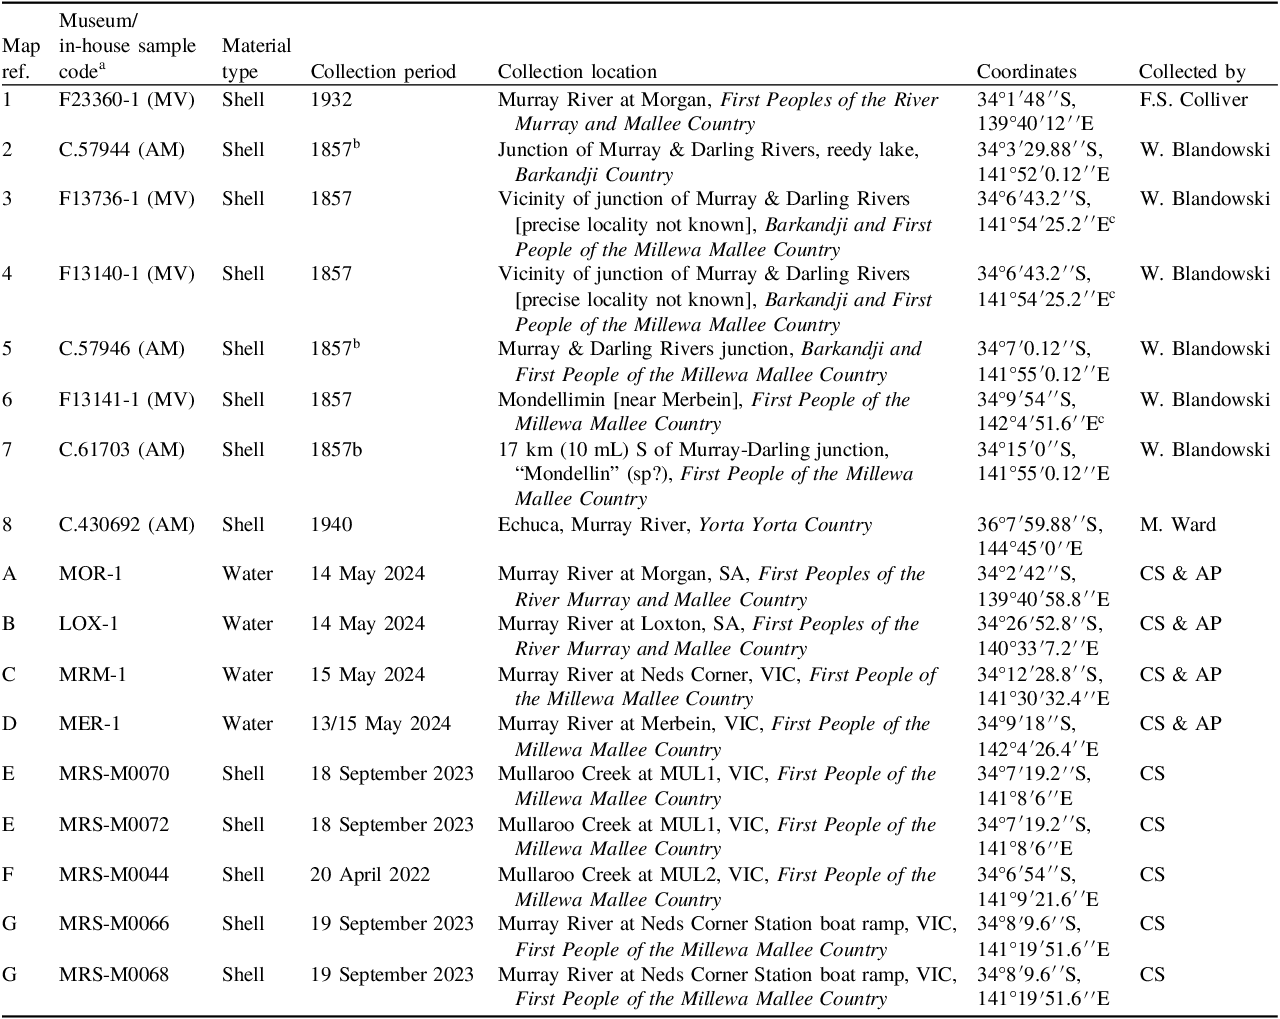
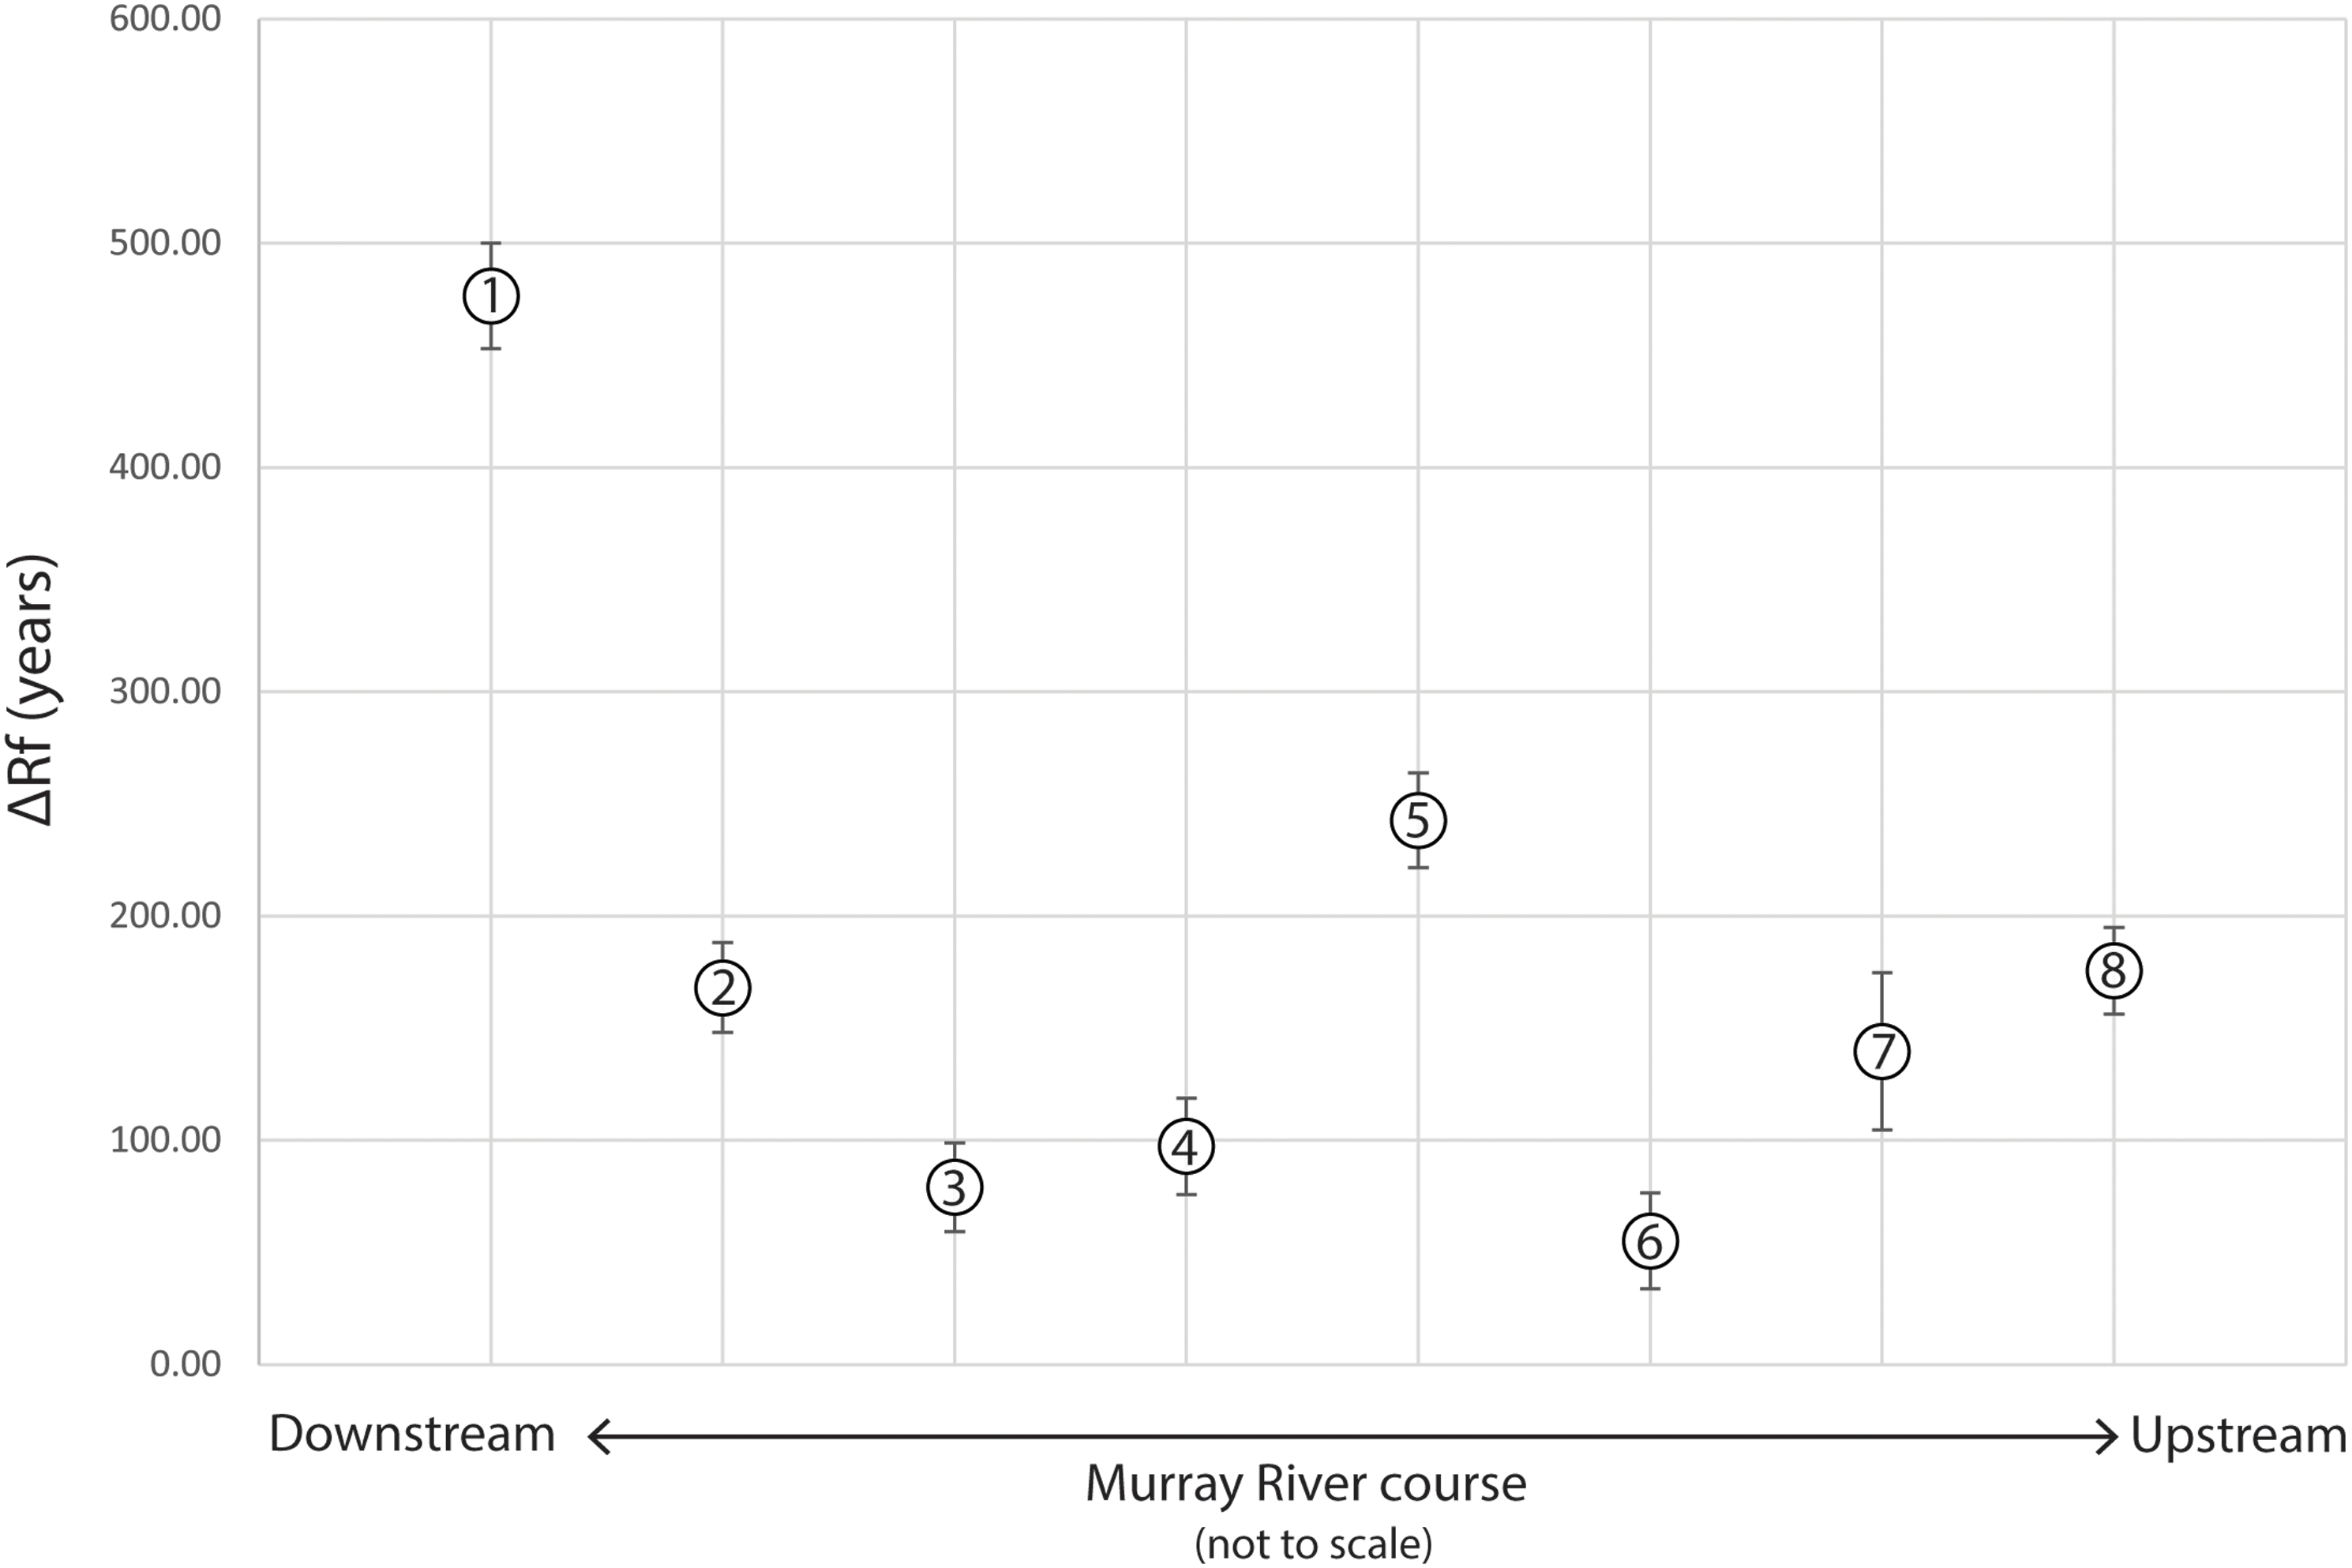
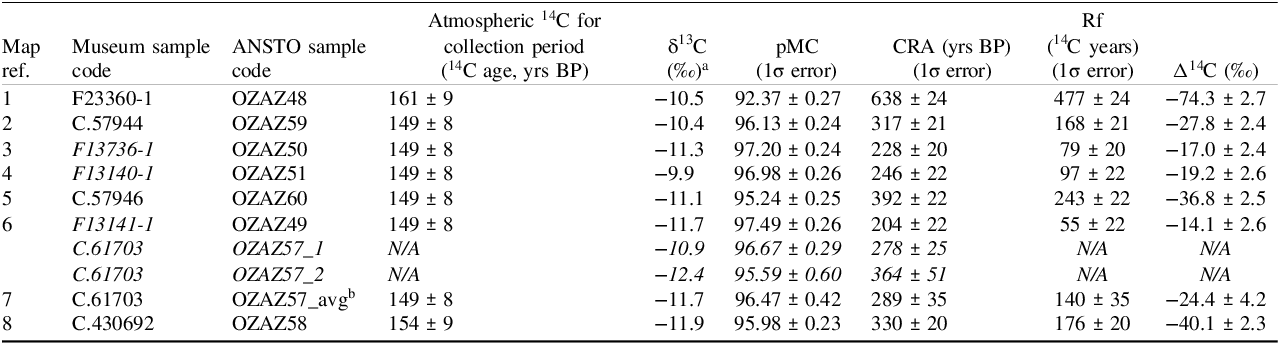
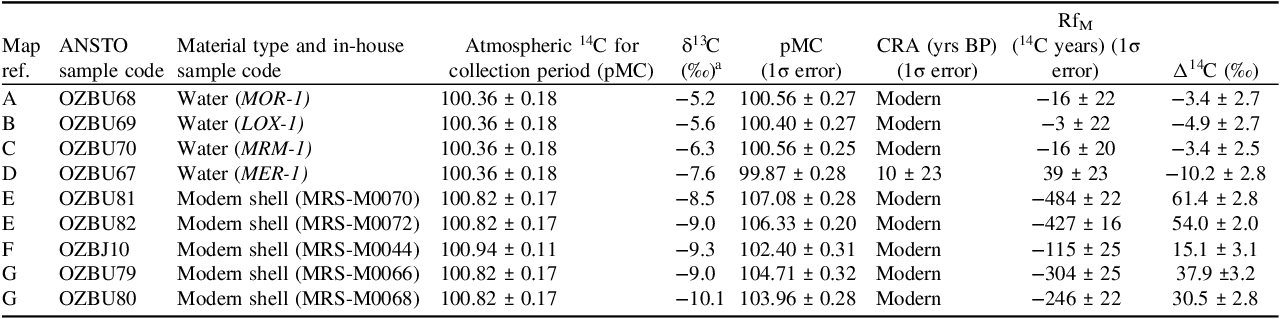
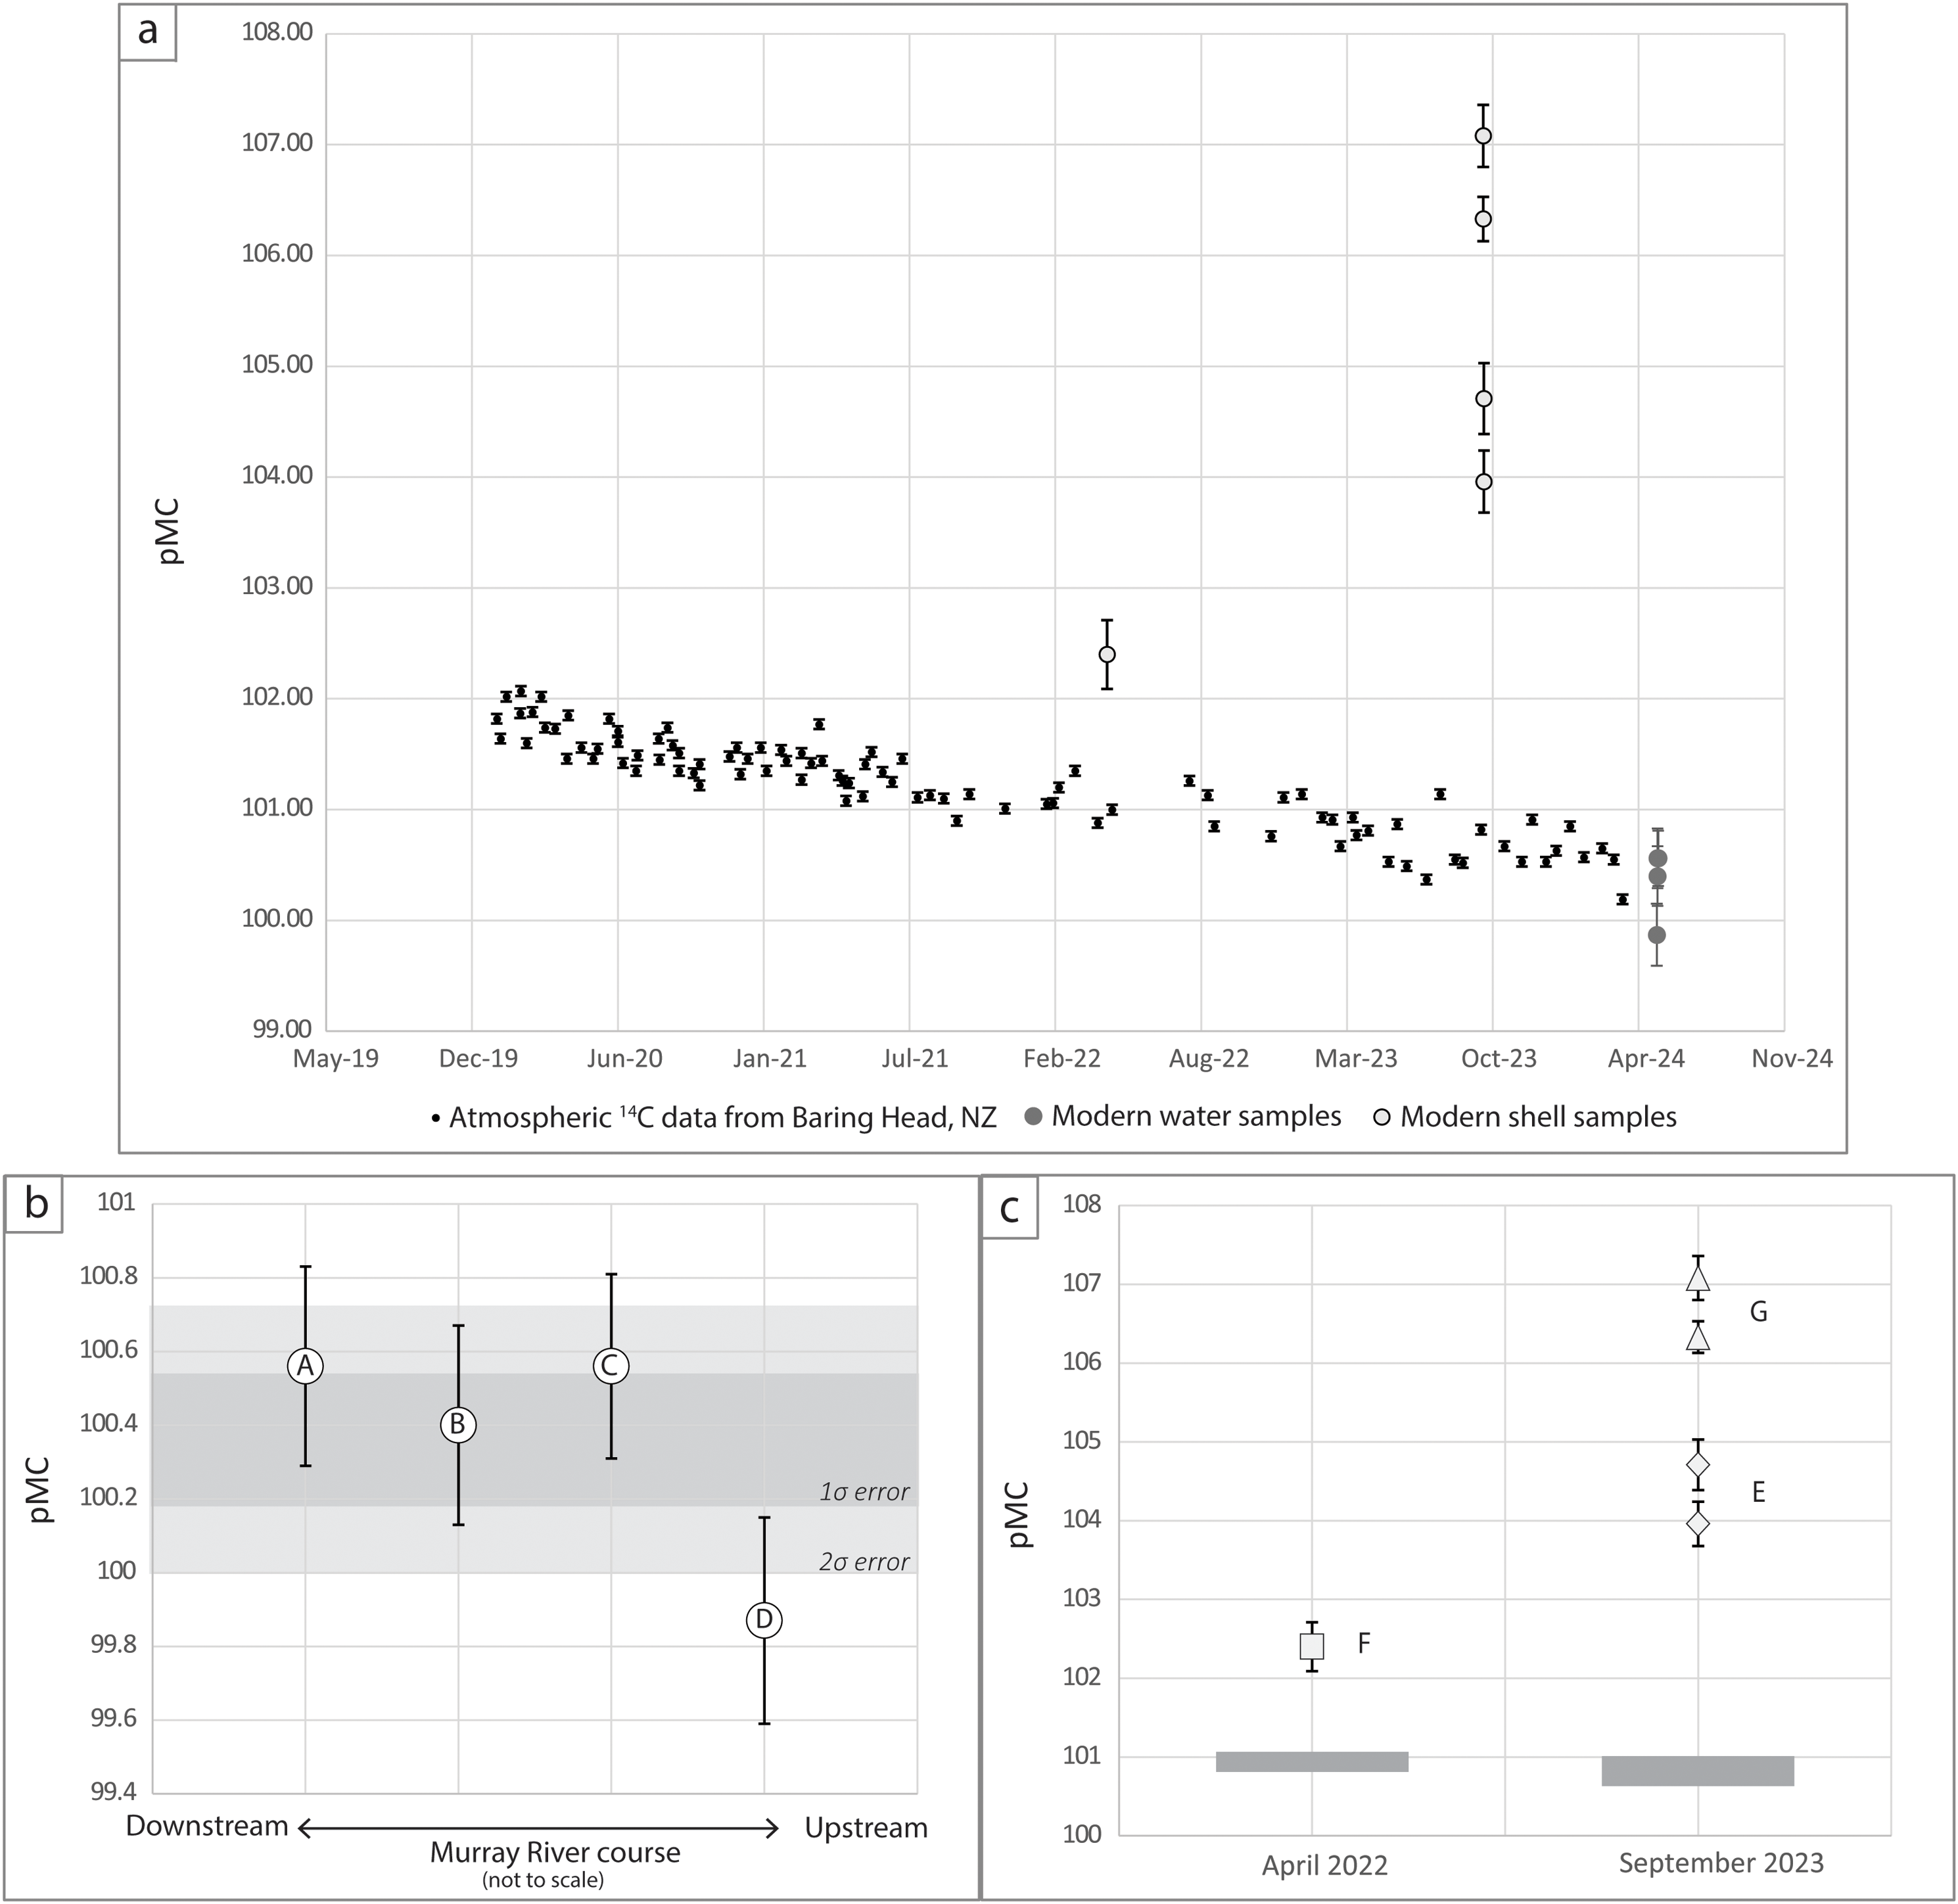


 Open access

