


I. INTRODUCTION AND BACKGROUND
Thermoelectric converters based on the Seebeck and Peltier effects enable the direct transformation of heat into electricity and solid-state refrigeration. While solar panels convert light into electricity, thermoelectric devices can make use of waste heat and be used as heat pump as well. They are compact and maintenance free. The range of applications of thermoelectric devices is potentially very broad, e.g., for converting exhaust gas into electricity, to refresh car passengers instead of the whole car, or simply to maintain laser source or battery to their optimal operating temperature. It is, therefore, not surprising that thermoelectric science and technology has found a renewal of interest because they are contributing to build a more energy-efficient society.Reference Tritt1 However, only about 6% of wasted heat could be actually converted to electricity with thermoelectric devices, the limiting factor being the performance of the functional materials that are very special semiconductors.
Within today’s thermoelectric device technology, solid solutions based on Bi2Te3 are the best-studied and most useful semiconductors for cooling and low-grade waste heat recovery in the temperature range between 25 and 250 °C. Bi2Te3-based thermoelectric materials show figure of merit values ZT = (S 2σ/λ)T close to 1, where S, σ, and λ are the Seebeck coefficient, the electrical conductivity, and thermal conductivity, respectively, and T is the ambient temperature.
The efforts done so far to improve the performance level of the Bi2Te3-based materials focus on the following three issues: (i) Extension of the operating temperature range, e.g., by doping. (ii) Enhancement of the figure of merit ZT by nanostructuring. (iii) Enhancement of the mechanical properties by powder metallurgy.Reference Böttner, Ebling, Jacquot, König, Kirste and Schmidt2
In our first publications on that topic, it was shown that PbTe is an acceptor in (Bi,Sb)2Te3 and that the maximum of the figure of merit could be shifted to higher temperature.Reference Ebling, Jacquot, Jägle, Böttner, Kühn and Kirste3 The best thermoelectric performances were obtained with 0.3 wt%PbTe. In addition, the crystal structure of PbTe and (Bi,Sb)2Te3 being different, both materials are likely immiscible, thus making this material system a suitable candidate for natural nanostructuring and large-scale production. Nevertheless, the solubility limit of this material system is not well known. When the solubility is determined visually, it depends on the imaging technique (optical or electronic microscopy) and sample preparation (cooling rate, polishing, and etching). Therefore, up to this work, nanostructuring was not observed in PbTe-(Bi,Sb)2Te3. When the melt composed of (Bi,Sb)2Te3 and 10 mol%PbTe was quenched in water,Reference Böttner, Ebling, Jacquot, König, Kirste and Schmidt2 it was manifested that there was a spinodal decomposition. Features on the micrometer scale were visible. This is interesting because spinodal decomposition has been proven to be an effective way to increase the figure of merit.Reference Dado, Gelbstein, Mogilansky, Ezersky and Dariel4, Reference Gelbstein, Dado, Yehuda, Sadia, Dashevsky and Dariel5 An improvement of the thermoelectric performance of (Bi,Sb)2Te3 + 0.1–0.3 wt%PbTe over (Bi,Sb)2Te3 was obtained in Ref. Reference Ebling, Jacquot, Jägle, Böttner, Kühn and Kirste3. Unfortunately, only the coarse microstructure of (Bi,Sb)2Te3-10 mol%PbTe was imaged. However, nanometer-sized features are even more likely to increase the figure of merit.Reference Dresselhaus, Chen, Ren, Dresselhaus, Henry and Fleurial6 Natural nanostructures (nns) similar to a superlattice structure have been already found in Bi2Te3-based materials prepared using various methods,Reference Peranio, Eibl and Nurnus7 providing an explanation for the low thermal conductivity of this workhorse materials for thermoelectric applications. But, it is not sure that the density of defect reaches up to now has a significant impact on the transport properties. A higher cooling rate could help decrease the characteristic feature size obtained in (Bi,Sb)2Te3-PbTe and increase in the density of nanostructures like the nns than could be obtained.
It is known at least since the 1980s that very high cooling rates up to 108 K·s−1 can be reached by melt spinning process and that materials with excellent thermoelectric properties can be produced.Reference Glazov and Yatmanov8, Reference Koukharenkou, Fretya, Shepelevich and Tedenac9 Nevertheless, transmission electron imaging of the samples has not been reported in Refs. Reference Glazov and Yatmanov8 and Reference Koukharenkou, Fretya, Shepelevich and Tedenac9 Therefore, in a second publication, we prepared (Bi,Sb)2Te3 + 0.3 wt%PbTe material by melt spinning and spark plasma sintering.Reference Ebling, Jacquot, Böttner, Kirste and Schmidt10 The transport properties were reported and transmission electron micrographs (TEM) were obtained before and after annealing only for the melt-spun materials before the sintering. The figure of merit reaches a respectable value of 0.9 at 360 K, even if the sintering parameters were not optimized. Still the figure of merit seemed to be lower than the materials quenched in water and directly compacted by spark plasma sintering, whose optimal sintering parameter was carefully determined. Nevertheless, it should be pointed out that the thermal conductivity in Ref. Reference Ebling, Jacquot, Böttner, Kirste and Schmidt10 was measured along the sintering direction, whereas the electrical properties were measured perpendicular to it. The crystal structure of Bi2Te3-based material is known to be anisotropic; the sintered material is texturized with the lowest value of the thermal conductivity along the pressing direction.Reference Jiang, Chen, Bai, Yao and Wang11 Since the grain size of melt-spun spark plasma sintered (MS-SPS) is much smaller than materials quenched in water and sintered (QW-SPS) materials and the degree of anisotropy is a function of the grain size, the figure of merit of MS-SPS may be less overestimated than QW-SPS materials measured in similar condition.Reference Lim, Kim, Kim, Lee, Lee and Lee12
High resolution electron transmission imaging in Ref. Reference Ebling, Jacquot, Böttner, Kirste and Schmidt10 shows clearly a phase disorder at the nanometer scale, proving that melt-spun material, even after annealing, is nanostructured. Nevertheless, after annealing, a nns like in Refs. Reference Dresselhaus, Chen, Ren, Dresselhaus, Henry and Fleurial6 and Reference Peranio, Eibl and Nurnus7 was more hardly found. Phase disorder has also been found in hot-extruded Bi2Te3Reference Chen, Suzuki, Miura, Nishimura and Ikeda13 and SPS materials,Reference Ma, Hao, Poudel, Lan, Yu, Wang, Chen and Ren14 but they are not found in unidirectional solidified materials. It should be underlined that at least in Ref. Reference Chen, Suzuki, Miura, Nishimura and Ikeda13, nanometer-scale phase disorders are believed to decrease the thermoelectric performance of Bi2Te3. But in Ref. Reference Xie, He, Kang, Tang, Zhu, Laver, Wang, Copley, Brown, Zhang and Tritt15, MS-SPS (Bi,Sb)2Te3 reaches apparently an impressive ZT of 1.5 at 390 K because of an increase in the Seebeck coefficient and a decrease in the lattice thermal conductivity. ZT value of 1.56 at 300 K has been reported by the same author.Reference Xie, Tang, Yan, Zhang and Tritt16
The primary objective of this work consists in a detailed investigation of the microstructure of (Bi,Sb)2Te3 with an addition of 0.1, 0.5, 2, and 4 mol%PbTe quenched in water and in the explanation of the effect of the cooling rate and the heat treatment on the transport properties. A secondary objective was to compare the microstructure of melt-spun (Bi,Sb)2Te3 + 4 mol%PbTe with the microstructure of the same material quenched in water. Since no such spinodal decomposition like in Ref. Reference Ebling, Jacquot, Jägle, Böttner, Kühn and Kirste3 can be observed in the melt-spun material by scanning electron microscopy (SEM), TEM was used and the chemical composition was analyzed at the nanometer scale. In addition, we look for nns in melt-spun (Bi,Sb)2Te3 and search the origin of this natural nanostructuring. Finally, transport properties measured on MS-SPS and QW-SPS materials are compared after optimization of their melt spinning and sintering parameters to figure out if the higher cooling rate during the solidification of the melt of the MS-SPS materials influences positively the transport properties. Particularities of the MS-SPS material in comparison with QW-SPS material are discussed from the theoretical point of view as well.
II. MATERIAL PREPARATION ROUTES AND EXPERIMENTAL DETAILS
A. Materials quenched in water
Quartz ampoules previously cleaned with HF (hydrofluoric acid) were filled with commercial (Bi,Sb)2Te3 and 0.1, 0.5, 2, and 4 mol%PbTe. The ampoules were evacuated, sealed, and put in a rocking furnace at 1050 °C for 24 h. The materials were subsequently quenched into water. The microstructure of (Bi,Sb)2Te3-PbTe composites obtained was studied by cutting, polishing, and etching the samples with aqua regia (1:1:1 solution of HCL (32%):HNO3(65%):H2O), which etches more effectively (Bi,Sb)2Te3 than PbTe and reveals the features by SEM than could not be seen, for example, with an optical microscope or without etching (Fig. 1). The lamellar structure that was also found in Ref. Reference Ebling, Jacquot, Jägle, Böttner, Kühn and Kirste3 is present even when there is only 0.1 mol%PbTe. The fine stripes are not pure PbTe but PbTe-rich region of the sample. It is a modulation of the chemical composition that is observed. The modulation of the chemical composition may explain the lower thermal conductivity and the slightly better thermoelectric performance of (Bi,Sb)2Te3 + X wt%PbTe (X = 0.05, 0.1) over (Bi,Sb)2Te3 obtained in Ref. Reference Ebling, Jacquot, Jägle, Böttner, Kühn and Kirste3 even at room temperature.
Scanning electron micrograph of (Bi,Sb)2Te3 + X mol%PbTe (X = 0.1, 0.5, 2, and 4 mol%) quenched in water, polished and etched chemically to reveal the internal microstructure.

The figure of merit of (Bi,Sb)2Te3 + X mol%PbTe (X = 0, 2, 4) quenched in water has been measured at room temperature before and after annealing at 407 °C. The thermoelectric performance data are poor but are found improved after annealing [Fig. 2(d)]. The samples undergo degradation at an addition of 2 and 4 mol%PbTe. The material system (Bi,Sb)2Te3-PbTe is consequently only useful for thermoelectric application below 0.5 wt%PbTe. This result is also supported by measurement done at higher temperature.Reference Ebling, Jacquot, Böttner, Kirste and Schmidt10 Interesting is that the results presented in Fig. 2 show that the reasons for the improvement of the thermoelectric performance depend on the presence or absence of PbTe in the material. If there is no PbTe, the Seebeck coefficient [Fig. 2(a)] increases significantly by annealing, whereas the electrical conductivity [Fig. 2(b)] and thermal conductivity [Fig. 2(c)] do not change significantly. If there is PbTe, the electrical conductivity increases very quickly by annealing, whereas the Seebeck coefficient increases only slightly. The most likely explanation is that PbTe can be considered like an impurity that should be activated to be fully electrically active. In the absence of PbTe, there may be a fluctuation of chemical composition around the nominal composition of (Bi, Sb)2Te3 that prevents the carrier concentration to be to its optimal level. This fluctuation results in low Seebeck coefficients of the material quenched in water. Such fluctuation of the chemical composition has been observed in materials synthesized by the Bridgman technique.Reference Peranio and Eibl17 For melt-spun material, the composition is uniform on the micrometer scale and above, but the Bi and Te concentrations are not homogeneous on the nanoscale. Therefore, the Seebeck coefficient of melt-spun material can be increased by rapid thermal annealing within few seconds.Reference Ebling, Jacquot, Jägle, Böttner, Kühn and Kirste3, Reference Ebling, Jacquot, Böttner, Kirste and Schmidt10 Since the kinetics of the process that increases the Seebeck coefficient of the materials quenched in water is much slower, the characteristic size of disorders in the chemical composition is probably in the millimeter range.
Transport properties of (Bi,Sb)2Te3-PbTe quenched in water. Filled squares represent before annealing, whereas the open and half-open squares represent after annealing. The sample without PbTe content has been annealed up to 10 days, whereas 2 h was enough to bring the sample with PbTe content 2 and 4 mol% to a state close to the thermodynamic equilibrium.

B. Preparation of melt-spun materials for imaging by TEM
In this work, two types of samples have been investigated: (i) a pure (Bi,Sb)2Te3 sample without PbTe and (ii) a (Bi,Sb)2Te3 sample with 4 mol%PbTe.
The sample has been prepared by melting in an evacuated ampoule and subsequently quenched in water. The obtained material was transformed by melt spinning into platelets (melt spinner, Phoenix Scientific Industries Ltd., Halisham, East Sussex, UK). The pouring temperature for the sample without PbTe and with 4 mol%PbTe was 750 and 940 °C, respectively. The relative velocity between the cooper wheel and the nozzle was 12 m s−1. The materials were melt-spun at atmospheric pressure. The composition of the sample was checked in a TEM by means of energy dispersive x-ray spectroscopy (EDXS).
C. SPS materials
The material has been sintered with a HP D 250/1 (FCT Systeme GmbH, Rauenstein, Germany). The sintered samples are discs with a diameter of 45 mm and a typical thickness between 2 and 3 mm.
D. Preparation of the TEM specimens
The preparation of the specimens for TEM started with cutting the platelets and embedding a piece in epoxy. The resulting discs were thinned by grinding, dimpling, and finally, by ion milling with Ar+ ions of decreasing energy from 4 keV down to 2 keV. By doing this, specimens also suitable for high resolution TEM (HRTEM) could be obtained.
E. TEM instrumentation and data processing
For the TEM investigation including HRTEM, electron diffraction, and EDXS, an FEI Tecnai F30 (FEI Company, Hillsboro, OR) equipped with field emission gun working at 300 kV, SuperTwin lens (point resolution 0.19 nm), Scanning TEM unit, and EDX spectrometer (EDAX, AMETEK, Inc., Berwyn, PA; with Si crystal and ultra thin window) were used. The calculations for explaining the HRTEM results were done by Stadelmann’s EMS package.Reference Stadelmann18 For indexing of the diffraction patterns, the software package ELDISCAReference Thomas and Gemming19 was used. Starting point for the interpretation of our structural investigations on the (Bi,Sb)2Te3-PbTe samples was the known crystal structure of Bi2Te3 as shown in Fig. 3. A very similar crystal structure is known for (Bi,Sb)2Te3.Reference Stasova and Abrikosov20
Crystal structure of Bi2Te3.

F. Transport properties measurement
The materials were cut and measured with a measurement system developed using the Fraunhofer-IPM (IPM-SR1).Reference Jacquot, Pernau, König, Nussel, Bartel, Ebling and Jaegle21 The thermal conductivity was measured with the laser flash method (LFA457, NETZSCH-Gerätebau GmbH, Selb, Germany). The sample size was typically 1.4 × 1.4 × 10 mm3 and 10 × 10 × 2 mm3 for the power factor and the thermal conductivity measurements, respectively
III. RESULTS AND DISCUSSIONS
A. Pure (Bi,Sb)2Te3 samples
The typical microstructure of the pure (Bi,Sb)2Te3 sample is characterized by a pronounced twinning (Fig. 4). First, we can confirm that the crystal structure of our sample represents the structure of Bi2Te3 as shown in Fig. 3.Reference Lange22 The good agreement of the measured diffraction pattern with the calculation, which can be seen in Fig. 5(a), gives a first indication for the structure of the (Bi,Sb)2Te3 sample. To see this more clearly, a comparison between measured and calculated HRTEM images was made (Fig. 6). The HRTEM image in Fig. 6(b) was taken from the detail marked in Fig. 6(a). It is a part of the area selected for the diffraction pattern in Fig. 5. The best fit of the JEMS calculation was reached by use of the following parameters: specimen thickness 13 nm, defocus 78 nm, and coherent illumination with energy spread of 1 eV, which are in sufficient agreement with the experimental conditions. The excellent match of electron micrograph and calculated image confirms that the crystal structure of the pure (Bi,Sb)2Te3 sample equals the structure of Bi2Te3.
Transmission electron microscope (TEM) bright field micrographs of the pure melt-spun (Bi0.25Sb0.75)2Te3 sample showing twins. The specimen was tilted by 4° between image (a) and (b).

TEM bright field micrograph of the melt-spun (Bi0.25Sb0.75)2Te3 sample (a) of a triple point of grain boundaries with mark of the selected area for the diffraction pattern (b) that is indexed on the basis of the Bi2Te3 structure, zone axis [1 0 0].

TEM bright field micrograph of the melt-spun (Bi0.25Sb0.75)2Te3 sample (a) with mark of the magnified area for high resolution TEM (HRTEM) image (b). (c) Two elemental units of Bi2Te3 in [1 0 0] projection and HRTEM image calculated by JEMSReference Peranio, Eibl and Nurnus7 using this model. The calculated image is inserted into the measured image.

A closer look shows a lamella-like contrast within the twins depending dramatically on the orientation between crystal lattice and electron beam direction that is typical for diffraction contrast [Figs. 7(a) and 7(b)].
TEM bright field micrographs of two grains of the melt-spun (Bi0.25Sb0.75)2Te3 sample showing the same specimen area, but on the micrograph (b) the specimen is tilted in comparison with the micrograph (a). (c) Lamella structure more in detail with sketch of the crystallographic planes and directions. (d) Diffraction pattern of the area of (c) with zone axis [5 5 1], Rotation of the diffraction pattern against the image is corrected.

The thickness of lamellas amounts to 10–11 nm, which is in good agreement with the so-called natural nanostructure described by Peranio et al.Reference Peranio and Eibl23 in Bi2Te3.Reference Jiang, Chen, Bai, Yao and Wang11 Following this study, the nns may likely be created by a sinusoidal displacement field.Reference Peranio and Eibl23
The analysis of TEM bright field images and diffraction patterns leads to the conclusion that the lamellas are parallel to the (2 −3 5) lattice planes and perpendicular to the (−1 0 5) planes. Interestingly, we found in HRTEM images a shift of the (−1 0 5) planes with a periodicity of about 10 nm that is close to the thickness of the nns lamellas (Fig. 8).
(a) HRTEM image of the lamella-like structure in the melt-spun (Bi0.25Sb0.75)2Te3 sample. (−1 0 5) lattice fringes with distances of 0.32 nm are visible. Two thick arrows mark the positions of lattice shifts. (b) Sketch of the unit cells in [5 5 1] viewing direction.

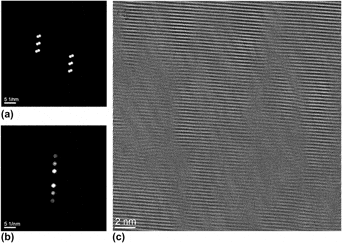
On the other hand, a closer look at the diffraction pattern in Fig. 7(d) shows some additional reflexes. To understand these reflexes, we use the Fourier transformation of the HRTEM image. In principle, it shows the same reflex splitting like the diffraction pattern.
A filtering in the Fourier transform with selection of the reflexes as shown in Figs. 9(a) and 9(b) leads after inverse Fourier transformation to the image Fig. 9(c). Two facts are mainly evident: first, domains with sizes of 2–5 nm are visible separated by stronger and weaker contrasts, and second, the shifts of the (−1 0 5) lattice fringes are connected with torsion of the lattice fringes, which are approximately perpendicular to the (−1 0 5) planes. The atomic places within the (1 0 −5) planes are not fixed and a suitable shift of the atoms can also lead to a projected shift of the (1 0 −5) planes as observed in the HRTEM image [Fig. 8(a)]. Obviously, this atomic shift is the “displacement field.”Reference Jiang, Chen, Bai, Yao and Wang11
Areas (a) and (b) of the melt-spun (Bi0.25Sb0.75)2Te3 sample within the Fourier transformation chosen for the inverse Fourier transformation. (c) Result of the inverse Fourier transformation.

The nns can be observed whenever the viewing direction allows to see a projection of the (−1 0 5) planes (see Fig. 10). The diffraction patterns with the zone axis [010] include the (−1 0 5) reflex but with lower intensity than in case of the [5 5 1] zone axis. Therefore, the nns is not so clearly visible as in Fig. 7(c). On the other hand, the orientation [8 4 1] does not include the (−1 0 5) reflex; the nns is invisible.
Triple point of three grains in the melt-spun (Bi0.25Sb0.75)2Te3 sample. (a) TEM overview image. (b) HRTEM image of the area marked in (a).

Using EDXS, we could not find any periodic fluctuations of the chemical composition correlated with the nns. Nevertheless, in grain boundaries, a depletion of bismuth and antimony could be detected (Fig. 11). This means that tellurium is in excess. Amorphous region of melt-spun (Bi,Sb)2Te3 have been found to be Te-rich.Reference Xie, Tang, Chen, Jin and Zhang24
Depletion of Bi and Sb in grain boundaries of the melt-spun (Bi0.25Sb0.75)2Te3 sample. (a) TEM bright field micrograph. (b) Sum of EDXS spectra along the position axis. (c) Line scan EDXS intensity profiles of Te, Sb, and Bi along the position axis (normalized intensity: the highest value of each profile is set to 1).

B. (Bi0.25Sb0.75)2Te3 samples with 4 mol%PbTe
At first, we want to confirm whether the crystal structure as shown in Fig. 1 is well suitable to describe the sample with PbTe (Fig. 12). The diffraction pattern [Fig. 12(b)] can be indexed without any disagreements using the crystal structure of Fig. 1 and the zone axis [20 10 1]. Without image simulations, it can be seen that the projection of the unit cell in the [20 10 1] direction agrees with the HRTEM image [Fig. 12(c)] very well.
(a) TEM bright field image of the melt-spun (Bi0.25Sb0.75)2 Te3 with 4 mol%PbTe sample: overview with indication of the area from that the details are taken. (b) Diffraction pattern indexed for zone axis [20 10 1]. (c) HRTEM image. (d) Sketch of the unit cells, viewing direction [20 10 1].

Twins are visible in Fig. 12(a), though not so numerously like in the sample without PbTe. This could be a consequence of the other dominant crystallographic direction observed in this sample. So far, it was also more difficult to find the nns in this sample but it was possible as shown in Fig. 13.
Lamella-like nanostructure in the melt-spun (Bi0.25Sb0.75)2 Te3 sample with 4 mol%PbTe. The inclusion was determined as Sb-O by EDXS.

Contrary to the behavior of the pure (Bi0.25Sb0.75)2Te3 sample, we found other chemical compositions of the inclusions at the grain boundaries. Figure 13 shows one of those that could be identified as Sb–O by EDXS. Within the grains, an enrichment of Pb probably exists but is lower than the detection limit of EDXS. In some of the grain boundaries, an enrichment of Pb could be found (see Fig. 14). The other elements were homogeneously distributed. Possibly, the enrichment of Pb within the grain boundaries influences the grain growth and, as a consequence, the creation of a smaller number of twins.
(a) TEM bright field image of the melt-spun (Bi0.25Sb0.75)2 Te3 sample with 4 mol%PbTe with marked trace of an EDXS line scan (“Position”). (b) EDXS line scan intensity profiles.

C. MS-SPS versus QW-SPS (Bi,Sb)2Te3 + 0.3 wt%PbTe
Quartz ampoules previously cleaned with HF were filled with commercial (Bi,Sb)2Te3 and PbTe. The ampoules were evacuated, sealed, and melted at a temperature just above the liquid temperature (612.5 + 5 °C) in a rocking furnace for 24 h. The melt was subsequently quenched into water. The prepared materials were either directly compacted by spark plasma sintering or melted again and quenched on a rotating copper wheel (melt spinning). Relatively small flakes (∼0.05 × 5 × 3 mm3) mixed with small spheres (<mm3) were obtained by melt spinning. The spheres are splatters that were solidified much more slowly not on the copper wheel but in the gaseous environment of the melt spinner. Thus, the grain size of the splatters was much larger than that of the flakes. The splatters (MS844) and flakes (MS839, MS841, MS842, and MS843) were sort out and sintered separately. The temperatures of the melt and the rotation speeds for the materials labeled MS839, MS841, MS842, and MS843 coming out of the melt spinner (diameter 300 mm) were 790, 700, 740, and 792 °C and 1910, 1273, 1273, and 1273 t/min, respectively. The force during compaction was maintained constant (75 kN), whereas the sintering temperature and the pulsed duration were varied for the MS-SPS material. The flakes and splatters were sintered with a dwell time of 1 and 0 min, respectively. The sintering temperature is reached at a speed of 100 °C/min. For sintering the QW-SPS materials, no current pulses are applied and a zero dwell time was used.
Since the melt spinning and sintering parameters have been varied, changes in the carrier concentration, mobility [Figs. 15(a) and 15(b)], and Seebeck coefficient [Figs. 16(a) and 16(b)] are observed. The carrier concentrations and mobilities of MS-SPS materials are systematically smaller than the QW-SPS materials. Therefore, the Seebeck coefficients of the melt-spun material are higher and the maximums are shifted to lower temperature. The electrical conductivity decreases when the temperature increases because there are more phonons to scatter the mobile charge carrier at high temperature. But since the mobility is a function of the carrier concentration, we have to admit that the holes are scattered not only by lattice but also by defects (e.g., impurities), operating at once in both MS-SPS and QW-SPS materials. Nevertheless, since the mobility of the MS-SPS material increases and the mobility of the QW-SPS material decreases as the carrier concentration increases, the degree of screening of the defects is not the same. In MS-SPS materials, the increase of the carrier concentration probably increases the degree of screening of the defects and this tends to decrease the scattering of the mobile charge carriers, thus increasing the mobility.Reference Goldsmid25, Reference Lundstrom26 This could be more quantitatively described by the Brooks–Herring formulae for charged-impurity scattering in semiconductors when the coulomb potential due to defects are strongly screened. Regarding the large phase disorder and high dislocation density in Fig. 9(c), the defects are probably dislocations. The role of dislocations on the mobility seems analogous in MS-SPS materials than in GaN films produced by electron cyclotron resonance plasma-assisted molecular-beam epitaxy.Reference Ng, Doppalapudi, Moustakas, Weimann and Eastman27 The higher Seebeck coefficient observed in MS-SPS materials reinforces the validity of the hypotheses that the mobile charge carriers are scattered at strongly screened defects because defects are screened if mobile charge is trapped. Thus, the concentration of mobile charge carrier is reduced and the Seebeck coefficient is increased as it is explained and simulated in Ref. Reference Jacquot, König, Bayer, Ebling, Schmidt and Jaegle28. It is tempting to justify the decrease of mobility when the carrier concentration increases by a scattering at ionized impurities without screening. But, why should the impurities not be screened at high carrier concentration, whereas at low concentration they are partially screened? It is indeed expressly written in Ref. Reference Goldsmid25 that impurities are screened when the carrier concentration is high. Therefore, impurities should even be more screened in QW-SPS materials than in MS-SPS materials. Furthermore, if we write the relaxation time in the form

Filled square, carrier concentration and opened square, carrier mobility of (Bi,Sb)2Te3-0.3 mol%PbTe melt-spun spark plasma sintered (MS-SPS) materials (a), in comparison with materials quenched in water and sintered (QW-SPS) (b) for various sintering temperatures and with (1 min) or without (0 min) current pulse to assist the sintering process.

Transport properties of MS-SPS materials in comparison with QW-SPS materials. (a, b) Seebeck coefficients, (c, d) electrical conductivity, (e, f) thermal conductivity, and (g, h) figure of merit of (a, c, e, h) MS-SPS and (b, d, f, h) QW-SPS (Bi,Sb)2Te3-0.3 mol%PbTe. The synthesis parameters are given in Fig. 15.

where E is the energy of the mobile charge carrier, kB is the Boltzmann’s constant, T is the temperature, and s is the exponent characteristic of the scattering process (s = −1/2, s = 3/2, and s = −1/2 for acoustic, ionized impurities, and strongly screened impurities, respectively),Reference Lundstrom26 and it is clear that only the scattering at acoustic deformations and at strongly screened impurities is compatible with the temperature dependence of the electrical conductivity shown in Figs. 16(c) and 16(d). The difficulty is, therefore, not to prove that the impurities are strongly screened even in QW-SPS materials but to understand why the mobility is an inverse function of the carrier concentration in QW-SPS materials.
The scattering rate of mobile charge carrier when the semiconductor is not degenerate is given byReference Lundstrom26
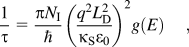
where κs is the relative dielectric constant, ε 0 is the permittivity of free space, N I is the concentration of impurities (e.g., defects that may be ionized), q is the electron’s charge, g(E) is the electronic density of state at the energy E of the valence’s band, and L D is the Debye length. The Debye length is the distance over which significant charge separation can occur, i.e., here it is the minimum distance below which the defects will not be ionized. The Debye length is given for a nondegenerated semiconductor by

where n 0 is the concentration of charge species, positive or negatively charged.
When the concentration of defect and charge carriers increases, the Debye length decreases. The diminution of the Debye length overcompensates the increase of static defects (N I) in Eq. (2) and the mobility increases as in MS-SPS materials. At higher carrier concentration, the volume of material where defects are not ionized diminished. Therefore, most of the defects in QW-MSP materials will be ionized as asserted in Ref. Reference Jacquot, König, Bayer, Ebling, Schmidt and Jaegle28.
Nevertheless, when the distance between defects is smaller than the Debye length, Eqs. (2) and (3) are not more valid.Reference Ridley29 In addition, heavily doped semiconductors are degenerated. A screening in the Thomas–Fermi approximation in which the potential energy varies in space must be considered.Reference Chazalviel30, Reference Tritt31 The scattering rate at strongly screened ionized impurities in the Thomas–Fermi approximation for heavily doped semiconductor has been calculated in Ref. Reference Kaiblinger-Grujin, Kosina, Köpf and Selberherr32. In this case, a decrease of the mobility as the carrier concentration increases has been obtained compatible with the experimental results shown in Fig. 15(b).
There is a clear correlation between the sintering temperature and the carrier concentration. The carrier concentration decreases as the sintering temperature decreases. This seems to be true for QW-SPS and MS-SPS materials. For the same sintering parameters, the MS-SPS sample no. 5 (made with splatters) does have a higher mobility and a higher carrier concentration than the sample no. 4 that is made with flakes. This is indeed the sample with the highest figure of merit in this study [Figs. 16(g) and 16(h)]. Therefore, it cannot be concluded that the highest cooling rate leads to the highest figure of merit. There is an optimum to be found. The best MS-SPS sample does have higher Seebeck coefficients [Figs. 16(a) and 16(b)], slightly lower thermal conductivity [Figs. 16(e) and 16(f)] but a lower mobility and electrical conductivity (Figs. 16(c) and 16(d)] than the best QW-SPS sample. Nevertheless, the thermal conductivity of the QW-SPS sample no. 2 whose electrical conductivity is similar to the MS-SPS sample no. 5 is the lowest. A separation of the electronic and lattice contribution to the thermal conductivity would be useful to figure out if the defects present in MS-SPS material reduce the lattice thermal conductivity. But this can be done only with a very sophisticated model like in Ref. Reference Jacquot, Farag, Jaegle, Bobeth, Schmidt, Ebling and Böttner33, and a measurement of the anisotropy must be taken into account.
IV. CONCLUSIONS
The cooling rate does have a clear influence on the microstructure, density of defects, and transport properties. Microscale spinodal decomposition is observed down to 0.1 wt%PbTe in materials quenched in water, whereas it was not possible to see a chemical composition inhomogeneity within the grain in melt-spun 4 mol%PbTe materials. A very high density of nns and various defects are found in melt-spun materials. The structural change that gives rise to the nns has been identified. Nevertheless, the comparison of the thermal conductivities measured in the direction perpendicular to the sintering direction of materials quenched in water and on a rotating copper wheel does not let us conclude that MS-SPS materials do have a lower thermal conductivity than QW-SPS materials. If a slightly larger thermoelectric figure of merit is obtained in MS-SPS (Bi,Sb)2Te3 + 0.3 wt%PbTe, then this is clearly caused by a larger Seebeck coefficient. Fundamental properties for the thermoelectric performance (mobility and carrier concentration) are found to be modified by the cooling rate. The degree of screening of the impurities (defects) and the influence of these defects on the Fermi level are found to be fundamental for the modeling of thermoelectric materials. It is concluded that a control of the cooling rate is important to maximize the thermoelectric performance.
ACKNOWLEDGMENTS
The authors acknowledge gratefully the synthesis of the PbTe by BASF (Germany) and the preparation of the quenched materials by the Institut Jean Lamour—UMR 7198 CNRS (France).



