Introduction
In the human population, there is a high frequency of variant cone photopigments in which amino acids have been interchanged between ancestral long- (L) and middle- (M) wavelength opsins by a high rate of recombination between the respective genes, OPN1LW and OPN1MW. A subset of these cone opsin “interchange” variants have been linked to a growing number of human eye disorders (Carroll et al., Reference Carroll, Neitz, Hofer, Neitz and Williams2004; Crognale et al., Reference Crognale, Fry, Highsmith, Haegerstrom-Portnoy, Neitz, Neitz and Webster2004; Neitz et al., Reference Neitz, Carroll, Renner, Knau, Werner and Neitz2004; Mizrahi-Meissonnier et al., Reference Mizrahi-Meissonnier, Merin, Banin and Sharon2010; Carroll et al., Reference Carroll, Dubra, Gardner, Mizrahi-Meissonnier, Cooper, Dubis, Nordgren, Genead, Connor, Stepien, Sharon, Hunt, Banin, Hardcastle, Moore, Williams, Fishman, Neitz, Neitz and Michaelides2012; McClements et al., Reference McClements, Davies, Michaelides, Young, Neitz, MacLaren, Moore and Hunt2013). Thus far, understanding opsin interchange variants and their role in vision defects has come from the study of human subjects or cell lines carrying mutant opsin genes in vitro. It would be beneficial to have an in vivo system that could be used to understand the disease at a mechanistic level and to evaluate potential therapies. With this goal in mind, the purpose of the present study was to characterize a mouse line that carries a targeted gene replacement similar to the one previously described (Smallwood et al., Reference Smallwood, Olveczky, Williams, Jacobs, Reese, Meister and Nathans2003). The final engineered M-opsin locus encodes an opsin that is identical to a human L-opsin except for 13 differences among the N-terminal 32 amino acids that are due to the fact that the engineered locus retains exon 1 from the endogenous mouse gene.
The human OPN1LW and OPN1MW genes each have six exons. The first and sixth exons do not normally vary. Exon 5 specifies seven amino acid positions that differ in a stereotyped manner between L- and M-cone photopigments, and two of these positions (277 and 285) are responsible for the majority of the separation between the human L and M cones. Exons 2, 3, and 4 together specify 11 amino acid positions that vary because of recombination between the ancestral L and M genes (for a recent review, see Neitz & Neitz, Reference Neitz and Neitz2011).
Dimorphisms at amino acid positions 116, 180, 230, and 233 are known to shift the tuning of the absorption spectra of the photopigments (Neitz et al., Reference Neitz, Neitz and Jacobs1989; Neitz et al., Reference Neitz, Neitz and Jacobs1991; Merbs & Nathans, Reference Merbs and Nathans1993; Asenjo et al., Reference Asenjo, Rim and Oprian1994). Until recently, these four residues were assumed only to affect spectral tuning, whereas all other variable amino acid positions were believed to be without consequences for cone function or vision. However, several recent studies have identified combinations of the polymorphic amino acid positions encoded by exon 3 as being deleterious. The amino acids at the dimorphic positions encoded by exon 3 are as follows: 153 is either methionine (M) or leucine (L), 171 is either valine (V) or isoleucine (I), 174 is either alanine (A) or valine, position 178 is either valine or isoleucine, and position 180 is either alanine or serine (S). One deleterious variant has the amino acids leucine, isoleucine, alanine, valine, and alanine at amino acid positions 153, 171, 174, 178, and 180, respectively, and is abbreviated LIAVA. This variant has been associated with a color vision deficiency and blue cone monochromacy (Carroll et al., Reference Carroll, Neitz, Hofer, Neitz and Williams2004; Crognale et al., Reference Crognale, Fry, Highsmith, Haegerstrom-Portnoy, Neitz, Neitz and Webster2004; Neitz et al., Reference Neitz, Carroll, Renner, Knau, Werner and Neitz2004; Mizrahi-Meissonnier et al., Reference Mizrahi-Meissonnier, Merin, Banin and Sharon2010). A second variant that differs from LIAVA only at position 171, where it has valine instead of isoleucine (LVAVA), has been associated with high myopia, cone dysfunction, and cone dystrophy (Carroll et al., Reference Carroll, Dubra, Gardner, Mizrahi-Meissonnier, Cooper, Dubis, Nordgren, Genead, Connor, Stepien, Sharon, Hunt, Banin, Hardcastle, Moore, Williams, Fishman, Neitz, Neitz and Michaelides2012; McClements et al., Reference McClements, Davies, Michaelides, Young, Neitz, MacLaren, Moore and Hunt2013).
Unlike humans, mice naturally coexpress short wavelength (S) and M opsins in a subset of cone photoreceptors (Szél et al., Reference Szél, Röhlich, Mieziewska, Aguirre and van Veen1993; Röhlich et al., Reference Röhlich, van Veen and Szél1994; Applebury et al., Reference Applebury, Antoch, Baxter, Chun, Kalk, Farhangfar, Kage, Krzystolik, Lyass and Robbins2000). There is a clear gradient of coexpression across the retina. Three to five percent of cones in dorsal retina express S opsin, the majority of which express no detectable M opsin; however, most cones in the dorsal retina express M opsin with no detectable S opsin. In contrast, in ventral retina 8–20% of cones express only S opsin, while the remainder coexpress S opsin with varying amounts of M opsin (Haverkamp et al., Reference Haverkamp, Wassle, Duebel, Kuner, Augustine, Feng and Euler2005). In adult human retina, L and M cones typically express a single opsin gene and do not coexpress S opsin. Using mice to investigate the effects of L- or M-opsin variants associated with vision abnormalities on cone structure, function, and viability may give results that are difficult to interpret due to the coexpression of S opsin in the cones expressing the L or M variant. Thus, a knockout of the mouse S-opsin gene was generated, and S-opsin knockout mice were crossed with mice harboring a targeted replacement of the X-chromosome opsin gene to generate mice that express a single opsin per cone photoreceptor. However, because mice normally coexpress M and S opsins in a majority of cones, it is possible that the absence of S opsin is deleterious to mouse cones. Here, we describe mice with a modified X-chromosome opsin locus that encodes an LIAIS variant of L-opsin, designated Opn1lw LIAIS, which is a relatively common, normal variant in humans and has the fewest amino acid differences compared to the LIAVA variant that has been demonstrated to cause photoreceptor dysfunction in humans (Carroll et al., Reference Carroll, Neitz, Hofer, Neitz and Williams2004). We evaluated Opn1lw LIAIS mice with and without the intact S-opsin gene to assess the effects of the Opn1lw LIAIS variant on cone structure, function, and viability in the presence and absence of S opsin.
Materials and methods
Animals
All experiments using animals conformed to the principles regarding the care and use of animals adopted by the American Physiological Society and the Society for Neuroscience and were approved by the Animal Care and Use Committee at the University of Washington.
Genetically modified mice were created by Ozgene, Inc. (Perth, Australia) using targeting constructs according to our specifications. One construct was designed to replace the endogenous mouse Opn1mw gene with a human cDNA encoding a normal L cone opsin with the following amino acids at the polymorphic positions encoded by exon 2, 3, and 4: T65, I111, S116, L153, I171, A174, I178, S180, I230, A233, and M236. The modified locus in mice in this study was Opn1lw LIAIS/LIAIS for females or Opn1lw LIAIS/Y for males, but for simplicity, here the locus is referred to as Opn1lw LIAIS. The second construct was designed to create a large deletion within the mouse Opn1sw gene, thereby creating an S-opsin knockout mouse, designated Opn1sw −/−. The modified loci were confirmed by direct sequencing of genomic DNA and sequencing of cDNA derived from retinal messenger RNA (mRNA).
Mice used in this study were C57BL/6. Mice that were wildtype at both the M and S-opsin gene loci are designated Opn1mw/Opn1sw +/+, and the corresponding S-opsin knockout mice are designated Opn1mw/Opn1sw −/−. The L-opsin gene replacement mice are designated Opn1lw LIAIS/Opn1sw +/+, and the corresponding S-opsin knockout mice are designated Opn1lw LIAIS/Opn1sw −/−. Genetically modified opsin loci were confirmed to be correct by direct sequencing in all founder animals. The genotypes of all animals used in this study were confirmed using the polymerase chain reaction (PCR).
Targeted replacement of the Opn1mw gene
A targeting vector was created to replace a segment of the endogenous mouse Opn1mw gene on the X-chromosome with a corresponding segment of a human L-opsin cDNA via homologous recombination. Recombination was mediated by a 5′ homology arm that was 11.9 kb in length, and a 3′ homology arm that was 2.8 kb. The 5′ arm extended from nucleotide position 71,366,218, which is upstream of the Opn1mw gene on mouse X-chromosome, through codon 65 in exon 2 of the mouse Opn1mw gene (nucleotide position 71,378,135 July 2007 version of mouse genome assembly). The Quick Change site directed mutagenesis kit (Stratagene, La Jolla, CA) was used to alter mouse codons 58, 62, and 65 to encode the same amino acids as the corresponding codons in human OPN1LW. Amino acids 58 and 62 do not vary among human OPN1LW genes but codon 65 does, and in our construct, this codon specifies threonine (T65). Mouse codon 58 was changed from ACC to GTC, mouse codon 62 was changed from CTT to TTT, and mouse codon 65 was changed from GTT to ACT. The 3′ homology arm extended from mouse X-chromosome nucleotide 71,389,460 to 71,392,250, which lies within intron 5 of the mouse Opn1mw gene. Between the 5′ and 3′ homology arms in the targeting construct was a segment of the human cDNA from plasmid hs7 (Nathans et al., Reference Nathans, Thomas and Hogness1986) extending from codon 66 through the polyadenylation signal. A PGK-NEO cassette flanked by loxP sites was positioned between the human cDNA fragment and the 3′ homology arm, and the cassette was deleted by Cre-mediated recombination in the final modified locus. The endogenous mouse Opn1mw locus and the targeted replacement locus are illustrated in Fig. 1A and 1B. The opsin encoded by the final modified locus retained the amino acids specified by mouse exon 1, but the amino acids specified by exon 2 through 6 corresponded to those encoded by a human L-opsin that is abbreviated LIAIS according to the previously described convention. The exon 2 encoded dimorphic positions were T65, I111, S116, and the exon 4 encoded dimorphic positions were I230, A233, and M236.
Schematics of the wildtype and modified Opn1mw and Opn1sw mouse genes. Rectangles indicate the exons and the black lines indicate the introns and nonexonic DNA flanking the loci. The first and last exons include the 5′ and 3′ untranslated regions, in addition to the protein-coding regions. The locations of the ATG start codon, TGA stop codon, and the polyadenlyation signals are marked. (A) The endogenous Opn1mw gene. (B) A targeting construct containing human cDNA encoding exons 2 through 6 replaced the entire Opn1mw gene, except for exon 1, intron 1, and part of exon 2. Exon 2 is a mouse/human hybrid gene (boundary denoted by dashed line), although the three codons in the mouse sequence encoding amino acids inconsistent with the human L/M-opsin were changed by site-directed mutagenesis to the human specifications. Three versions of this Opn1lw LIAIS targeting vector have been made, each encoding the amino acid sequence, LIAIS, LIAVA, or LVAVA. (C) The wild-type Opn1sw gene. (D) The targeted locus carries a 1324 base pair deletion between introns 1 and 4. In generating the knockout gene, an intermediate construct was generated (not shown) in which a neomycin selectable marker, flanked by one loxP site, was integrated by homologous recombination into intron 4 and a second loxP site was introduced into intron 1. Mice carrying the intermediate locus were crossed to mice carrying the gene for Cre-recombinase. Offsprings in which the neomycin resistance marker and exons 2 through 4 of the Opn1sw locus were deleted by Cre-mediated recombination were bred to homozygosity. These mice were homozygous for the Opn1sw knockout gene, which was confirmed by complete sequencing of the locus. The removal of the neomycin selectable marker via Cre-recombinase left a loxP site in what is left of intron 1, and its location is labeled.

Opn1sw knockout
A targeting construct was designed to delete exons 2, 3, and 4 of the Opn1sw gene on mouse chromosome 6 in order to create an S-opsin knockout. Deletion of exons 2 through 4 was achieved by homologous recombination between the targeting vector and the endogenous Opn1sw locus. The 5′ homology arm extended from within intron 1 of the mouse Opn1sw gene upstream by 3.9 kb and the 3′ homology arm extended from within intron 4 to 3.6 kb downstream. The endogenous Opn1sw gene and the knockout are illustrated in Fig. 1C and 1D.
Reverse transcriptase PCR on opsin mRNA
Animals were euthanized, retinas were immediately isolated and stored in RNALater (Ambion, Austin, TX), and subsequently retinal RNA was isolated using the RNeasy kit (Qiagen, Gaithersburg, MD). Retinas of five Opn1sw −/− mice were pooled and retinas from four Opn1sw +/+ mice were pooled. Reverse transcriptase (RT)-PCR was performed using the RNA PCR kit (ABI), and RNA samples were not treated with DNAse I. For the Opn1sw +/+ mice, reactions using primer pair 1 (Table 1) yielded a 2.2-kb product from genomic DNA and a 0.6-kb product from cDNA. For the Opn1sw −/− mice, these primers yielded a 0.9-kb product from genomic DNA, and a 0.2-kb product is expected from the modified locus if it is transcribed. As a negative control, reactions without the addition of RT enzyme were carried out, and in this condition, only a product from genomic DNA is expected. As a second positive control, primers to mouse rhodopsin cDNA (primer pair 5, Table 1) were used in RT-PCR using RNA from the retinas of Opn1sw −/− and Opn1sw +/+ mice. The forward primer spanned the exon 1/2 splice junction so that only cDNA is amplified, and the reverse primer corresponded to sequences in exon 2. Because both the Opn1sw −/− and Opn1sw +/+ mice have intact rhodopsin genes, a PCR product of 0.15 kb is expected with these primers.
PCR primers sequences and locations and thermal cycling parameters for genotyping and quantitative PCR analysis of cone opsin genes. Upper case letters correspond to exons, lower case letters correspond to introns. Minutes and seconds are abbreviated min and s, respectively.

Genotyping
DNA was isolated from each mouse and PCR performed to determine the genotype for both the S-opsin and M-opsin gene loci. All PCRs were performed on an ABI Model 2700 (Applied Biosystems, Foster City, CA) or Veriti Thermal Cycler. For the Opn1sw locus, primer pair 1 (Table 1) was used with the iTaq kit (Biorad, Hercules, CA). Reaction volumes were 10 µl with a final concentration of 20 nM each for the forward and reverse primers, 100 nM for each of the dNTPs (dATP, dGTP, dTTP, and dCTP), and 2 mM (mM) MgCl2. A 0.9-kb PCR product was expected from the knockout locus, and a 2.2-kb product was expected from the intact locus. Both products were expected from heterozygous animals; however, the 2.2-kb product was not reliably detected in heterozygotes, presumably because the shorter product was preferentially made. An additional PCR assay with primer pair 2 (Table 1, lower case letters correspond to intron sequences and upper case letters correspond to exon sequences) was used to reliably distinguish between Opn1sw +/− versus Opn1sw −/− mice. For all mice in which a 0.9 kb PCR product was observed from PCRs with primer pair 1, PCR was done with primer pair 2 using the ABI AmpliTaq Gold kit with reaction volumes of 10 µl and a final concentration of 300 nM for each primer, 100 nM for each of the dNTPs, and 2 mM for MgCl2. PCR products were subjected to agarose gel electrophoresis. PCR assays performed using primer pair 2 do not give a product in Opn1sw −/− mice because both primers correspond to the deleted region. However, for heterozygotes, the intron 2/exon 3 primer pair gives a 0.2-kb PCR product.
PCR was used to determine whether the opsin gene present on the X-chromosome(s) of the mice was the endogenous Opn1mw or Opn1lw LIAIS gene using primer pairs 3 and 4 (Table 1). The primer pair designed to amplify the Opn1mw gene used a forward primer that crossed the intron 2/exon 3 boundary and a reverse primer that crossed the exon 3/intron 3 boundary. Primer pair 4 was designed to amplify the Opn1lw LIAIS gene. These primer sets were used with the AmpliTaq Gold kit (ABI) at a concentration of 300 nM each. The dNTP concentrations were each 100 nM. PCR products were analyzed by agarose gel electrophoresis. The 196-bp Opn1mw PCR product was only observed in mice with that gene intact and not in mice with only Opn1lw LIAIS gene. Likewise, the 169 bp Opn1lw LIAIS PCR product was observed in the knock-in mice but not in mice with only the wild-type locus. Together, these PCR reactions detected heterozygous animals that arose in intermediate generations in the breeding scheme used to generate the double mutant mice Opn1lw LIAIS/LIAIS/Opn1sw −/− (females) and Opn1lw LIAIS/Y/Opn1sw −/− (males).
Both genetically modified loci were sequenced in all breeders and genotyped in all experimental animals. An example of the genotyping assay for the Opn1sw −/−, Opn1sw +/− , and Opn1sw +/+ animals is shown in Fig. 2. A 2.2-kb PCR product is obtained from the wild-type Opn1sw locus when primer pair 1 (Table 1) is used, whereas a 0.9-kb band is obtained from the knockout (Fig. 2A). Heterozygotes were expected to yield both bands but as shown in Fig. 2A, the assay reliably detects homozygotes but not heterozygotes. Specifically, the 2.2-kb band from the intact locus was not always detected. Thus, for all mice in which the knockout locus was detected, DNA was used in a second reaction with primer pair 2 (Table 1, Fig. 2B). The forward primer corresponds to intronic sequences which are only present in the intact Opn1sw locus. If transcribed, the Opn1sw −/− locus would have exon 1 spliced to exon 5 which would produce a frame shift starting at codon 116 and introduce a transcriptional termination signal at codon 134. The mRNA is expected to be 0.2 kb.
PCR and RT-PCR genotyping assays to confirm Opn1sw gene knockout. (A) A 1.5% agarose gel showing results obtained from DNA isolated from Opn1sw +/+, Opn1sw −/−, and Opn1sw +/− mice, as indicated by labels above each lane. MW is the molecular weight marker. A 2.2-kb fragment is obtained from the wild-type locus from PCR using primers to exons 1 and 5, a 0.9-kb fragment is obtained from the knockout mouse, and both the 2.2- and 0.9-kb bands are expected from the heterozygous animals, although the 2.2-kb band often is not detectable due to preferential amplification of the smaller product. (B) PCR products from amplification with primers to intron 2 and exon 3 to distinguish between Opn1sw −/− and Opn1sw +/− mice, as labeled above the lanes. A 0.2-kb band is observed in heterozygous animals, but no band is observed in S-opsin knockout mice because intron 2 and exon 3 have been deleted. (C) As described in the methods, RT-PCR using rhodopsin cDNA primers on RNA isolated from retinas of Opn1sw +/+ and Opn1sw −/− mice were used as positive controls to demonstrate that RNA could be isolated and amplified from both experimental and control mouse retinas. The expected 0.15-kb band can be clearly seen for both mouse lines. (D) RT-PCR using cDNA primers on isolated RNA from Opn1sw +/+ and Opn1sw −/− mice (as labeled) were used. The lanes without RT (labeled RT−) show just one band each, amplifying only genomic DNA, yielding 2.2- and 0.9-kb products for Opn1sw +/+ and Opn1sw −/− retinas, respectively (as described in Materials and methods). The Opn1sw +/+ reaction with RT (labeled RT+) has the capacity to amplify both the smaller RNA and the genomic DNA, yet due to preferential amplification of the smaller and more numerous RNA, only the smaller 0.6-kb band is visible. Unlike the Opn1sw +/+ RT-PCR, the Opn1sw −/− lane with RT+ has two bands: One bright band of amplified genomic DNA and a much fainter band (arrowhead) at the 0.2-kb mark. This indicates that RNA for the truncated gene is produced but appears to be present in very low quantities. Most likely, the truncated mRNA is being degraded before it can be translated; however, at least a small amount of transcription is occurring.

Retinal mRNA from Opn1sw −/− and Opn1sw +/+ mice was isolated and used in RT-PCR to determine whether the knockout locus was transcribed at a detectable level. As a positive control, we showed that rhodopsin mRNA is readily detectable using the same RT reactions with a forward primer that corresponded to the exon 1/exon 2 junction of the mouse rhodopsin gene (Fig. 2C). The mRNA extracts were not treated with DNase I, and the PCR primer pair 1 (Table 1) can amplify either Opn1sw genomic DNA or complementary DNA (cDNA). For animals with the intact Opn1sw locus, a band of the size expected from the cDNA was observed when the RT enzyme was added, and only a band of the size expected from genomic DNA was observed in the absence of the RT enzyme (Fig. 2D). In contrast, for animals with the knockout locus, a band of the size expected from genomic DNA was observed both in the presence and absence of the RT enzyme; however, in the presence of the RT enzyme, a very faint band of the size expected for cDNA derived from the knockout locus was observed (Fig. 2D).
Quantification of M-opsin transcription
Mice were euthanized and eyes were marked with permanent ink to mark the cornea/sclera to label orientation prior to enucleation. Eyes were placed on a pad of sterile paper tissues soaked in RNase-free phosphate buffered saline (PBS). Under a stereomicroscope, the temporal-nasal meridian was marked. A very small puncture hole was made in the cornea with a needle, and the eye was immediately submerged in a dish of ice-cold, RNase-free PBS. The cornea and lens were removed, and the eye was cut along the temporal-nasal meridian. The ventral hemi-retina was teased from the retinal pigmented epithelium (RPE) and immediately placed in RNALater (Ambion, Austin, TX). Ventral retinas of both eyes were combined for each animal. The mRNA was extracted and DNA removed by treating with DNase I. Synthesis of cDNA was completed with a kit according the manufacturers recommendations (Invitrogen, Carlsbad, CA), and an aliquot of the product was diluted to ∼12.5 ng/µl for real time PCR. Each sample was amplified in quadruplicate according to the standard protocol provided by Applied Biosystems for their custom designed Taqman assay for mouse M-opsin cDNA (Applied Biosystems, Foster City, CA; Mm01193546_m1) and mouse beta-actin cDNA (Applied Biosystems; Mm00607939_s1). M-opsin cDNA quantitation was normalized to beta-actin cDNA.
Immunohistochemistry
Mice were euthanized with a lethal dose of sodium pentobarbital and tissues fixed via cardiac perfusion first with 0.13-M phosphate buffered saline (PBS) pH 7.2–7.4 containing 2 units of heparin per milliliter, followed by 4% paraformaldehyde (PFA) in PBS, followed by 4% paraformaldehyde plus 1% glutaraldehyde in PBS. Glutaraldehyde served to keep the neural retina attached to the RPE so that the cone outer segments would remain intact. Each solution was warmed to ∼37°C just prior to administration and ∼35 to 40 ml of perfusate was delivered at each stage. Once the perfusion was stopped, the mouse was wrapped in a moist paper towel and left to further fix for 2–3 h before enucleation and dissection.
Permanent ink was used to mark the orientation of the eye, the anterior segment was removed, and the eye-cup was fixed in 4% PFA overnight at 4°C and then stored in PBS at 4°C. Retinal whole-mounts were made by flattening the dissected retina between tissues soaked in 4% PFA for 2 h and then transferring them to a culture plate for six more hours of fixation. Afterward, the PFA was replaced with PBS containing 0.03% sodium azide (Sigma, St. Louis, MO).
For sections, eyecups were drained of PBS, imbedded in low gelling temperature agarose (Type XI, Sigma, 8% in PBS). A small agar block surrounding the eyecup was cut out with a razor blade and oriented. The specimen block was mounted to the sectioning plate with cyanoacrylic adhesive. To help keep the RPE from separating from the retina and breaking the cone outer segments, the vibratome sections were kept relatively thick (100 µm). Sagittal slices containing both dorsal and ventral retina were produced. Sections from within 100 µm of the optic nerve head were transferred to a culture plate containing PBS with 0.03% sodium azide.
Antibody labeling was carried out on a rotating table shaker. Sections were incubated with 1% sodium borohydride in PBS for 30 min at room temperature to quench glutaraldehyde autofluorescence and then washed thoroughly in PBS. To block nonspecific labeling, whole mounts or sections were incubated overnight at 4°C with a solution containing 5% donkey serum (Jackson ImmunoResearch; Cat # 004-000-120), 1 mg/ml BSA (Jackson ImmunoResearch, West Grove, PA; Cat # 001-000-161), and 0.03% Triton X-100 in PBS (pH 7.4). The primary antibodies used in this study were rabbit anti red-green (L/M) opsin diluted 1:200 (Millipore, Billeria, CA; Cat # AB5405) and goat anti-S-opsin (Santa Cruz Biotechnology, Santa Cruz, CA; Cat # sc-14365) diluted 1:100. Note that there are no antibodies that distinguish between L and M opsins. Primary antibodies plus rhodamine-labeled peanut agglutinin (PNA, 5 µg/ml; Vector Labs, Burlingame, CA; Cat # RL-1072) were incubated at 4°C for at least 3 days for sections and 2 days for whole mount tissue. Specimens were washed in PBS 3 times for 30 min each, then incubated at 4°C overnight with DAPI (4′,6-diamidino-2-phenylindole,dihydrochloride 1:10,000; Invitrogen, Carlsbad, CA; Cat # D-21490) plus secondary antibodies. The secondary antibody for the L/M-opsin antibody was Alexa Fluor 488 labeled donkey anti-rabbit IgG(H + L) diluted 1:200 in antibody dilution buffer (Invitrogen; Cat # A21206) and that for the S-opsin antibody was Alexa Fluor 633 labeled donkey anti-goat IgG(H + L) diluted 1:200 (Invitrogen; Cat # A21082). This was followed by three 30-min PBS washes, 30 min of postfixation with 4% paraformaldehyde, and three more 30-min PBS washes. Finally, the retinal slices were placed on slides with 2% DABCO in glycerol and covered with cover slips.
Microscopy
Widefield images were acquired using a Nikon Eclipse E1000 (Tokyo, Japan) with a 20× (open-air) objective and camera set with a 1.5× optical zoom. For each specimen, 50 optical sections were taken 0.5-µm apart and the M-opsin Z-stack was reconstructed in ImageJ. The Z-stack was oriented so that the lengths of the outer segments were in plane, and the distance between where antibody staining began and ended was measured as an estimate of the length of the outer segments. Further, a 3D projection of the Z-stack was generated and the number of cones with visible M-opsin in the outer segment could be quantified.
Confocal image slices were acquired using an Olympus FluoViewTM FV1000 (Tokyo, Japan). Sections were imaged using a 20× oil immersion lens (40 images taken 0.5-µm apart) and the Z-stacks were reconstructed in ImageJ. Channel exposure levels were balanced within and across images using Adobe Photoshop. For the retinal whole mounts, images were taken using a 10× open-air lens and mosaics were constructed with Adobe Photoshop’s native mosaic construction software.
Electroretinogram
Mice were anesthetized with an intraperitoneal injection of ketamine (110.25 mg/kg) and xylazine (11.025 mg/kg) diluted in sterile saline. The eye was dilated by topical application of 1.0% atropine sulfate. Each animal was positioned on a water-heated laminate platform with the head stabilized via a bite bar. The active lead was a custom, platinum-coated wire-ring electrode placed parallel to the surface of one eye, encircling the perimeter of the cornea and making a flat connection. The reference lead was a custom platinum-coated wire electrode bent to match the curvature of the back of the eye, which was inserted between the bottom eyelid and sclera where it was proximal to the optic nerve.
Flicker photometric electroretinograms (ERGs) for determining the spectral sensitivity of the human L photopigment (LIAIS) in mice were performed using methods described elsewhere (Jacobs et al., Reference Jacobs, Neitz and Deegan1991; Jacobs et al., Reference Jacobs, Deegan and Moran1996).
For long-flash (On-Off) ERGs, a Roland Consult (Brandenburg, Germany) Q400 Ganzfeld ERG system was modified to hold 26 ultraviolet (UV) LEDs (Nichia NSHU591B, 365 nm peak; Tokushima, Japan) and 26 green LEDs (Nichia NSP6510S LEDs, 520-nm peak). Custom circuitry controlled the intensities of the LEDs with pulse width modulation, providing a linear intensity response with no shift in peak wavelength. The same circuitry was also used to synchronize the light stimulus with the Roland Consult Retiport software. Each LED was independently adjustable, allowing S or M cone photopigment specific stimuli to be generated via the method of silent substitution. The light stimulus was flashed at 1 Hz with a 50% duty cycle. During the first 500 ms of each cycle (Phase 1), quantal catch was high for the specific photopigment isolating stimulus (S or M), whereas in the final 500 ms (Phase 2), the quantal catch was low for the specific photopigment isolating stimulus. Specifically, a 520-nm light was used to isolate the M-opsin response, and a 365-nm light was alternated with a 520-nm light in a silent substitution paradigm to isolate the S-opsin response. All ERGs were performed in the photopic light range with background lights adjusted to suppress rod activity. Data were reported as the averages of 20 ERG records, and the size of the ERG corresponds to the b-wave amplitude, which is measured as the absolute voltage change from the a-wave trough to the b-wave peak. The b-wave is generated by the depolarization of ON-bipolar cells (Bush & Sieving, Reference Bush and Sieving1996) and therefore can be used as an indirect indicator of the photoreceptor response.
Results
We created a line of genetically engineered mice in which the mouse Opn1mw gene was replaced with a recombinant gene that encoded an L-opsin with the N-terminal 32 amino acids specified by exon 1 of the endogenous mouse gene, and the remaining amino acids specified by codons 66 through 364 of a human L-opsin cDNA. The advantage of this knock-in locus design is that it allows gene expression to be controlled by the endogenous mouse regulatory DNA sequences upstream of the locus. The main disadvantage is the potential for the structure of the modified locus to interfere with the normal expression pattern of the gene or for the exon 1 encoded amino acid differences between mouse and human (shown in Fig. 3) to interfere with the normal function of the photopigment or cones. Results shown in Fig. 4 illustrate that the expression pattern of the recombinant L-opsin gene is indistinguishable from that reported for C56BL/6 mice (Applebury et al., Reference Applebury, Antoch, Baxter, Chun, Kalk, Farhangfar, Kage, Krzystolik, Lyass and Robbins2000; Haverkamp et al., Reference Haverkamp, Wassle, Duebel, Kuner, Augustine, Feng and Euler2005). Fig. 4 shows a whole-mounted retina from a 15-month-old mouse with a targeted replacement of the Opn1mw gene and an intact Opn1sw gene that was immunolabeled with antibodies to L/M- and S-opsin. The expression pattern shows that the majority of cones are labeled both with the L/M- and S-opsin antibodies, and they showed a dorsal-to-ventral gradient of increasing coexpression.
Alignment of human and mouse exon 1. Residues that differ between mouse and human are underlined and bolded. The human sequence is five amino acids longer than mouse due to the absence of residues corresponding to human amino acid residues 4–8 in mouse. The single letter amino acid code is used and is as follows: A = alanine, R = arginine, N = asparagine, D = aspartic acid, C = cysteine, E = glutamic acid, Q = glutamine, G = glycine, H= histidine, I = isoleucine, L = leucine, K = lysine, M = methionine, F = phenylalanine, P = proline, S = serine, T = threonine, W = tryptophan, Y = tyrosine, and V = valine.

The mouse/human hybrid X-chromosome cone opsin gene shows a gradient of expression that is indistinguishable from what has been reported for C57Bl/6 mice. Confocal images spanning the dorsal–ventral meridian of the retina were acquired (arrowhead indicates the location of the optic nerve head). M-opsin labeling (left panel, red label) is strong in both the dorsal and ventral retina, whereas S-opsin labeling (middle panel, green label) is sparse in the dorsal retina and strong in the ventral retina. The merged image (right panel) shows that although majority of cones coexpress both M and S-opsin, the cones in the far dorsal retina overwhelmingly express M-opsin; colocalized labeling appears yellow or orange, depending on the relative quantities of each opsin present. In the right panel, the scale bar represents 250 µm. Insets from the dorsal and ventral retina are enlarged ∼5×, and the scale bar represents 100 µm. The retina shown here is from a mouse with Opn1lw LIAVA; however, Opn1lw LIAIS also gave the same pattern of expression.

Function of the targeted replacement locus was examined in Opn1lw LIAIS /Opn1sw +/+ mice using the flicker photometric ERG (Jacobs et al., Reference Jacobs, Neitz and Deegan1991) to measure the action spectrum of cones containing the LIAIS photopigment. Responses to nineteen light stimuli, ranging from 480 to 660 nm, fit a human photopigment template curve (Carroll et al., Reference Carroll, McMahon, Neitz and Neitz2000) and had a λ-max of 561 nm (Fig. 5). The peak sensitivity of the LIAIS cone in the engineered mouse is similar to that which has been measured in humans by flicker photometric ERG (Jacobs et al., Reference Jacobs, Deegan and Moran1996; Carroll et al., Reference Carroll, Neitz and Neitz2002), and it is red-shifted in comparison to wild-type mice that have M cones maximally sensitive at 511 nm (Jacobs et al., Reference Jacobs, Neitz and Deegan1991).
Action spectrum of the knock-in/knockout L-cone. The flicker photometric ERG was used to measure the action spectrum of LIAIS cones in an Opn1lw LIAIS mouse using light stimuli spanning 480–660 nm. The data (black circles) were fit (solid gray trace) using a photopigment template. The peak spectral sensitivity was consistent with that of the human L cone and red-shifted in comparison to the action spectrum of the endogenous mouse M cone (dashed gray trace).

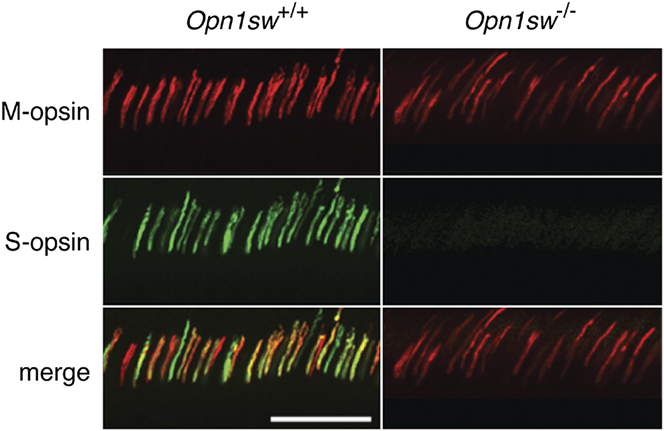
Vibratome sections from Opn1lw LIAIS/Opn1sw +/+ and Opn1lw LIAIS/Opn1sw −/− mice were immunolabeled with antibodies to L/M- and S-opsin to verify the absence of S opsin labeling. In the ventral retinas shown in Fig. 6, the Opn1lw LIAIS/Opn1sw +/+ mouse showed strong immunolabeling with the antibody to S-opsin, whereas this signal was absent in the Opn1lw LIAIS/Opn1sw −/− mice, as expected if the S-opsin gene was successfully knocked out. This result is consistent with the absence of S cone function, described below.
Immunohistochemistry using antibodies against L/M- and S-opsins. Images acquired from the ventral retinas of an Opn1lw LIAIS/Opn1sw +/+ mouse (left column) and an Opn1lw LIAIS Opn1sw −/− mouse (right column) incubated with antibodies against both L/M-opsin (red) and S-opsin (green). L/M-opsin is labeled in both lines of mice (top row), whereas S-opsin labeling is only observed in the Opn1sw +/+ mouse (middle row). Double labeling is evident (yellow cones) in the merged image for the Opn1sw +/+ mouse but not in the Opn1sw −/− mouse (bottom row). Scale bar represents 50 µm.

Absence of S-opsin changes the M-opsin mediated light response
On-Off ERGs were performed with three-month-old Opn1mw/Opn1sw +/+ mice (n = 10) and age-matched Opn1mw/Opn1sw −/− mice (n = 9) using a light to specifically stimulate the S cone photopigment. The S-photopigment response was absent in Opn1mw/Opn1sw −/− mice (Fig. 7), consistent with there being no functional S-opsin. In contrast, a robust response to the same stimulus was observed in Opn1mw/Opn1sw +/+ mice. Both the Opn1mw/Opn1sw +/+ and Opn1mw/Opn1sw −/− mice generated strong ERGs in response to the M-photopigment isolating stimulus (Fig. 8). Together, these results validated the S-isolating stimulus condition and confirmed the absence of functional S-opsin in the Opn1mw/Opn1sw −/− mice.
S-opsin responses from Opn1sw +/+ and Opn1sw −/− mice. The Opn1mw Opn1sw +/+ mice (n = 10) exhibit a robust response (black trace) to the S cone pigment-isolating stimulus, whereas this response is entirely absent in the Opn1mw Opn1sw −/− mice (n = 9; gray trace). The bar at the top of the figure represents the timing of the On-Off light stimulus. For the S-isolating condition, the 365-nm LED was on exclusively during Phase 1, and a 520-nm light was on during Phase 2 to counterbalance any response resulting from the absorption of short wavelength light by the M-photopigment. Error bars represent the s.e.m.

The absence of the S-photopigment alters the temporal profile of mouse M-isolated ERG. Aggregate ERG waveforms from the same 3-month-old Opn1mw/Opn1sw +/+ (n = 9, black trace) and Opn1mw/Opn1sw −/− (n = 10, gray trace) mice that were used for ERGs shown in Fig. 7. All responses have been normalized by b-wave amplitude so that the temporal signatures can be directly compared. Error bars represent the s.e.m. Because the amplitude of the b-wave varies across animals and the voltage does not necessarily return to zero prior to the start of the OFF-phase of the stimulus, the “On-decay time” was calculated as the time required for the maximum ON-response signal to decay by 80% (denoted by arrowheads).

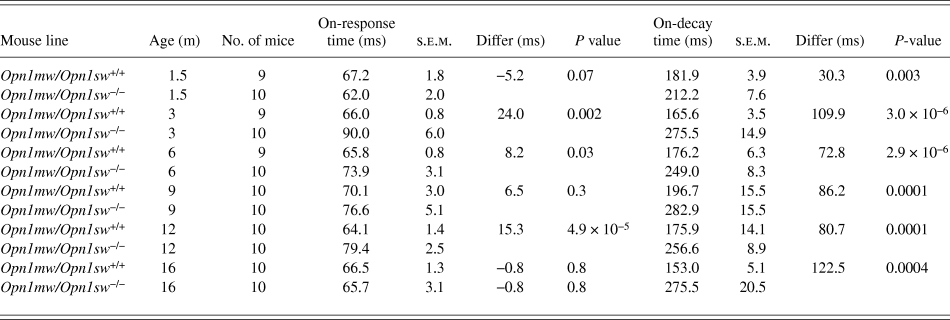
The ERG waveforms produced in response to the M-photopigment-isolating stimulus by the Opn1mw/Opn1sw +/+ and the Opn1mw/Opn1sw −/− mice have consistently distinct temporal profiles. Within the On-phase of the response, the b-wave peaked sooner and was faster to return to baseline for Opn1mw/Opn1sw +/+ mice, as compared to Opn1mw/Opn1sw −/− mice (Table 2). Because the amplitude of the b-wave varied across animals and because the voltage did not necessarily return to baseline prior to the start of the Off-phase of the stimulus, the On-response decay time was calculated as the time required for the maximum On-response signal to diminish by 80%. Fig. 8 shows aggregate ERG waveforms from 3-month-old Opn1mw/Opn1sw +/+ (n = 9, black trace) and Opn1mw/Opn1sw −/− (n = 10, gray trace) mice. The presence of S-opsin in dually expressing cones, without any S cone pigment stimulation, affects the amplitude of the M response. For both Opn1mw/Opn1sw +/+ and Opn1mw/Opn1sw −/− mice, responses to a series (0.2 to 11.8 µW/mm2) of M-opsin isolating lights increased logarithmically with intensity (Fig. 9); however, the slope of the function is shifted in the S-opsin knockout mice (n = 10 per line). Compared to Opn1mw/Opn1sw +/+ mice, the Opn1mw/Opn1sw −/− mice show higher sensitivity at lower light levels, but there is little difference at the highest light levels that produce near maximal responses.
On-response timing profiles of wild-type and Opn1mw/Opn1sw−/− mice in response to 520-nm light. On-response time: latency for the voltage to maximally increase (b-wave) following the downward deflection at light-onset (a-wave) was measured. On-decay time: amount of time necessary for the b-wave to decay by 80%. Differ: difference between the On-response time and On-decay time

The intensity response function for M-pigment stimuli has a steeper slope for wild-type mice than S-opsin knockout mice. Responses to an M-isolating (520 nm light) intensity response series (0.2 to 11.8 µW/mm2) for the same 3-month-old Opn1mw/Opn1sw +/+ (black symbols, n = 10) and Opn1mw/Opn1sw −/− (gray symbols, n = 10) mice used for experiments in Figs. 7 and 8. Light intensity values are shown on a log scale. Error bars represent the s.e.m. The dashed lines are best linear fits to the data.

ERGs generated in response to two intensities (3.0 and 11.8 µW/mm2) of the M-pigment isolating stimulus were collected from the same Opn1mw/Opn1sw +/+ and Opn1mw/Opn1sw −/− mice, longitudinally, across the first 16 months of life. M-opsin-mediated ERG response amplitudes to brighter lights decreased substantially with age in the Opn1mw/Opn1sw −/− line, whereas the responses remained more stable over time in the Opn1mw/Opn1sw +/+ line (Fig. 10A). The age-dependent decrease in ERG b-wave amplitude in the Opn1mw/Opn1sw +/+ mice was consistent with previous reports (Gresh et al., Reference Gresh, Goletz, Crouch and Rohrer2003; Williams & Jacobs, Reference Williams and Jacobs2007). Interestingly, even though there was a dramatic decrease in M-opsin-mediated ERG amplitudes with age for the S-opsin knockout mice, the ERG amplitudes were initially increased above those of the wildtype mice at the earliest time points in response to the lower intensity (3.0 µW/mm2) stimulus.
Longitudinal study of L/M-pigment-mediated ERGs responses in the presence and absence of S opsin. M-photopigment-isolated ERGs were collected from (A) Opn1mw/Opn1sw +/+ (filled black symbols), Opn1mw/Opn1sw −/− (filled gray symbols), (B) Opn1lw LIAIS/Opn1sw +/+ (open black symbols), and Opn1lw LIAIS/Opn1sw −/− (open gray symbols) mice across 16 months using a 520-nm light at intensities of 3.0 µW/mm2 (left panels) and 11.8 µW/mm2 (right panels). Error bars represent the s.e.m. and data are fit using logarithmic functions (dashed traces). For most data points, n = 10; however, in the remaining instances, the sample size was reduced (as low as n = 7 in one case) due to natural mortality or technical issues. Color-coded arrowheads in panel B denote where data from the corresponding set in panel A would be if superimposed.

Strikingly, there was less of an age-dependent decrease in L/M-pigment-mediated ERG b-wave amplitudes in S-opsin knockout mice with Opn1 LIAIS than in S-opsin knockout mice with Opn1mw. The ERG amplitudes and slopes of the fitting functions were similar between the Opn1lw LIAIS/Opn1sw +/+ mice and the Opn1mw/Opn1sw −/− mice at both stimulus intensities. In Fig. 10B, the slopes of the regressions fitting the Opn1lw LIAIS/Opn1sw −/− data for each intensity were quite similar to those of the Opn1lw LIAIS/Opn1sw +/+ mice. At the higher stimulus intensity, the Opn1lw LIAIS/Opn1sw −/− mice did not have as robust a response as Opn1lw LIAIS/Opn1sw +/+. However, at the lower stimulus intensity, the response amplitudes of the Opn1lw LIAIS/Opn1sw −/− and Opn1lw LIAIS/Opn1sw +/+ lines were not statistically different at any time-point, except 16 months.
M-opsin mRNA in Opn1mw/Opn1sw+/+ versus Opn1mw/Opn1sw−/− cones
Previous studies of wild-type C57BL6 mice showed that although there was a decrease in M-pigment-mediated cone function with age, there was not an age-dependent decrease in M-opsin mRNA or protein (Gresh et al., Reference Gresh, Goletz, Crouch and Rohrer2003; Williams & Jacobs, Reference Williams and Jacobs2007). Furthermore, mice up to 8 months of age with a severely hypomorphic allele of S opsin had no change in M opsin mRNA, but there was an increase in M opsin protein (Daniele et al., Reference Daniele, Insinna, Chance, Wang, Nikonov and Pugh2011). Here, we used real-time quantitative RT-PCR to measure M-opsin mRNA and beta-actin mRNA in retinas from 12-month-old Opn1mw/Opn1sw +/+ mice and age-matched Opn1mw/Opn1sw −/− knockout mice. RNA was extracted from ventral hemi-retinas because this was where S-opsin expression would have been most abundant under normal conditions (Applebury et al., Reference Applebury, Antoch, Baxter, Chun, Kalk, Farhangfar, Kage, Krzystolik, Lyass and Robbins2000; Haverkamp et al., Reference Haverkamp, Wassle, Duebel, Kuner, Augustine, Feng and Euler2005). At this age, the amount of M-opsin mRNA was 44% lower (P value = 0.001) in the Opn1sw −/− mice (Fig. 11).
Quantitation of M-opsin in Opn1mw/Opn1sw +/+ versus Opn1mw/Opn1sw −/− mice by qPCR. At an age of 12 months, the retina of the Opn1mw/Opn1sw −/− mouse (n = 4) had 44% less M-opsin mRNA than the wild-type mouse (n = 4). Error bars represent the s.e.m.

Absence of S opsin leads to outer segment retraction
Wide-field images of immunolabeled dorsal-to-ventral sections were acquired from 16-month-old mice from each of the four lines (n = 5 per line, except n = 3 for the Opn1mw/Opn1sw +/+ line). Representative confocal images were taken for each mouse line at the dorsal and ventral retina (Fig. 12). There is a clear reduction in L/M opsin staining in the Opn1sw −/− mice compared to the corresponding Opn1sw +/+ mice both in dorsal and ventral retina, but it appears most dramatic in ventral retina, demonstrating a greatly reduced amount of M/L-opsin protein in the S-opsin knockout mice compared to mice with S opsin.
Opn1sw gene knockout results in morphological changes. Confocal image sections acquired at the far dorsal (left column) and far ventral (right column) retina for each mouse line. 19.5 µm deep z-stacks (0.5 µm spacing) were acquired with a 20× oil-immersion objective. M-opsin (red), cone sheaths (green/PNA), and nucleic acid (blue/DAPI) are labeled. Images show that M-opsin staining is abnormally low in the ventral retina of both Opn1sw −/− lines, but the effect is most dramatic in the Opn1mw/Opn1sw −/− mouse, where there is no M opsin labeling in the field shown. Scale bar represents 100 µm.

Individual outer segment lengths were measured in a 5.7-mm2 field, and the visible cone outer segments in a 2.8-mm2 subfield were counted. These measurements and counts were carried out across the 3-dimensional volume of the Z-stacks using cone opsin labeling as the criteria for identifying cone outer segments. The unpaired t-test was used to determine whether differences observed between mouse lines were statistically significant. All analyses were performed with the S-opsin channel turned off to avoid inflating the results from the two Opn1sw +/+ mouse lines.
The number of cone outer segments in dorsal retina did not differ significantly across any of the lines of mice (Fig. 13A). However, the number of cone outer segments in ventral retina was significantly reduced for both lines of Opn1sw −/− mice compared to the corresponding lines of Opn1sw +/+ mice; Opn1mw/Opn1sw −/− mice had 97% (P = 3.2 × 10⁻⁷) fewer cone outer segments compared to Opn1mw/Opn1sw +/+ mice, and Opn1lw LIAIS/Opn1sw −/− mice had 59% fewer cone outer segments compared to Opn1lw LIAIS/Opn1sw +/+ mice (P < 0.005). Although there was no difference in the number of outer segments in ventral retina for wild-type versus Opn1lw LIAIS/Opn1sw +/+ mice, there was a significant difference in the number of cone outer segments that could be visualized in the corresponding S-opsin knockout mice; there were 14 times more cones with outer segments that were visibly stained in the ventral retina from Opn1lw LIAIS/Opn1sw −/− mice compared to Opn1mw/Opn1sw −/− mice (Fig. 13A).
Outer segment length measurements and cone counts in 16-month-old mice. Immunolabeled sections from 16-month-old wild-type (n = 5, black bars), Opn1mw/Opn1sw −/− (n = 5, gray bars), Opn1lw LIAIS/Opn1sw +/+ (n = 3, textured black bars), and Opn1lw LIAIS/Opn1sw −/− (n = 5, textured gray bars) mice were imaged by wide-field microscopy. (A) The number of cone outer segments with M/L-opsin labeling was counted in 2.8-mm2 regions of the dorsal and ventral retina. (B) The lengths of the outer segments of cones remaining in 5.7-mm2 regions within the dorsal and ventral retina were measured, and the average is reported for each line. Error bars represent the s.e.m.

Measurements of the outer segments were averaged for each line of mice (Fig. 13B). In dorsal retina, there was no statistically significant difference in outer segment length among the different lines; however, there was a trend for the Opn1mw/Opn1sw −/− mice to have shorter outer segments than the Opn1mw/Opn1sw +/+ mice (−15%, P = 0.09). In the ventral retina, the outer segments in the Opn1mw/Opn1sw −/− mouse were 4.2× shorter than in the Opn1mw/Opn1sw +/+ mice (P = 6.7 × 10⁻⁵) and 3.5× shorter than in the Opn1lw LIAIS/Opn1sw −/− mice (P < 0.002). Measurements in the ventral retina also showed that outer segments tended to be shorter in Opn1lw LIAIS /Opn1sw −/− mice than in Opn1lw LIAIS/Opn1sw +/+ mice (−16%, P = 0.075).
Discussion
The majority of cones in the wild-type mouse express both S- and M-opsin. One goal of the experiments described here was to create an S-opsin knockout mouse to be used for studying deleterious variants of human L- and M-opsin in isolation. The S-opsin knockout mouse we constructed has no detectible response to lights that only modulate quantal catches in S photopigment. There was also no S-opsin detected at the protein level, and the fact that only a very faint band was observed in RT-PCR from the Opn1sw −/− locus (Fig. 2D) makes it most likely that any mRNA produced by remnants of the S-opsin gene is highly unstable and decays rapidly. Thus, the construction of the S-opsin knockout mouse was successful.
Characterization of this S-opsin knockout illuminated important consequences of a decrease in opsin expression for cone structure and viability. Earlier, Daniele et al. (Reference Daniele, Insinna, Chance, Wang, Nikonov and Pugh2011) created a severely hypomorphic S-opsin allele by targeted integration of a neomycin resistance gene within the Opn1sw gene, whereby the transcription of the neomycin resistance gene presumably completely disrupted transcription of the S-opsin gene. Daniele and colleagues pooled data from mice aged 1.5–8 months with the hypomorphic S-opsin allele and noted that there was no increase in the rate of M opsin transcription, but there was an ∼1.6 fold increase in the M opsin protein that correlated with increased sensitivity measured in the full field ERG. An increase in M-opsin in the absence of S opsin could be consistent with the ERG results reported here for mice younger than 6 months (Fig. 10A); however, for mice over 8 months, the M-opsin mediated ERG amplitudes were lower in the absence of S-opsin compared to ERGs measured in the presence of S opsin, which is consistent with a decrease in M-opsin protein. A reduced level of M-opsin protein in the absence versus in the presence of S opsin was observed by immunolabeling and was particularly pronounced in ventral cones (Fig. 12). In addition, quantitative real-time RT PCR using 12-month-old mice indicates that M-opsin mRNA levels are significantly lower in the Opn1sw −/− mice compared to Opn1sw +/+ mice (Fig. 11). Thus, for mice over 8 months of age, M-photopigment function, M-opsin protein, and M-opsin mRNA are all reduced in the S-opsin knockout mice compared to mice with an intact S-opsin gene.
In immunolabeling experiments, cones with no detectable opsin (M or S) labeling were observed. We cannot determine whether apparently “empty” cones are indeed empty or whether they contain an undetectably small amount of M-opsin, and likewise, it is unclear whether the “true blue” cones (Applebury et al., Reference Applebury, Antoch, Baxter, Chun, Kalk, Farhangfar, Kage, Krzystolik, Lyass and Robbins2000; Haverkamp et al., Reference Haverkamp, Wassle, Duebel, Kuner, Augustine, Feng and Euler2005) that must be empty have degenerated. Nonetheless, taken together, the results clearly demonstrate that in mice over 12 months of age, the absence of S-opsin is accompanied by a reduction in M-opsin mRNA and M-opsin protein in ventral retina where most cones in the wild-type mice would normally express both S- and M-opsin.
Only a small fraction of the opsin expressed in most ventral cones is M-opsin. It is possible that, in young mice, the absence of competition with S-opsin transcripts for translational machinery allows for an increase in M-opsin production, as suggested by Daniele et al., and this could explain the initial increase in the M-photopigment-mediated ERG b-wave amplitudes we observed in the Opn1mw/Opn1sw −/− mice. However, if the normal amount of M-opsin in the ventral cones is only about 5–20% of the total and increased translation doubled that amount, most of these cones in the S-opsin knockout mouse would still have less than half the normal amount of opsin. The opsin protein is known to be an important structural component of the photoreceptor outer segment (Wald et al., Reference Wald, Brown and Gibbons1963; Papermaster & Dreyer, Reference Papermaster and Dreyer1974; Fliesler & Basinger, Reference Fliesler and Basinger1985), and those with insufficient opsin may be unstable and degenerate (Lem et al., Reference Lem, Krasnoperova, Calvert, Kosaras, Cameron, Nicolo, Makino and Sidman1999). Nevertheless, even in mice at 16 months of age, the PNA-labeled cone sheath appears to be intact, despite the absence of S-opsin and an undetectable amount of M opsin. One implication is that in some human vision disorders involving dysfunction of the opsin, the cones may remain viable and amenable to gene therapy.
In the absence of S-opsin, the engineered L-opsin appears to be more stable than the wildtype mouse M-opsin as evidenced by the observation that the ERG response is better preserved over time for the Opn1lw LIAIS /Opn1sw −/− mice compared to the Opn1mw/Opn1sw −/− mice (Fig. 10). The mouse M opsin and the engineered LIAIS variant are 90% identical in amino acid sequence (329 identical out of 369). There are 35 amino acid differences between the Opn1lw LIAIS and mouse M opsins. Humans have five amino acid positions that mice lack (Fig. 3), plus the differences listed as follows using the single letter amino acid code with the amino acid in the LIAIS opsin followed by the human amino acid number followed by the mouse amino acid: V58T, F62L, T65V, K80R, V104I, I111V, V115I, S116Y, M125L, L128I, T132I, I170T, I171V, A174V, I178V, S180A, V182I, H197Y, S211T, I221M, I230F, A233S, M236V, I274V, V279L, A292T, N294H, M303V, A305S, A308S, V320I, Q335H, G344S, and A350T (see Fig. 3 caption for single letter amino acid code). The majority of the spectral difference between the LIAIS L pigment variant and mouse M pigment is due to H197Y and A308S (Sun et al., Reference Sun, Macke and Nathans1997). Human L/M-opsins have histidine at position 197 and alanine at position 308 and as a consequence bind chloride under physiological conditions (Wang et al., Reference Wang, Asenjo and Oprian1993). Thus, the Opn1lw LIAIS variant is expected to bind chloride, whereas the mouse M pigment does not. One or more of the amino acid differences between the LIAIS and mouse M opsins may contribute to the more stable ERG responses over time for Opn1lw LIAIS.
Finally, an overarching goal was to develop an in vivo system to characterize the effects of variant L/M-opsin on the structure, function, and viability of the cones in order to understand the diseases at a mechanistic level and to evaluate potential therapies. Effects on LIAIS opsin antibody labeling associated with the absence of S-opsin were most pronounced in the ventral retina, where opsin coexpression is normally high in the wildtype mouse, and thus, the effects on cone function are also likely to be greatest in the ventral retina. In spite of this observation, the S-opsin knockout mice should serve the intended purpose of providing a test bed for studying mutant L- and M-opsins as long as the studies are restricted to the dorsal retina. Moreover, the problem seems even less of a concern since disruption of the cone outer segments was more apparent in the Opn1mw/Opn1sw −/− than in the Opn1lw LIAIS/Opn1sw −/− mouse, and it appears that in the absence of S-opsin, the hybrid mouse/human L-opsin may be better able to stabilize the cone outer segment.
Acknowledgments
This work was supported by NIH grant EYR01 009620, EY P30 001730, T32EY007030, Research to Prevent Blindness, the Bishop Foundation, and the Ray H. Hill Foundation. The authors thank D. Possin and J. Huang for their technical assistance.