Introduction
The location and geometry of a magma chamber influences the fracture pattern that deforms a volcano at the surface, and even caldera collapse and the distribution of post-caldera volcanism (Geyer & Martí Reference Geyer and Martí2009). The most commonly used data for constraining a volcano's mechanical behaviour and evolution are the history of its eruptions, present topography (Novelo-Casanova et al. Reference Novelo-Casanova, Valdés-González and Ramírez-Olvera2007), the fracture pattern observed at the surface, the vertical ground deformation obtained from InSAR (Interferometric synthetic aperture radar) studies (Amelung et al. Reference Amelung, Jonsson, Zebker and Segall2000), and geophysical data, including: seismic activity, seismic tomography images of the crust, and electromagnetic methods (Patanè et al. Reference Patanè, Barberi, Cocina, De Gori and Chiarabba2006).
The magnetotelluric (MT) method is a passive plane-wave electromagnetic technique that involves measurements of the natural electromagnetic field fluctuations in orthogonal directions at the Earth's surface to determine the resistivity variation of the Earth at depth (Tikhonov Reference Tikhonov1950). The MT method has been broadly tested as a powerful tool to produce images of subsurface structures, providing particularly good results in active volcanic regions, where conductive anomalies are commonly related to hydrothermal fluids and melt (Heise et al. Reference Heise, Bibby, Caldwell, Bannister, Ogawa, Takakura and Uchida2007, Hill et al. Reference Hill, Caldwell, Heise, Chertkoff, Bibby, Burgess, Cull and Cas2009, Ingham et al. Reference Ingham, Bibby, Heise, Jones, Cairns, Dravitzki, Bennie, Caldwell and Ogawa2009).
This paper presents the first MT results from Deception Island active volcano with the aim of constraining the melt distribution in the upper crust. In addition, we analyse the fault pattern previously observed onshore (field data and geomorphologic analysis) as well as offshore, inside the collapsed caldera (from new topographic parametric sonar (TOPAS) profiles) and correlate it with the electromagnetic results obtained from MT measurements.
Geological setting
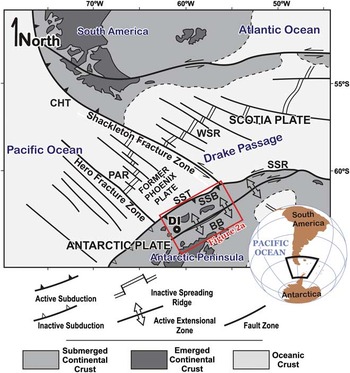
The Phoenix plate, formed by seafloor spreading since the Jurassic, has a long history of ridge-crest subduction beneath the Antarctic Peninsula (Barker Reference Barker1982). Since the mid-Cretaceous, the spreading ridge progressively subducted at the Pacific Antarctic Peninsula margin, causing the end of subduction (Lawver et al. Reference Lawver, Keller, Fisk and Strelin1995). Spreading on the Antarctic-Phoenix ridge stopped since the Pliocene (Livermore et al. Reference Livermore, Balanyá, Maldonado, Martínez, Rodríguez, Sanz De Galdeano, Galindo, Jabaloy, Barnolas, Somoza, Hernández, Surinach and Viseras2000). Therefore, subduction slowed and roll-back started at the South Shetland trench, between the Hero and the Shackleton fracture zones (Fig. 1) (Galindo-Zaldívar et al. Reference Galindo-Zaldívar, Gamboa, Maldonado, Nakao and Bochu2004), with opening of the Bransfield basin (Fig. 2a) and associated Quaternary volcanism (Fig. 2). Transtension associated to the westward ending of the left-lateral Scotia-Antarctica plate boundary could also favour extension in the Bransfield basin (Galindo-Zaldívar et al. Reference Galindo-Zaldívar, Gamboa, Maldonado, Nakao and Bochu2004).
Tectonic sketch of the study area. BB = Bransfield basin, CHT=Chile trench, DI = Deception Island, PAR = Phoenix–Antarctic ridge, SSB = South Shetland block, SSR = south Scotia Ridge, SST = South Shetland trench, WSR = west Scotia Ridge. Modified from Galindo-Zaldívar et al. (Reference Galindo-Zaldívar, Gamboa, Maldonado, Nakao and Bochu2004).

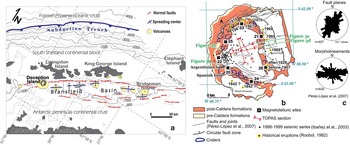
Location of Deception Island in the framework of the Bransfield basin. a. Tectonic map of Bransfield basin over the bathymetry. b. Geological map of Deception Island with the position of the magnetotelluric (MT) sites and the topographic parametric sonar (TOPAS) profiles (modified from Smellie & López-Martínez Reference Smellie and López-Martínez2002, Pérez-López et al. Reference Pérez-López, Giner-Robles, Martínez-Díaz, Rodríguez-Pascua, Bejar, Paredes and González-Casado2007). c. Rose diagrams that represent the strike of 457 fault planes measured by fieldwork and morpholineaments frequency trends (Pérez-López et al. Reference Pérez-López, Giner-Robles, Martínez-Díaz, Rodríguez-Pascua, Bejar, Paredes and González-Casado2007).

In the Bransfield basin, the volcanoes are generally submerged and grouped in parallel lines linked to normal faults (Barker & Austin Reference Barker and Austin1994). Deception Island, located close to the southern boundary of the South Shetland Block, is the most active one as deduced from the numerous historical eruptions reported (Roobol Reference Roobol1982, Smellie Reference Smellie2001) (Fig. 2b). It is a ring shaped volcanic island with a well developed ellipsoidal collapsed caldera - Port Foster bay. The Quaternary volcanic sequence at Deception Island, mainly of basaltic composition, is divided into pre-caldera and post-caldera formations (Baraldo & Rinaldi Reference Baraldo and Rinaldi2000, Smellie Reference Smellie2001). The present-day high geothermal activity, a persistent shallow seismicity with peaks of activity in 1992 and 1999 (Ibáñez et al. Reference Ibáñez, Carmona, Almendros, Saccorotti, Del Pezzo, Abril and Ortiz2003) and seismic tomography studies (Zandomeneghi et al. Reference Zandomeneghi, Barclay, Almendros, Godoy, Wilcock and Ben-Zvi2009) suggest a shallow magma chamber.
Fracture pattern in Deception Island
The regional fracture pattern is dominated by ENE–WSW normal faults linked to the rifting and progressive crustal thinning of the southern border of the South Shetland continental block since the Pliocene (Fig. 2a). Volcanic activity between Deception and Bridgeman islands is associated with an ENE–WSW deep fault zone that was revealed by seismic refraction (Ashcroft Reference Ashcroft1972, Grad et al. Reference Grad, Shiobara, Janik, Guterch and Shimamura1997) and seismic reflection profiles (e.g. Barker & Austin Reference Barker and Austin1994, Galindo-Zaldívar et al. Reference Galindo-Zaldívar, Gamboa, Maldonado, Nakao and Bochu2004).
The Quaternary volcanic rocks of Deception Island are highly dissected by joints and faults (Figs 2b & 3). Field studies show that faults have a variable dip, between 20° and 90°, with a dip-slip component, although the unconsolidated character of the volcanic rocks makes it quite difficult to recognize slickensides on the fault surfaces. Even so, these faults can be grouped in several sets on the basis of field data and geomorphological studies (Smellie & López-Martínez Reference Smellie and López-Martínez2002, Fernández-Ibáñez et al. Reference Fernández-Ibáñez, Pérez-López, Martínez-Díaz, Paredes, Giner-Robles, Caselli and Ibáñez2005, Maestro et al. Reference Maestro, Somoza, Rey, Martínez-Frías and López-Martínez2007, Pérez-López et al. Reference Pérez-López, Giner-Robles, Martínez-Díaz, Rodríguez-Pascua, Bejar, Paredes and González-Casado2007). Analysis of the fracture pattern provides evidence for a sub-vertical ring fault zone linked to the caldera collapse and linear fractures showing a main relative maxima striking NE–SW and a secondary NW–SE oriented (Pérez-López et al. Reference Pérez-López, Giner-Robles, Martínez-Díaz, Rodríguez-Pascua, Bejar, Paredes and González-Casado2007) (Fig. 2c). The main morphological lineaments trend ENE–WSW, with secondary sets oriented NW–SE (Pérez-López et al. Reference Pérez-López, Giner-Robles, Martínez-Díaz, Rodríguez-Pascua, Bejar, Paredes and González-Casado2007) (Fig. 2c). These fractures facilitated the intrusion of the post-caldera formations, including the recent volcanism (Fig. 3).
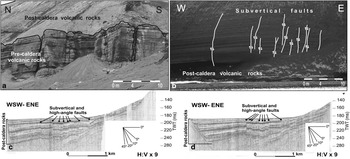
Fractures on Deception Island. Field examples of a. orthogonal joints favouring melt intrusions, b. onshore sub-vertical faults, and c.& d. offshore faults highlighted by TOPAS. Location in Fig. 2b.

In order to highlight the fracture pattern inside the caldera, four topographic echo sounder profiles with ultra high-resolution were collected in Port Foster during February 2008 by the RV Hesperides (Figs 2b, 3c & d). These ultra high-resolution seismic profiles were obtained with a TOPAS PS 018 Simrad system onboard RV Hesperides. It is a hull-mounted seabed and sub-bottom echo sounder based on the parametric acoustic array, which operates using nonlinear acoustic properties of the water. The system transmits approximately every 2 s with a beam angle of 4.5° at 3 kHz and a modulated frequency sweep (chirp) between 1.5 and 4 kHz. Two acoustic signals are transmitted with slightly different frequencies (primary frequencies 16–20 kHz) that interact within the water column, generating a secondary signal with a frequency of 0.5–5 kHz (secondary frequency), but retaining the same beam width as the primary pulse. The data were deconvolved and corrected for spherical spreading with a linear time varying gain prior to display. The vertical and horizontal resolution of the TOPAS records is very high (< 1 m), and the penetration in this area is several tens of metres. The chaotic acoustic nature of the pre-caldera rocks is characterized by a transparent seismic facies. The profiles show that the post-caldera deposits comprise a layered sequence of high and low reflectivity units. These deposits allow one to infer the different stages of the caldera collapse and represent deformation markers for the faults developed inside the caldera. The thickness of the post-caldera infill shows a progressive increase towards the western sector. The sub-horizontal beds are interrupted by sub-vertical and high-angle normal faults in the central part of the Port Foster favouring subsidence of the western block. These sub-vertical faults are also observed onshore. The off-set of the faults decreases upward, and is completely covered by the youngest deposits, revealing that progressive faulting is active at present and the sedimentation rate is higher than the slip rate of the active faults or perhaps the faults have ceased their activity today.
Magnetotelluric research
Magnetotelluric research involves the recording of electric and magnetic variations on the Earth's surface over several days. Once the time variations of electric and magnetic fields are obtained, the Fourier transform is used to derive the frequency components of the signals. Spectral analysis of these time series horizontal magnetic and electric field records yields the MT impedance tensor components, which are diagnostic of the electrical conductivity distribution in the Earth (Sutarno Reference Sutarno2005 and references therein). The obtained MT impedance tensor is analysed for dimensionality and directionality to decide the most appropriate modelling strategy. Finally, 1-D, 2-D or 3-D forward and/or inverse modelling of the impedances gives rise to images of the resistivity distribution at depth (Simpson & Bahr Reference Simpson and Bahr2005).
We have made broadband magnetotelluric measurements at seven sites spaced 2–5 km apart in the small volcanic Deception Island (13 x 15 km) during January and February 2008. The distribution of the sites was highly conditioned by the ring shape of the island (Fig. 2b) and its rugged topography, which made it difficult to find additional suitable sites. Recording time varied between 48 and 72 hours, covering a broad range of periods, from 0.001–1000 s. The good resistivity contact in the electrodes installed on unfrozen soils allowed for a high quality time series recording. The data collected were processed using robust cascade decimation (Wight & Bostick Reference Wight and Bostick1986) using coherency weighting and sorting with an overall high quality of the resulting curves up to 100 s.
Dimensionality analysis
Several methods may be used to analyse the dimensionality of MT data before performing data modelling. We applied the phase tensor method (Φ), which was defined by Caldwell et al. (Reference Caldwell, Bibby and Brown2004) in terms of the observed MT impedance tensor and represented as:

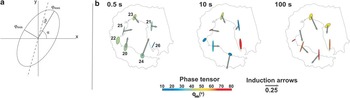
where the angle α depends on the orientation of the measurement axes, and the parameters Π1, Π2, and β are invariants. Graphically, it is plotted as an ellipse where the major and minor axis of the ellipse are proportional to the principal values of ϕmax and ϕmin that correspond to the maximum and minimum phase differences between the magnetic and electric fields and their directions (Fig. 4a). The angle α define the tensor's dependence on the co-ordinate system. The skew angle β determine the symmetry of the phase tensor. Skew angle (β) and strike direction with respect to the measurement axes (α-β) tensor ellipses give information of the conductivity gradients and of the dimensionality of the media (Cadwell et al. 2004).
Induction arrows and phase tensor ellipses at periods 0.5, 10, and 100 s. Colours of phase tensor ellipses correspond to the length of the minor axis.

In a 1-D situation, the ellipse is a near-circle with a radius proportional to the conductivity of the corresponding period. In a 2-D situation, where the two off-diagonal elements of the impedance tensor are non-zero, the semi-major (ϕmax) and semi-minor axes (ϕmin) of the phase tensor have different amplitudes and β is 0. Graphically, ϕmax and ϕmin coincides with the major and minor axes of a symmetric ellipse. In a 3-D situation, where the off-diagonal and diagonal elements of the impedance tensor are non-zero, the skew angle (β) has a non-zero value giving asymmetry to the ellipse.
Figure 4b shows the phase tensor ellipses from all the sites at three periods. Around 0.5 s, phase tensor ellipses are generally symmetrical with uniform ϕmax length and NNW strike, and quite homogeneous intermediate phase magnitude of the ϕmin, suggesting a 2-D behaviour at the shallowest crust. The complexity in the behaviour of the ellipses increases at longer periods. It is particularly asymmetric and heterogeneous in the size, orientation, and phase magnitude of ϕmin around 10 s, thereby revealing a 3-D character of the structure and the more conductive structure beneath site 26. At 100 s, the homogenous high magnitude of ϕmin suggests the presence of a conductor at depth.
In addition, we calculated the real Parkinson induction arrows that are commonly also sensitive to lateral electrical resistivity variations, pointing towards the conductive zones (Parkinson Reference Parkinson1962, Jones Reference Jones1986). Real Parkinson induction arrows and phase tensor results are consistent, indicating the location of anomalous conductive zones (Fig. 4b). At periods around 0.5 s, most of the real induction arrows have quite large amplitude, and while the arrows point toward the north to north-east at sites 20 and 24, they point toward the east at sites 20, 21, 23, and 25. At periods around 10 s, induction arrows roughly point towards site 26, except for site 24, whose arrows point toward the south. At periods around 100 s, real arrows point toward the south, indicative of a conductor extending toward the south.
Ocean effect
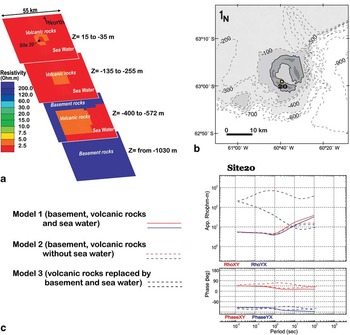
To analyse the 3-D effects related to the conductive seawater, we performed 3-D forward calculations using the MT3FWD code (Mackie et al. Reference Mackie, Smith and Madden1994) and compared the MT responses obtained with the MT field data (Fig. 5). A minimum squared error of 10-6 after 50 relaxation iterations was considered for the modelling.
a. Example of 3-D model performed to estimate the ocean effect in the magnetotelluric (MT) responses of Deception Island. b. Bathymetry simulated during the modelling. The location of site 20 is marked. c. Magnetotelluric responses from the 3-D models in site 20.

In Fig. 5 we show the results derived from three synthetic models. In a first analysis, the input 3-D mesh corresponds to a simple geological model comprising the main bathymetric features filled by conductive seawater (0.33 Ωm), the conductive volcanic rocks (2.5 Ωm) and the basement rocks of the Bransfield basin (60 Ωm). A second 3-D model was built using the same geological model but replacing the resistivity of the seawater with a very high resistivity body to simulate the air. The obtained MT responses from both models are quite similar. The influence of the conductive seawater (0.33 Ωm) was detected as a small displacement in the apparent resistivity and phase below 5–10 s. We also performed a third 3-D forward calculation using seawater resistivity plus a single 60 Ωm resistivity for the entire rock mass (volcanic rocks and basement), which is an extreme simplification of the land geology. The resultant MT responses were strongly influenced by the island effect.
The small influence of the coastal effect on the magnetotelluric sounding curves acquired on Deception Island could be explained by the smooth bathymetry around and within Port Foster and, perhaps more significantly, by the low resistivity contrast between the seawater and the hot and saturated volcanic rocks.
2-D inversion model
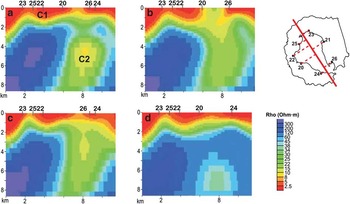
Although the data are mostly 3-D (Fig. 4), we derived a preliminary 2-D inversion model, orthogonal to the ENE–WSW regional geological structures of the Bransfield basin (Fig. 6), as a starting point to highlight the most important features of the crust before 3-D modelling. After rotation, all the sites were grouped into a NW–SE profile for 2-D inversion of the transverse magnetic (TM) and transverse electric (TE) modes - resistivity and phase - using the smoothing procedure (Rodi & Mackie Reference Rodi and Mackie2001). The inverted periods were limited to 0.01–100 s because the data quality decreases at longer periods. Inversion iterations started at a homogeneous half-space resistivity of 100 Ωm and a laterally regular cell size, increasing in size at greater depth. Static-shift was 2-D inverted as unknown variable. The model allows identification of two main conductor bodies (C1 and C2 in Fig. 6a) that were used as guideline during the 3-D forward model construction. A shallow conductor (c. 2.5 Ωm) extends from the surface up to 1–2 km depth. A second conductor (c. 5 Ωm) is located between 3 and 7 km. The obtained fit was quite good with a RMS error of 3.2.
Preliminary 2-D magnetotelluric (MT) model results a. inverting all the stations, b. omitting site 24, c. omitting site 20, and d. omitting site 26. Note that the conductor C2 remains stable in all the solutions.

To verify the robustness and resolution of the obtained electrical anomalous bodies, some tests were performed by including the curves with and without the static-shift corrections, omitting some sites, and varying the mesh dimensions. The presence of conductor C2 is sensitive to the data of sites 20, 24 and 26. It is necessary to exclude the data of these three soundings to withdraw the conductive zone beneath the south-eastern part of the island (Fig. 6). The smoothing factor τ selected during the inversion was 3, while the floor standard deviation error considered for TM and TE, resistivity and phases, was 5.0%. The obtained period range (0.01–100 s) was translated to 100 m to 14 km depth sensitivity in the models.
Magnetotelluric 3-D model
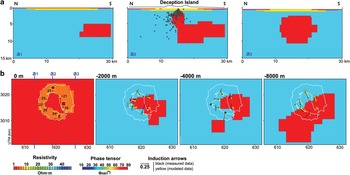
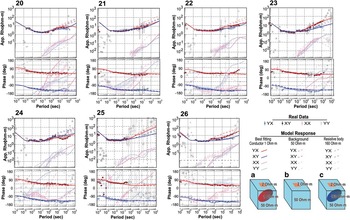
3-D forward modelling was performed, fitting apparent resistivity and phases of the real MT sites (Mackie et al. Reference Mackie, Smith and Madden1994) and taking into account the obtained induction arrows, which point to conductive zones, together with phase tensor results and preliminary 2-D inversion models (Fig. 7). A mesh of 28 × 31 × 40 cells, in the north–south, east–west and vertical directions, respectively, was used during the modelling, also including the topography above sea level. A minimum squared error of 10-6 after 50 relaxation iterations was considered for the modelling. Volcanic rocks of Deception Island were characterized by a low conductivity zone (2 Ωm) extending from the surface up to 1 km depth. The conductive seawater (0.33 Ωm) was modelled considering the main bathymetric features. In addition three shallow, small, conductive bodies (1 Ωm) were modelled close to sites 23, 24, and 26. These conductive bodies cause the YX apparent resistivity to be greater than the XY at site 24, while the reverse is true at sites 23 and 26. An ENE–WSW elongated conductor (1 Ωm) was modelled between 2 and 10 km with an estimated volume of 1000 km3 beneath the southern part of Deception volcano and extending toward the south-east, as revealed by the induction arrows (Fig. 7). We interpreted this conductor as partial melt associated with a magma chamber beneath Deception Island. The sensitivity of the best-fitting model was tested after comparison with the response of other alternative models that included: different location and resistivity of the conductor, diverse geometry and size, absence of the main conductor, and replacement of this conductor by a high resistivity body (Fig. 8). The 3-D resistivity model presented in Fig. 7 almost completely accounts for the obtained sounding curves - diagonal and off-diagonal elements - (Fig. 8) and the general pattern of the induction arrows. However, the sounding curve of site 25 is poor quality in the frequency range lower than 0.3 Hz. Therefore, the resistivity structure deeper than 1000 m beneath site 25 is not well constrained by data. Nevertheless, the fit between model and the other sounding curves reveals the location of a conductor beneath the south-eastern part of Deception Island, as the preliminary 2-D model suggested. Sensitivity tests show that this conductor is elongated in an ENE–WSW direction. However, it is impossible to better constraint the resistivity structure far away from the Deception Island.
a. 3-D resistivity models along north–south cross sections (section A2 crosses though the centre of Deception Island showing the location of earthquake hypocenters recorded during the 1992 and 1999 seismic crises (Ibáñez et al. Reference Ibáñez, Carmona, Almendros, Saccorotti, Del Pezzo, Abril and Ortiz2003)), and b. four horizontal slices where a conductor with ENE–WSW elongation between 2 and 10 km is detected. The induction arrows and phase tensor ellipses at periods 0.5, 10, and 100 s approximately correspond with the depth of the slices, pointing towards the conductor. Colours of phase tensor ellipses correspond to the length of the minor axis. The induction arrows derived from the model are plotted.

3-D magnetotelluric (MT) model results, curves and responses. The fits of the different models reveal the sensitivity of the model that supports the presence of a conductor between 2 and 10 km.

Discussion and conclusions
New geophysical data from the volcanic Deception Island can inform discussion of the relationships between the magmatic chamber and the fracture pattern associated with caldera collapse. Although it is not easy to detect magma chambers beneath islands surrounded by conductive seawater using MT, in this case both 2-D and 3-D models reveal low resistivity values, below 2 km, that could correspond with the position of a magmatic chamber and the associated hot fluids related to recent volcanic activity.
Structure of the upper crust in the region has been studied from gravity and magnetic (Muñoz-Martín et al. Reference Muñoz-Martín, Catalán, Martín-Dávila and Carbó2005, Catalán et al. Reference Catalán, Agudo and Muñoz2006), seismic (Ben-Zvi et al. Reference Ben-Zvi, Wilcock, Barclay, Zandomeneghi, Ibáñez and Almendros2009, Zandomeneghi et al. Reference Zandomeneghi, Barclay, Almendros, Godoy, Wilcock and Ben-Zvi2009) and topographic experiments (Barclay et al. Reference Barclay, Wilcock and Ibáñez2009). Gravity and magnetic studies demonstrated the existence of two types of crust (continental and more basic), separated by an ENE–WSW contact and the presence of several fault/dike systems (Muñoz-Martín et al. Reference Muñoz-Martín, Catalán, Martín-Dávila and Carbó2005, Catalán et al. Reference Catalán, Agudo and Muñoz2006). This crustal ENE–WSW fault dipping toward the south is well constrained laterally by seismic reflection profiles (Galindo-Zaldívar et al. Reference Galindo-Zaldívar, Gamboa, Maldonado, Nakao and Bochu2004) and seismic refraction profiles (Grad et al. Reference Grad, Shiobara, Janik, Guterch and Shimamura1997). However, the resistivity values of these two crusts should be very similar and actually have no significant effect on the MT responses.
Magnetic and gravity data also reveal the presence of a NW–SE trending anomaly probably related to a partially melted low bulk susceptibility intrusive body (Muñoz-Martín et al. Reference Muñoz-Martín, Catalán, Martín-Dávila and Carbó2005). Seismic tomography results reveal the presence of a low P wave velocity sector beneath the caldera floor interpreted as a shallow magma chamber (Ben-Zvi et al. Reference Ben-Zvi, Wilcock, Barclay, Zandomeneghi, Ibáñez and Almendros2009, Zandomeneghi et al. Reference Zandomeneghi, Barclay, Almendros, Godoy, Wilcock and Ben-Zvi2009). These studies suggested the caldera and associated chamber were elongated in a NW–SE orientation. Previous calculation of the magma chamber volume derived from seismic studies indicated a melt volume up to 20 km3 (Ben-Zvi et al. Reference Ben-Zvi, Wilcock, Barclay, Zandomeneghi, Ibáñez and Almendros2009). In addition, the volume of the magma chamber estimated from eruption products varies from c. 30 km3 (Smellie Reference Smellie2001) up to c. 60 km3 (Martí et al. Reference Martí, Vila and Rey1996). The magnetotelluric 3-D model confirms the presence and extension of a previously predicted magmatic chamber, which is elongated in an ENE–WSW orientation. The modelled conductor has c. 1000 km3 that can be attributed to the combination of partial melt and fluids. Although it is impossible to accurately discern the fraction of partial melt and hot fluids involved in the conductor, the obtained volume suggests the presence of a magma chamber larger than previously considered.
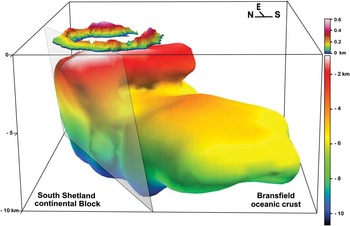
The emplacement of melt occurred in the hanging wall of an ENE–WSW oriented and south-east dipping regional normal fault bounding the continental crust of the South Shetland block and the incipient oceanic crust of the Bransfield basin (Fig. 9). The seismic distribution pertaining to the earthquake swarms of 1992 and 1999 is concentrated at the top of the magma chamber, and coincides with the hanging wall of the ENE–WSW normal fault zone. In addition, this regional fault controls the water temperature in Port Foster; the hot water is located in the northern part of the Bay with an ENE–WSW trend distribution (Somoza et al. Reference Somoza, Martínez-Frias, Smellie, Rey and Maestro2004) coinciding with the regional fault trace. Although the main ENE–WSW fault facilitates the emplacement of melt and hot fluids in the upper crust, secondary fractures with different orientations could connect the melt and hydrothermal fluids with the surface.
Sketch of Deception Island showing the location of the conductive body that suggests the emplacement of melt driven by an ENE–WSW oriented and SSE dipping regional normal fault.

The faults that cut the deposits associated with the caldera collapse accommodated the subsidence of the north-western sector of Port Foster. Regarding the slight displacement of the magma chamber to the south-east, differential subsidence would be associated with the progressive cooling of the north-western part of the island. We highlight the prevalence of sub-vertical faults accommodating dip-slip movements and high angle normal faults in Deception Island. The magmatic vertical movements favour radial extension in the island. Fieldwork and morphological analysis reveals the presence of ENE–WSW to NE–SW and NW–SE linear fault system and faults with a circular pattern in Deception Island (Pérez-López et al. Reference Pérez-López, Giner-Robles, Martínez-Díaz, Rodríguez-Pascua, Bejar, Paredes and González-Casado2007). The ENE–WSW to NE–SW oriented fractures are the main set that run parallel to the regional normal faults associated with the Bransfield basin spreading. The secondary NW–SE set could be a consequence of intermittent permutation of the maximum extension direction in a setting of radial extension due to close values of σ2 and σ3. This stress setting is responsible for the caldera collapse and it ellipsoidal shape, which is slightly elongated sub-parallel to the regional extension.
Acknowledgements
We are grateful to the personnel of the Gabriel de Castilla Spanish base, the RV Hesperides navy crew, and the Unidad de Tecnologia Marina (UTM) for their assistance. We are sincerely grateful to Alan P.M. Vaughan, Earth Sciences editor of Antarctic Science, Malcom Inghan, John Smellie, Enmanuele Lodolo, and two anonymous reviewers for their constructive criticism of the paper. We acknowledge financial support: POL2006.13836.C03.01, CTM2008-06386-CO2/ANT, CGL2009-13706-CO3-01 (PaleoAndes II), CSD2006-0041 “Topo-Iberia”, P09-RNM-5388, CGL2010-21048, CTM2011-30241-C02-02, and RNM 148. Jean Louise Sander revised the English.