I. INTRODUCTION
Higher manganese silicides (HMSs), chemically represented by MnSix (x = 1.71–1.75), are one of the most promising semiconductors suitable for applications in thermoelectric energy harvesting systems and optoelectronic devices.Reference Fedorov, Zaitsev and Rowe1, Reference Mahan2 They exist as several incommensurable phases such as Mn4Si7, Mn11Si19, Mn15Si26, and Mn27Si47,Reference de Ridder, van Tendeloo and Amelinckx3–Reference Zaitsev and Rowe5 all of which belong to the same tetragonal crystal system deduced from the TiSi2 structure with different numbers of subcells stacking along the c-axis. These incommensurable phases usually coexist with each other. As a promising p-type thermoelectric material, HMSs have been extensively studied due to their advantages such as nontoxicity, low costs of starting materials, high thermal and chemical stability, etc.Reference Fedorov, Zaitsev, Solomkin and Vedernikov6 Recently, much more attention has been paid to the synthesis of thermoelectric bulk nanomaterials using methods like powder metallurgy, quenching, and melt spinning. In our previous work on nanostructuring of HMS by ball milling,Reference Zhou, Zhao, Zhu, Dasgupta, Stiewe, Hassdorf and Mueller7 it was found that the high-energy ball milling introduced a mechanochemical decomposition of HMS, which was closely dependant on the grain size of the powders. By controlling the milling conditions, ultrafine HMS powders within tens of nanometers without obvious impurity phase have been obtained. In the successive investigation, we also found that the single-phase nanopowders (NPs) synthesized by ball milling were unstable at high temperatures. For a better understanding of this phenomenon, we applied energy dispersive x-ray diffraction (EDXRD) for an in situ study of the phase transformations. Possible mechanisms of the transformation behavior were discussed accordingly.
II. EXPERIMENTAL
The HMS powders investigated in this work were obtained by ball milling an ingot of MnSi1.75, which was prepared by induction melting as described elsewhere.Reference Zhou, Zhao, Zhu, Cao, Stiewe, Hassdorf and Mueller8, Reference Zhou, Zhu, Ni, Zhang and Zhao9 The ball milling was performed in a planetary ball mill with tungsten carbide jars and balls at a fixed speed of 300 rpm. Milling duration was controlled as 30 min for obtaining micropowders (MPs) and 810 min for NPs. Densification process of the powders was carried out by uniaxial hot pressing at 900 °C for 60 min under 100 MPa in vacuum. The pellets hot pressed from MPs and NPs were named as MPP and NPP, respectively. The crystal structures of the powders and the pellets were determined by angle dispersive x-ray diffraction (ADXRD) with a Siemens D5000 diffractometer (Munich, Germany) using Cu Kα radiation (λ = 1.5406 Å). The morphologies and microstructure were observed using scanning electron microscopy (SEM; Zeiss ULTRA-55, Oberkochen, Germany). Transformation behavior of the specimens was studied using a Netzsch DSC-404 differential scanning calorimeter (DSC; Netzsch, Selb, Germany) with a heating rate of 10 K/min in flowing argon. For an in situ investigation of the phase and structural stabilities of HMS, the MPs and NPs were studied by EDXRD.
EDXRD measurement was performed at the HASYLAB of DESY in Hamburg, Germany. In comparison with conventional ADXRD measurement where the wavelength (λ) of the x-ray is fixed and the Bragg angle (θ) varies, EDXRD is performed with energy dispersive (variable λ) x-ray beams where the θ is fixed. In addition, the beams for EDXRD produced by synchrotron radiation are much stronger than the normally used Cu Kα radiation. Therefore, EDXRD allows much faster and reliable data acquisition and also avoids the undesired Kα 2 effects, and thus has for long been used for in situ studies in combination with high temperature and high pressure. In this work, EDXRD patterns were acquired from room temperature to 1000 °C at low pressure (0.01 GPa) and high pressure (2.5 GPa), respectively. Details of the principle and method of the EDXRD measurement have been reported elsewhere.Reference Chen, Zhao, Zhu, Jiang, Stiewe, Lathe and Mueller10
III. RESULTS
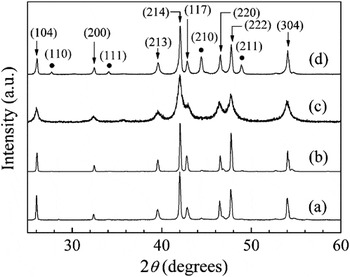
Figure 1 shows the ADXRD patterns of the as-milled powders and the hot pressed pellets. It can be seen that the shortly milled MPs were almost single phase, which could be well indexed to one of the HMS phases (Mn4Si7). As the powders were further ball milled for 810 min (NP), the diffraction peaks broadened and no impurity phase was observed. Interestingly, noticeable MnSi phase occurred in the hot pressed pellet (NPP), suggesting that some phase transformation took place during the hot pressing of the NPs. In comparison, the MP showed very stable phase structure after hot pressing. This implies that the phase transformation of HMS was directly influenced by the initial grain sizes of the powders. It is worth noting that in Fig. 1, trace amount of MnSi was also observed in both MP and MPP. This is due to the presence of MnSi layers precipitated in the HMS matrix as the melt was cooled down, which was known as an inherent feature of melted HMS.Reference Nishida, Masumoto, Kawasumi and Sakata11, Reference Aoyama, Fedorov, Zaitsev, Solomkin, Eremin, Samunin, Mukoujima, Sano and Tsuji12
Angle dispersive x-ray diffraction patterns of (a) micropowders (MPs), (b) MPP (pellets hot pressed from MPs), (c) nanopowders (NPs), and (d) NPP (pellets hot pressed from NPs). Peaks pointed by triangle arrows are indexed to those of the Mn4Si7 phase (JCPDS No. 72-2069) and the round dots correspond to the MnSi phase (JCPDS No. 81-0483).

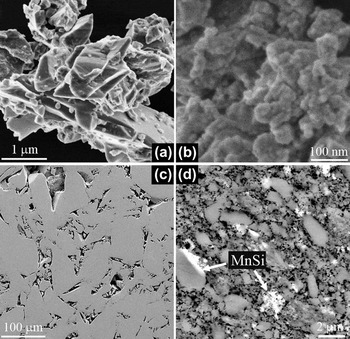
Figure 2 shows the SEM images of the powders and the pressed pellets. The MPs were composed of large particles of a few micrometers, whereas the particle sizes of the prolonged ball milled NP were within a few tens of nanometers, which was in good agreement with the average grain size of ∼26 nm estimated by the Scherrer’s equation from the ADXRD results. After hot pressing, both the specimens MPP and NPP showed increased grain sizes, averagely in the range of 50–100 μm and 0.5–2 μm, respectively. As shown in the SEM images, specimen MPP showed almost homogeneous microstructure, whereas the NPP was obviously a mixture of a gray matrix and some bright inclusions, which were confirmed by EDX measurement to be HMS and MnSi, respectively.
Scanning electron microscopy images of the higher manganese silicide (HMS) specimens (a) MP, (b) NP, (c) MPP, and (d) NPP.

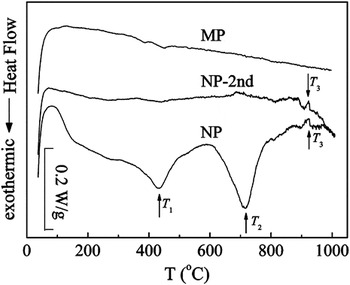
Figure 3 shows the DSC curves during the first heating cycle (for the NP also the second cycle). One can see that the MPs showed no obvious peak in the DSC curve. However, the NP exhibited two broad exothermic peaks at 430 °C (T 1) and 725 °C (T 2), respectively. In addition, a weak endothermic peak at around 920 °C (T 3) was also observed in the NP, which was repeated again during the second heating cycle. Comparatively, the repeatable peak T 3 was not found in the MP. The DSC results suggested some important phase transformations of HMS NPs in the corresponding temperature ranges, which will be revealed by the in situ EDXRD study followed.
Differential scanning calorimeter curves of the as-milled HMS powders.

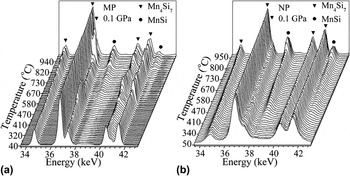
Figure 4 shows the low pressure (0.1 GPa) in situ EDXRD patterns of the MPs and NPs. It is shown that the HMS structure in the MPs was quite stable from room temperature to around 600 °C. On further increasing the temperature, the MnSi phase started to develop continuously and reached maximum amount at 1000 °C. However, in the DSC measurement of MP, such a transition was undetectable, possibly because the reaction was very weak. Second, the intensity of the (117), (220), and (222) peaks showed significant fluctuation with increasing temperature. This may be due to the movement of HMS particles during the heating process producing some preferred crystalline orientations. Compared to the MPs, the NPs showed different transformation behavior. As can be seen from Fig. 4(b), the phase transformation from HMS to MnSi developed much earlier and faster than that in Fig. 4(a). It was impressing that at elevated temperatures, the intensity of MnSi main peak at 38 keV showed firstly an increase followed by a decrease, indicating that the phase transformation between 800 and 900 °C should be reversible. As to the HMS peaks in the NP, the intensity fluctuation was, however, not observed.
Energy dispersive x-ray diffraction (EDXRD) patterns of HMS (a) MPs and (b) NPs with increasing temperature at 0.1 GPa.

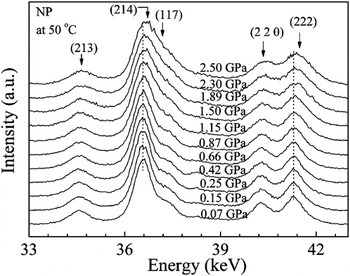
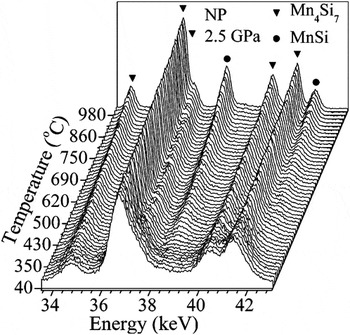
The high pressure effect on the transformation behavior of HMS was also investigated. Figure 5 and Fig. 6 show the isothermal and isobaric EDXRD patterns of the NPs, respectively. From Fig. 5 one can see that with increasing pressure, all the peaks of HMS shifted slowly toward higher energy level, suggesting reduced lattice parameters. Moreover, the diffraction peaks significantly broadened, resulting in an overlap of the (214) and (117) diffraction peaks of HMS above 1.5 GPa. This can be explained by the high internal strain effect caused by high pressure. From Fig. 6, one can see that the transformation behavior of the NPs under high pressure was similar to the case at low pressure except one point, i.e., the disappearance of the reversible change of MnSi phase between 800 and 900 °C. Instead, the MnSi secondary phase developed continuously from 400 to 1000 °C at 2.5 GPa. In addition, the overlap of the (214) and (117) diffraction peaks was weakened as the temperature increased, possibly due to release of high internal strain by grain boundary movement and grain growth during the heating process.
Isothermal EDXRD patterns of HMS NPs with increasing pressure at 50 °C.

Isobaric EDXRD patterns of HMS NPs with increasing temperature at 2.5 GPa.

The in situ EDXRD patterns qualitatively revealed some phase transformations of HMS as high temperature or/and high pressure was applied. The MPs and NPs showed different starting temperature and phase transformation rate. According to the basic energy dispersive diffraction theory,Reference Kaempfe, Luczak and Michel13 the lattice spacing d can be calculated by the Bragg equation:

where E is the energy of the synchrotron radiation and θ is the diffraction angle. Since θ was an unknown but fixed value, we used NaCl as a reference sample for determination of θ. The lattice parameters a and c of HMS phase can be then deduced from the d spacing of the three strongest peaks.
The strain ε introduced by heat or pressure in the material can be calculated by

where ∆E is the energy deviation of the corresponding peak. The broadening of the diffraction peaks β was contributed by two parts as



where β is the observed full width half maximum (FWHM) of the corresponding peak; βd is the broadening caused by the decrease of average grain size d; and βs is the one associated with strain. Here, k is a constant (usually we take k = 0.89) and λ is the wave length of the absorbed x-ray, which can be calculated by

where h is the Plank constant (4.135 × 10⁻¹⁵ eV·s) and c the velocity of light (2.997 × 10⁸ m/s) in vacuum. Combining Eqs. (3)–(6), the average grain size d can be accordingly calculated.
For description of the degree of phase transformations, we define a factor η expressed as:

where I is the strongest peak intensity of certain phase in the ADXRD or EDXRD patterns, and the suffixes m and s represent the main phase (HMS) and the secondary phase (MnSi), respectively.
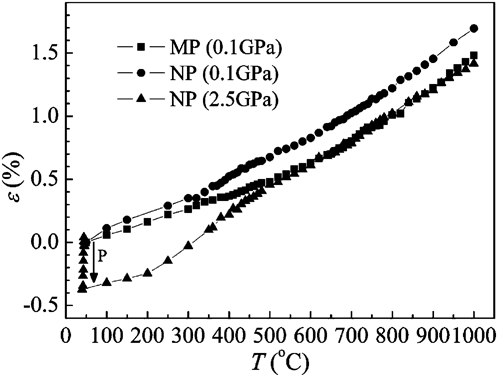
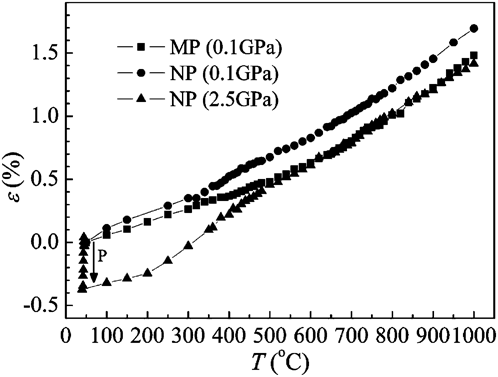
Figure 7 plots the dependence of the internal strain on temperature and pressure. At 0.1 GPa, the strain increased monotonically with increasing temperature in both specimens due to thermal expansion of the lattice. The slope of the curve also slightly increased as the temperature increased. Generally, the strain in the NPs was higher than that in the MPs, especially at temperatures over 300 °C, which indicated that the total internal energy of the NPs was higher. This may be one of the intrinsic reasons why phase transformations in NPs took place much earlier than in the MPs. On applying higher pressure at 50 °C, the strain in NP was increased due to pressure-induced lattice distortion. In the following heating process at constant pressure (2.5 GPa), the strain was firstly released and then reversibly increased by thermal expansion. In this process, the total internal energy of the material could be intensively increased by both high pressure and high temperature.
Strain ε introduced by heat and pressure. The letter “P” indicates the load direction of pressure.
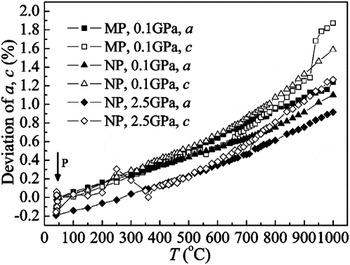
The deviation of lattice parameters caused by thermal expansion or lattice distortion was shown in Fig. 8. For all the specimens, the lattice was enlarged in both a-axis and c-axis by heating. The effect of high pressure on lattice distortion was also observed from the lattice parameter deviations changing toward minus values at 50 °C. Nevertheless, high temperature was observed to have more significant effect than high pressure on the lattice changes. Moreover, we observed that the increase of c value was larger than that of a value, especially at higher temperatures. At 1000 °C, the maximum difference between the deviation of a and c was more than 30%. Considering the high aspect ratio of HMS unit cells (c/a = 4–17), the absolute change of lattice parameter c was even larger than a. This should be caused by the loose interaction of Si atoms in the crystal structure of HMS,Reference Fedorov, Zaitsev and Rowe1, Reference Zaitsev and Rowe5 allowing Si atoms to move more flexibly along the c-axis than along the a-axis. As we know, the HMS powders were actually a mixture of several incommensurable HMS phases with different c lattice parameters. Here, all the lattice parameters were calculated on the premise that the material was a single phase (Mn4Si7). So the calculated values of a and c might not be the real ones. However, the percentage deviations of a and c in Fig. 8 do indicate the trend of the lattice changes. This means, the HMS could probably evolve into structures with a larger c at certain temperatures, e.g., from Mn4Si7 to Mn11Si19. This structural interevolution would cause compositional change of the material, which should be the main reason of the stepwise MnSi appearance.
Lattice parameter deviation of the specimens. The letter “P” indicates the load direction of pressure.

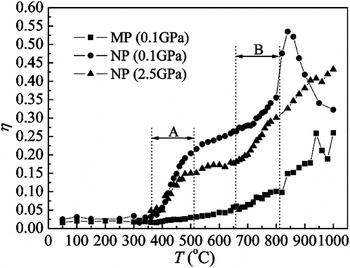
As can be seen from the EDXRD patterns, the phase transformations of HMS can be characterized by the development of the MnSi phase. The dependence of η factor on temperature was shown in Fig. 9, which demonstrated the relation of phase transformations to grain size and pressure. The MPs showed nearly unchanged η in lower temperature range. Distinct phase transformation (η > 0.1) was observed only at high temperatures over 800 °C. For the NPs at 0.1 GPa, however, the MnSi phase started to develop rapidly from 350 to 500 °C followed by a slow increase of η in the intermediate temperature range. At even higher temperatures, a peak centered at 850 °C was observed in the η–T curve, which corresponds to the reversible change of the MnSi phase in Fig. 5. This reversible behavior was also observed in the MPs at higher temperatures. As to the high pressure effect, a lower plateau in the η–T curve was observed, indicating that the phase transformation in NPs was depressed by high pressure at intermediate temperatures. However, at high temperatures, the phase transformation was accelerated again and the MnSi phase appeared continuously up to 1000 °C.
η factor calculated from the EDXRD results.

Combining Fig. 3 and Fig. 9, we can now associate the two exothermic peaks T 1 and T 2 in the DSC curves with the stepwise MnSi formation which was accelerated in two temperature ranges, labeled as A and B in Fig. 9. The temperature of the peaks T 1 and T 2 match well with the two inflexion points of the η–T curve in those two regions. At temperatures over 850 °C, the MnSi phase in NP was found to decrease in Fig. 9. This means the interevolution phase transformation in NP over 850 °C was reversible so that some MnSi phase resolved again into HMS. This may be associated with the peak T 3, since peak T 3 shows endothermic behavior, and the reversibility of this interevolution was confirmed by the repeat of T 3 peak during the second cycling. However, the peak T 3 is much weaker compared to T 1 and T 2, which may imply that the interevolution of HMS phases at high temperatures was less affected by temperature, but more dependent on the structural stability compared to those at intermediate temperatures. So the temperatures to which the peaks in the η–T curves of specimen MP and NP correspond show different values and even no peak was observed in the DSC curve of MP at high temperatures. The high pressure was considered to cause lattice distortion in the NP, competing with the thermal expansion effect of high pressure. At intermediate temperatures (400–650 °C), the pressure effect may dominate so that the phase transformation was slightly suppressed, whereas at elevated temperatures the temperature effect is more significant, which can also be seen from the strain change in Fig. 7. Due to thermodynamic reasons under both high pressure and high temperature, the reversibility of the interevolution of HMS disappeared over 800 °C, which was replaced by continuous development of MnSi phase.
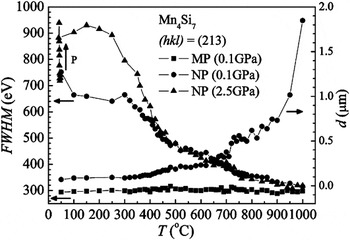
The FWHM of the (213) diffraction peak and the average grain size d as a function of temperature were plotted in Fig. 10. The average grain size d was estimated using the Scherrer’s equation and the broadening of the peaks were corrected by subtracting the FWHM of the MPs.Reference Zhou, Zhao, Zhu, Dasgupta, Stiewe, Hassdorf and Mueller7 It is to mention that the d values larger than 100 nm shows increasing deviation from the microscopic grain size, so they are presented here only for comparison. It can be seen that at low temperatures, the high strain contributed more to the broadening of the peak. However, at higher temperatures the grain size effect was much more significant so that the strain effect on the FWHM could be ignored. The calculated initial average grain size of the NPs was around 100 nm, which was relatively larger than calculated from the ADXRD results (26 nm). During the heat treatment at 0.1 GPa, the grain size was kept nearly unchanged below 400 °C. Obvious grain growth was observed over 700 °C, and the growth rate increased exponentially with increasing temperature up to 1000 °C. The average grain size at 1000 °C was increased by more than 20 times to micrometer size compared to that before heated, which agreed well with Fig. 2(d).
Full width half maximum (FWHM) and average grain size d of the samples calculated from the (213) peak of Mn4Si7. The letter “P” indicates the load direction of pressure.

IV. DISCUSSION
To understand the mechanism of the phase transformations of HMS, the crystallographic characteristics of HMS have to be noted. HMS stands for a group of manganese silicides with the so-called chimney ladder structures,Reference Fedorov, Zaitsev and Rowe1 i.e., a chimney-like Mn subcell and a ladder-like Si subcell, whose lattice constants along c-axis are represented by c Mn and c Si, respectively. Due to weaker interaction of Si atoms than Mn ones along the “chimney” of the structure, the Si atoms can move more flexibly resulting in a fixed c Mn but a variable c Si that strongly depends on the chemical composition. For a certain c Si/c Mn ratio, the number of the Mn and Si subcells required to form a repeatable unit cell is fixed. All the configurations being able to form HMS phases had been theoretically calculated.Reference Zaitsev, Ordin, Rakhimov and Engalychev14 Principally, the Si/Mn ratios in the range between 1.71 and 1.75 follow the HMS phases, among which Mn4Si7, Mn11Si19, Mn15Si26, and Mn27Si47 have been experimentally confirmed.Reference Zaitsev and Rowe5
In this work, the HMS MPs and NPs underwent several phase transformations during the heating process, producing a MnSi secondary phase. The presence of MnSi should be considered as the result of the interevolution of different HMS structures (e.g., through the reaction Mn4Si7 → Mn11Si19 + MnSi) in the thermal expansion coefficient measurement. From Fig. 2, one can roughly estimate the volume fraction of the MnSi phase in the hot pressed material to be 5–10%, so it is reasonable to conclude that the interevolution of HMS phases mainly contributed the MnSi presence in the whole temperature range.
To understand the grain size effect on the phase transformations, there are three important aspects need to be mentioned. The first is the different energy status of MPs and NPs. As we know, the high-energy ball milling process can provide instantaneously giant stress (1–10 GPa) and high energy density (105–106 J/m2) into the solids.Reference Venkataraman and Narayanan15 So the ball milling process can cause severe structural deformation storing deformation energy in the materials. Meanwhile, the refinement of grains results in additional surface energy, which is extraordinary high when the grain size goes down to nanoscale. As a result, the HMS NPs actually possess much higher internal free energy than the MPs before hot pressing, which tends to be relaxed when heated. This may be the reason why the phase transformation of HMS NPs took place much earlier than that in the MPs. Second, the thermodynamic properties of Mn–Si system should be concerned. Kanibolotskii and LesnyakReference Kanibolotskii and Lesnyak16 have generalized the thermodynamic properties of Mn–Si alloys from a number of studies, and it was found that the enthalpies and the Gibbs energy of mixing for Mn–Si alloys showed the lowest values when the composition is near MnSi. This suggested that some HMS phases may not be any more stable given some critical conditions such as high pressure and high temperature, especially when the material is already with high free energy (NPs). This explains basically from thermodynamic point of view why the HMS phases undergo interevolution at certain temperatures. The third point is the crystal structure features of HMS phases. As the interaction of Si in HMS structures is very loose along the c-axis, the atomic vibration enhanced by high temperature can be so intensive that rearrangement of atoms takes place, resulting in the change of the overall composition of HMS phase and the presence of MnSi. However, this instability feature is not obvious at low temperature, so that the MP required higher temperature over 700 °C for the phase transformation. On the other hand, this structural instability is more significant when the grain size goes down to nanometers because in that case the number of unit cell in a single grain decreases to the order of 101, which can hardly be preserved if the temperature goes up. As a result, the interevolution phase transformation in HMS NPs was accelerated at lower temperatures compared to the MPs.
V. CONCLUSIONS
Interevolution phase transformations were observed in HMS powders with different initial grain sizes by EDXRD studies. In the NPs, the phase transformation was accelerated in the temperature range of 350–450 and 700–800 °C, whereas in the MPs the temperature required for phase transformations was much higher. On applying high pressure, the phase transformation was suppressed at intermediate temperatures and again intensified at higher temperatures. Reversible interevolution of different HMS phases was also observed at 800–1000 °C in both NPs and MPs. The grain size effect on the phase transformations can be understood in its contribution to the increase of additional internal free energy including specific surface energy and deformation energy. Due to thermodynamic instability of HMS at critical conditions and the highly anisotropic structures of HMS, a few HMS phases with lower Si content are preferred in the heating process resulting in simultaneous presence of MnSi.
ACKNOWLEDGMENTS
The authors thank Dr. C. Lathe, HASYLAB at DESY, Notkestrasse 85, D-22603 Hamburg, Germany, and Prof. J.Z. Jiang, Department of Materials Science and Engineering, Zhejiang University, for the help on the EDXRD measurements and discussions. This work was supported by the National Science Foundation of China (50731006), the National Basic Research Program of China (2007CB607502), Zhejiang Provincial Natural Science Foundation of China (Z4090204), and the Sandwich Fellowship of the German Academic Exchange Service (DAAD).