1. Introduction
The valuation of new goods or services has been an area of extensive study in recent years. In the development and environmental economics literature, the use of experimental methods to elicit the willingness-to-pay (WTP) for new goods and services has proven to be quite popular. Often, the objective is to elicit a participant's WTP for something that typically does not currently exist (e.g., drought-resistant crops) or has a value that is difficult to determine (e.g., environmental services). In order to make the decision-making process more realistic, experimenters often endow participants with cash that they can use. Cash is typically used because everyone values it equally – even though different agents may have different marginal utilities of income. However, this form of remuneration may not always be possible.
In less developed countries (LDC), the use of cash in experiments may not be practically feasible due to the existing relationships between local institutions and the nearby population. The sensitive nature of cash payments, the setting of an unsustainable precedent or the possibility of offending village leaders are all outcomes that local research partners may wish to avoid (Cook et al., Reference Cook, Chatterjee, Sur and Whittington2013).Footnote 1 This poses a problem for economic experiments: how should participants be compensated or endowed when cash payment is not feasible? This is an important issue as the results of economic experiments are often used to make important decisions and can influence policy making. If the results are difficult to interpret or – even worse – incorrect, this can lead to actions and policies that do more harm than good. Using a framed field experiment in Odisha, India (formerly known as Orissa), we explore an alternative payment, in-kind, and its effect on the valuation of yield-stabilizing seed traits compared to that of cash.
Empirically, very little research has been done on the differences between cash and non-cash payment methods on valuation in an experimental setting. Cook et al. (Reference Cook, Chatterjee, Sur and Whittington2013) is the only study that we know of in which participants were paid in-kind using a prize voucher system. Unfortunately, their study did not consider the effect of payment method on participants' bidding behavior since they did not use cash as well and their study did not focus on eliciting WTP. Studies that investigate the differences between cash and non-cash valuation/payment methods in which a voucher system is not used include Eom and Larson (Reference Eom and Larson2006) and Rai and Scarborough (Reference Rai and Scarborough2013). Both of these studies elicited WTP using labour contribution (as well as cash) The closest study to ours is in the environmental and resources literature, where Abramson et al. (Reference Abramson, Becker, Garb and Lazarovitch2011) looked at the valuation of rural water services in Zambia. They compared cash-based WTP estimates with ‘willingness-to-borrow’ (WTB) and ‘willingness-to-work’ (WTW) measures. WTB was measured as the amount a participant was willing to borrow in cash in the form of an interest-free loan. WTW was measured as the amount of time a participant was willing to contribute to a task involving unskilled labor. While the ‘items’ used to measure WTB and WTW were not actual goods, the general principle of using a cash alternative is similar to ours. The authors found that the alternative forms resulted in higher demand for water services. The larger implication was that limited cash constrained demand, but when participants were allowed to pay for the service in other ways, demand increased. In certain LDC regions that are less monetized and more barter based, it may simply be more natural for residents to think of payment for goods and services in non-cash terms.
Our in-kind items consisted of everyday household items that are commonly purchased in the sense that all the participants would have had experience purchasing these items, and they would have purchased these items fairly regularly throughout the year. We used the prices charged by the local shop, which are fairly static and commonly known. For these reasons, we believe it is reasonable to assume that the vast majority, or even all, of the participants assigned an equal value to each of these items. In our opinion, this makes the use of our in-kind items superior to the amount of time each participant would be willing to work for the seed, or their willingness to take on loans to pay for the seed, because each of these payment methods relies on underlying values (e.g., opportunity cost of time and discount rate, respectively) that can vary greatly across participants. This underlying variation makes it difficult to compare one person's WTW one hour with a different person's WTW one hour with cash. The same potential problem also applies to any values elicited from the WTB measure.
We consider the valuation and adoption of hypothetical improved rice varieties with yield-stabilizing traits. Drought and pest resistance are two examples of yield-stabilizing traits because in years of low rainfall or high pest load they offer protection against total crop failure.Footnote 2 These yield-stabilizing traits are typically considered to be ‘pro-poor’ because the stability they offer appeals to those who are the most impoverished and vulnerable to these types of risks. However, the traits are new technologies with uncertain benefits and risks; it is therefore unclear whether farmers will purchase these seeds and how much they are willing to pay. There are very few studies that have looked at this issue apart from Lybbert (Reference Lybbert2006).
Lybbert (Reference Lybbert2006) found that farmers in Tamil Nadu, India were willing to pay more for seeds with a higher expected yield. However, he found limited evidence that they were willing to pay more for an absence of downside risk (the third moment of a yield distribution), and no evidence that farmers were willing to pay more for more stable yields. To keep our experiment as simple as possible, we only altered yield variability but we built on Lybbert's model by including seeds that had a lower and higher variance than the baseline seed to see if producers were consistent in how they valued yield variance. This is in contrast to Lybbert who only compared seeds with a lower variance to his baseline seed.
Evaluating the ex ante WTP can inform development interventions and the pricing of new technologies. Similarly, in the environmental conservation literature, it is important to have accurate estimates of willingness-to-accept (WTA) when evaluating payments for ecosystem services (PES) programs. Typically, researchers attempt to elicit WTP or WTA using cash, but in-kind approaches have also been used (Asquith et al., Reference Asquith, Vargas and Wunder2008). Accurate estimates of WTP or WTA can be used to conduct benefit-cost analysis, and can greatly influence whether or not a service or technology is offered in the market. Until fairly recently, the type of remuneration or payment used in these experimental studies was not given much thought. However, due partly to the overall success and subsequent ubiquity of economic experiments, more situations where cash is not a feasible method of payment have arisen, and non-cash approaches must be considered. Our study is the first to compare directly WTP with cash versus in-kind items with clear and known values. Unlike Cook et al. (Reference Cook, Chatterjee, Sur and Whittington2013), using both payment methods allows us to identify the effect of payment type on bidding behavior. We also contribute to the literature on producers' valuation of ‘pro-poor’ seed traits and the adoption of improved rice varieties.
2. Conceptual model
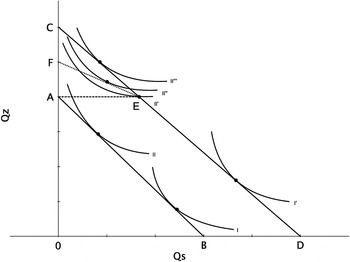
Following the example in Cunha (forthcoming), suppose that a household consumes two goods: soap (Q s ) and a composite good (Q z ). The initial budget constraint (line AB in figure 1) by which the household maximizes utility U(Q s , Q z ) is P s Q s + P z Q z =Y, where P s is the price of soap, P z is the price of the composite, and Y is the household budget constraint. A cash transfer of C increases household income to Y + C, shifting the budget constraint out to P s Q s + P z Q z = Y + C (line CD). An equivalently valued in-kind transfer of soap, however, creates a kinked budget line, the exact slope of which depends on the resale price of soap. If there is no resale, the budget line will be flat from the initial budget line's maximum quantity of the composite good, as it is not possible to increase the consumption of it (AED). If resale is possible, but there are transaction costs such that the resale price (P′ s ) is less than P s , the budget line will be kinked and the shift will be between the initial budget line's maximum quantity of the composite good and the maximum quantity of the composite possible after the cash transfer (FED). If resale is frictionless, the in-kind transfer will be equivalent to a cash transfer, and the budget lines will be parallel but shifted outward (CD).
Effect of cash and in-kind transfers on utility

Within this setup, it is possible to illustrate the difference between two types of transfers: infra-marginal and extra-marginal. Infra-marginal transfers occur if the amount transferred is smaller than the quantity consumed prior to the transfer (Skoufias et al., Reference Skoufias, Unar and González-Cossío2008). Infra-marginal transfers are equivalent to an equally valued cash transfer, as the household will not be forced to over-consume soap according to its preferences and compared to what would be consumed under an equivalently valued cash transfer. On the other hand, households that were initially consuming less soap than the transfer provides, or for whom the transfer is extra-marginal, may be forced to over-consume soap according to their preferences and depending on the resale price of soap. If resale is anything less than frictionless, households for whom the transfer is extra-marginal will find themselves at a lower indifference curve than if they had received an equal value cash transfer, because the choice of bundles has been restricted. In figure 1, the transfer is infra-marginal for household I but extra-marginal for household II, as the indifference curve I′ denotes a higher level of utility than the curve I, and utility increases from indifference curve II to II″ (i.e.,
 $U\lpar II\rpar <U\lpar II'\rpar <U\lpar II'\rpar <U\lpar II''\rpar $
). However, transfers must be binding to create distorting effects on consumption. A transfer is considered binding if there is no opportunity for resale, such that the quantity consumed is the same as the quantity that was transferred.
It is possible – even likely – that the goods we had as in-kind payments represented extra-marginal transfers to some of the participants.Footnote 3 Therefore, the utility that the participant received from the in-kind payment would be lower than the cash equivalent. If we equate a payoff that results in a lower utility with a lowering of the stakes of the experiment, then work by Holt and Laury (Reference Holt and Laury2005) and Harrison et al. (Reference Harrison, Johnson, McInnes and Rutström2005) on risk aversion suggests that the participants would make riskier decisions. In the context of our experiment, a greater propensity to make ‘riskier’ decisions is akin to a higher likelihood of adopting (or higher WTP for) the new seed varieties. Therefore, based on this conceptual model, we hypothesize that the elicited WTP using in-kind payment will be greater than or equal to the elicited WTP when cash is the method of payment. It is also possible that the participants perceive the in-kind goods as having a lower value than the posted ‘price’ in spite of our best efforts to use the real local price as a stand-in for value. However, the implications for the elicited WTP are the same: if the participants perceive the stakes to be lower, their WTP will be higher.
3. Experimental method
The experiment consisted of three key parts: (1) risk preference elicitation; (2) the seed valuation game; and (3) the survey. Data from parts 1 and 3 were used as explanatory variables in the regression analyses, while data from part 2 were used as the dependent variable in the regressions. The questions asked in parts 1 and 3 were professionally translated into the local language Oriya (also spelled Odia), and we had trained research assistants who spoke the local language assist with all aspects of the experiment. All the experiments took place at a field station operated by our local research partner that was approximately 20 km away from the village sites. The purpose of this was to avoid future situations in which the local participants would expect monetary or in-kind ‘handouts’ by creating an artificially different situation and emphasizing the uniqueness of this experience. On average, the experiment – including all instructions, practice rounds, and follow-up question and answer period – took two hours to complete. We completed two sets of experiments each day with mixed-gender groups of 9–14 participants, and provided a meal to all the participants.
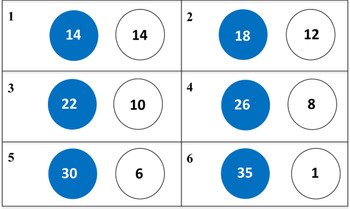
The purpose of the risk preference elicitation portion of the experiment was to establish a baseline level of risk preference. To accomplish this, we asked each of the participants to choose a gamble using the Eckel-Grossman (hereafter EG, 2002) approach. The EG approach was chosen for its simplicity and ease of use, since most of our participants have low levels of education and little familiarity with experiments. We asked participants to select one of six gambles that offered a 50 per cent chance of a high payoff and a 50 per cent chance of a low payoff (figure 2). The gambles increase in both risk and expected payoff, and the choices made by the participants were used to calculate a risk preference score from one (least risk loving) to six (most risk loving). Once the participant had chosen a gamble, the outcome was decided by drawing one of two chips (one white and one black) from a bag. We then paid the participant based on the outcome.
Visual representation of Eckel–Grossman gamble options shown to participants where numbers inside the circles represent payoffs

For the seed valuation game, we modified an approach developed by Lybbert (Reference Lybbert2006) and asked farmers to make planting decisions for a series of hypothetical farming seasons. The main difference between our setup and Lybbert's is the degree of abstraction. Harrison and List (Reference Harrison and List2004) argued that experiments that abstract greatly from reality may encourage participants to import external frames with which to interpret the experiment. This can lead to an increase in what they call ‘uncontrolled’ frames, which can confound the ‘controlled’ frames. We reduced the degree of abstractness in three ways. First, we chose rice farming as our context because the vast majority of the participants in the area engaged in this activity. Second, we framed the variance responsiveness to local abiotic stressors with which the participants were familiar. For example, we described the inclement conditions as droughts and late rainfalls since both situations represent cases where drought-tolerant varieties would thrive. The seed with the low variance distribution could then be thought of as a ‘drought-resistant’ variety. Similarly, we described the ideal conditions for the high variance seed as one in which precipitation and sunlight were plentiful and timely, fertilizers and pesticides were readily available, and labor was not an issue. However, conditions where any one of these were absent would result in below-average yields. The participants understood this to be similar to many hybrid rice varieties that were being sold. Of course, providing this additional context did not come without cost. The participants may have imported too much context and ascribed additional (and unknown to us) characteristics to each of the seeds. To mitigate this, we did not mention any specific known seed varieties by name and great care was taken to focus on the differences in yield distributions.
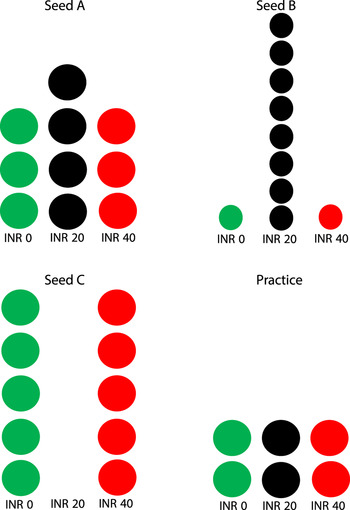
In the game, farmers were offered a chance to purchase a seed with a known payoff distribution in Indian Rupees (INR, where 1 INR = US$0.02 approximately) during each round (season). The distributions were represented using an opaque cloth bag with ten chips (green, black and red) inside. Each color corresponded to a harvest level, which in turn corresponded to a payoff in rupees: green for a bad harvest (paying 0 INR); black for an average harvest (20 INR); and red for a high harvest (40 INR). The share of each color of chips in the bag represented the likelihood of the different seed distributions. We showed a large poster depicting each of the distributions with color-coded circles that corresponded to the chips in the actual bag to facilitate understanding (figure 3). At the end of each round, a harvest was realized by randomly drawing a chip from the bag. All of the participants played an unpaid ‘practice’ round at the beginning of each game. The distribution of payoffs in the practice round was chosen to be uniform (i.e., each payoff had the same probability of occurring) to simplify matters, and the farmers were informed of this distribution.
Facsimile of poster describing distributions shown to participants where colored circles denote chips

After the distribution was explained, we used the Becker-DeGroot-Marschak (BDM) mechanism (Becker et al., Reference Becker, DeGroot and Marschak1964) to elicit participants' WTP for each seed. We randomly assigned groups to be paid cash or in-kind and we informed participants of the payment method prior to eliciting their WTP. We told the participants that the price of the seed could vary within a discrete uniform distribution of prices and that the price would be selected randomly by drawing a chip from a bag after they stated their WTP. Farmers who were willing to pay more than the price that was drawn bought the seed, and realized a harvest for the seed in that round. We calculated net earnings as the yield payoff (0, 20 or 40 INR) minus the seed cost. We described yields in monetary outcomes rather than another form of measurement (e.g., bushels of corn) for two reasons: (1) measurement units are not uniform in the region (e.g., one bag vs. one quintalFootnote 4 ); and (2) to facilitate the simplicity of the game by avoiding another step of converting the yield to a payoff.
There were three experimental seeds: baseline (Seed A), low variance (Seed B) and high variance (Seed C). The three seeds were different only in the standard deviation of their yield distribution; that is, the expected yield of all three seeds was identical as were other higher order moments. Since rice is a staple crop in this region of India, we framed the seeds as being different varieties of rice. For each seed, we repeated this process for four unpaid practice rounds and one paid ‘real’ round. Each participant valued three seed distributions, for a total of 15 rounds. During each practice round, an enumerator asked the participants questions to ensure that all the participants understood the procedures. To test for order effects, we presented the distributions in one of two sequences: ABC or ACB. Since seed A was used to provide a baseline by which to measure changes in the farmers' WTP, it was always first in the sequence. The experiment was conducted in groups of 9–14 farmers, and as mentioned earlier the payment type was randomly assigned at the group level.
At the end of the experiment, we paid participants either cash or in-kind for their earnings. It was possible to lose money in any particular round, but we informed all the participants that each person was guaranteed a minimum of 40 INR. The maximum payoff was 125 INR, which was 2.5 times the typical daily wage of 50 INR. We chose the individual payoffs to arrive at this maximum payoff for two reasons: first, 125 INR was a non-trivial amount of money and provided enough incentive for the participants to think carefully about their decisions; and second, at the same time, 125 INR was not high enough to generate tension or jealousy among the participants according to our local partners.
Following the work of Cook et al. (Reference Cook, Chatterjee, Sur and Whittington2013), participants who were paid in-kind were given vouchers that could be redeemed at the small ‘shop’ we set up at the back of the room in which the experiment was held. The vouchers were similar in shape and size to real rupee notes, though not in color or design. The shop offered a variety of commonly purchased household goods (laundry detergent, soap, biscuits and pens) at two price levels: 10 INR and 5 INR. Candies, worth 1 INR, were given as change for anything smaller than 5 INR increments, which is common practice at shops in the area. All the prices were identical to those charged in local shops.
Once the seed valuation game was completed, but prior to the handing out of the payment, each of the participants completed a survey that collected data on demographics, risk exposure perceptions, and farm management practices. These data were used as control variables in the regression analysis.
4. Empirical model
We are interested in the adoption decision and the determinants of WTP. We adapt Haab and McConnell's (Reference Haab and McConnell2002) approach for modeling WTP by incorporating the experimental design and treatments of interest. The basic model is WTP is = f(d,t,g,f,ε is ). Here, WTP is is the WTP of individual i for seed distribution s; d, t, g and f are vectors of seed dummies, treatment dummies (including payment type), game effects (e.g., outcome in previous round), and farmer characteristics, respectively; and ε is is an error term. Since the only difference between the seeds is experimentally controlled to be the standard deviations of their yield distributions, the effect of the seed dummies on WTP is is equivalent to the effect of changes in the standard deviation on WTP is .
There are three possible game effects that could have affected WTP. First, participants who did not buy the seed in a given round because the price was too high may have increased their WTP in the next round to increase their chance of purchasing the seed and ‘playing’ in the harvest game. We accounted for this by including a dummy variable play that is equal to 1 if the participant purchased a seed in the preceding round. Second, participants who experienced a low (high) harvest in a given round may have decreased (increased) their WTP in the next round. We tried to control for this game effect by including a continuous variable preearn that is equal to their earnings from the previous round. Lastly, producers who were ‘lucky’ and drew a high payment in the EG gamble bid might have bid higher in the seed valuation game if they perceived that ‘luck’ was on their side. To account for this, we added a dummy variable gamluck that is equal to 1 if the participant drew the high payment in the EG gamble.
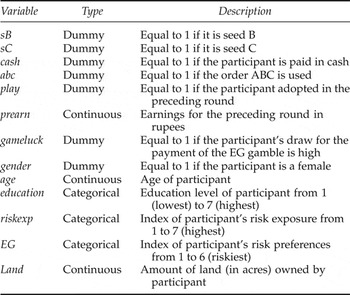
We estimated a tobit model to account for right censoring in the data (Wooldridge, Reference Wooldridge2002). Since the WTP data are top coded at 20, the observable variable WTP is equal to the latent variable WTP* whenever it is below 20 and equal to 20 otherwise. The experimental design provided panel data that can be analyzed using a random effects tobit model to correct the test statistics for individual specific effects. However, a Hausman test ignoring the censoring resulted in a rejection of the null hypothesis (p = 0.0002), suggesting that the random effects model may be inappropriate (Verbeek, Reference Verbeek2008). Consequently, the data were pooled and we focused on estimating a pooled tobit with standard errors adjusted for clustering at the group level. We estimated the following econometric model: WTP is * = β0 + β1 sB s + β2 sC s + β3 cash i + γ G + δ X + ε is , where G and X are vectors of game effects and farmer characteristics, respectively. If the type of payment has no effect on WTP, then the coefficient β3 should be statistically indistinguishable from zero. The explanatory variables are described in table 1.
Descriptive statistics

5. Study area and data
The study sites were 10 randomly selected villages in the Koraput district of Odisha in India. Koraput is relatively isolated due to its mountainous location. It is also one of the poorest districts in Odisha, which itself is one of the poorest states in India. The district depends heavily on agriculture, most of which is on a small scale with little mechanized machinery. The average land productivity in Koraput is 1,477 INR per hectare compared with a state average of 6,317 INR per hectare (Shah et al., Reference Shah, Nayak and Das2008). The major agricultural crop is rice, which has undergone many changes in the past few years with the introduction of hybrid varieties. According to the producers we spoke with, these new varieties perform poorly compared with the traditional varieties under inclement weather; they also require larger amounts of purchased inputs, such as fertilizers. However, the producers in Koraput were essentially growing only hybrid varieties as they provided significantly higher yields under the right conditions.Footnote 5
We had 185 farmers participating for a total of n = 555 (185*3) observations. However, of the 555, we discarded 138 observations (or 46 farmers) because of inconsistencies in collection methods that could result in measurement error, leaving a total of 417 observations (139 farmers). The sample consisted of 38 per cent males (n = 159) and 62 per cent females (n = 258). Eleven per cent of the males who participated said that they were not the primary decision maker regarding crop choice and planting. In contrast, 53 per cent of the females in our sample stated that they were not the primary decision maker.Footnote 6 In all cases, however, the participant had extensive experience with rice farming.
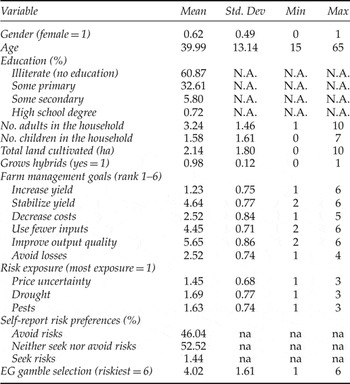
We collected data on the participants' sociodemographics (e.g., age and education), the participants' household characteristics (e.g., number of adults in the household and land holdings), and the participants' farm management goals (e.g., increase or stabilize yield), risk exposure (e.g., drought and price risk), and risk preferences (e.g., risk-seeking or risk-avoiding). Table 2 shows the descriptive statistics. Some notable figures from table 2 are that the three most important management goals were to increase yields, stabilize costs, and avoid losses. Although not reported in this table, 87 per cent of producers selected ‘increasing yield’ as their most important management goal. In contrast, having stable yields was only the fifth or sixth most important management goal. Similarly, while most of the participants self-reported that they were either risk-averse or risk-neutral, their selections from the EG gamble choice – which was designed to measure the nature of risk aversion – showed that they preferred the risk-loving choices.
Description of variables used in empirical analysis

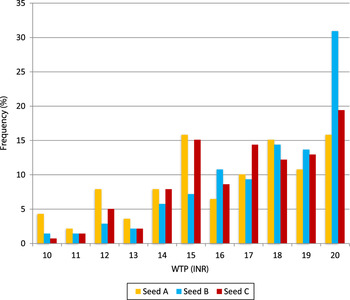
WTP ranged from 10 INR to 20 INR. The values tapered off as would be expected on the left side towards 10, but they increased in density towards 20 at which point they were top-coded. This is, admittedly, a weakness of the data collection method but we have no a priori reason to think that this top-coding had a different effect on the bids for one payment type over another. In addition, a bid of 20 INR represented a 100 per cent increase over the prices charged for seeds at the local panchayat (government) office. Substantially higher bids than 20 INR are highly unlikely. There were also no zero bids in the data. There are several explanations for the absence of zero bids: (1) as in Lybbert (Reference Lybbert2006), when we asked farmers about a zero bid, they reported that they had to plant something every year or they would not have a harvest, so being unwilling to pay anything seemed illogical to them; and (2) prices for subsidized seeds available through the panchayat office were 10 INR (per kg), so a price lower than this was inconceivable. Figure 4 shows a histogram of WTP by seed variety.
Distribution of willingness-to-pay for seed varieties

6. Results
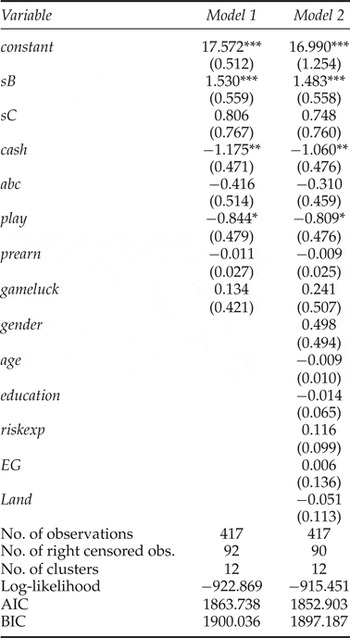
We report results (table 3) for two models: model 1 does not account for farmer characteristics while model 2 does. The coefficient for sβ is positive and significant (p < 0.01) in both models, indicating that farmers are willing to pay a premium of 1.53 INR, or about 9 per cent, for the yield-stabilized distribution. This is contrary to Lybbert's (Reference Lybbert2006) findings that there is no statistical difference between the WTP for the baseline and stabilized distributions. This is the finding that we expected, and offers some evidence to the idea that farmers are willing to pay more for ‘pro-poor’ traits such as yield stability. The only game effect variable that is statistically significant is play, and it is significant in both models. The negative coefficient on play implies that farmers have a lower WTP if they adopted (i.e., bid a price that exceeded the randomly drawn price and therefore ‘purchased’ the seed) in the preceding round. This negative effect may also be explained in part by the possibility of real losses in the fifth – and final – round of the game. It is also possible that the consequences of the real losses are more salient to the adopters of the preceding round when they had just realized a harvest. Even though model 2 is preferred based on the values of the log-likelihood, AIC and BIC, none of the farmer characteristics that we added in model 2 is statistically significant. Results from a Wald test on a restricted version of model 2 do not allow us to reject the null hypothesis that the additional explanatory variables are equal to zero.
Results of pooled Tobit regression with clustered standard errors

Notes: Clustered standard errors in parenthese.
* p < 0.1; ** p < 0.05; *** p < 0.01
Our main result is that farmers are willing to pay less when they are paid cash than when they are paid in-kind. This result is statistically significant at the 5 per cent level and is robust across both specifications. If we assume that the valuation elicited under cash compensation is the ‘true’ valuation, this means that in-kind remuneration can result in overestimation. Bids are higher by 1.18 INR when farmers are paid in-kind, corresponding to about a 7 per cent higher valuation. While this is a small amount of money in absolute terms, it is not necessarily a trivial amount as many of these farmers operate on very small or non-existent profit margins. We estimated other specifications where we included several interaction terms (e.g., seed order and sociodemographic variables), and found the same negative and statistically significant coefficient on cash.Footnote 7
7. Conclusions and discussion
To the best of our knowledge, this study is the first to compare directly the effects of in-kind and cash payment on participants' WTP for a market good in an experimental setting. There are a few possible explanations for the difference in WTP between payment types. First, the in-kind payments that we offered may have been extra-marginal transfers. Second, the goods we offered were household goods that would likely be shared among family members, which, if we assume cash is not as likely to be shared, may have led to different incentives. Relatedly, participants may have valued the goods less than an equivalent value of cash, resulting in a perceived lowering of the game stakes. However, perceived differences in value would likely be minimal as the original value of the goods was already fairly low (10 INR maximum) and their values well known.
We find much smaller differences in WTP between cash and in-kind than Abramson et al. (Reference Abramson, Becker, Garb and Lazarovitch2011) found when they compared demand for water services using cash (WTP), loans (WTB) and labor (WTW). They found that WTB and WTW payment methods resulted in valuations 100 per cent or greater compared with cash payments. We believe this is mainly due to the potentially large heterogeneity across individuals with respect to discounting and opportunity costs, among other things. This variation makes it more difficult to compare WTB and WTW with cash-based WTP valuations. Our in-kind items, on the other hand, were chosen to minimize differential valuations by our participants. In spite of this, we still find statistically significant – albeit small – differences in WTP between in-kind and cash.
The main limitations of this study are: the relatively high proportion of data points that were discarded due to inconsistencies in the collection methods; the experimental design that ensured net earnings were always positive; the absence of distributions that differed in expected payoffs; and the limited number of in-kind goods. We tried to ensure that the data were collected in a consistent and accurate manner and, to ensure the integrity of the overall data set, we had to remove a sizable share of the data. We believe that the data set we ended up using was representative of the overall sample based on the characteristics of the full and selected data set. We could have designed an experiment that yielded net losses to the participants but this would have been unethical to subject to a group of farmers living at or below the poverty level. While the possibility of losses would have added an additional element of realism, this was never under serious consideration. We originally designed an experiment in which we varied the first two moments of the payoff distribution but chose to focus on only the second moment to keep the experiment as simple as possible. However, it would be interesting to see if differences in WTP extend to distributions where expected yields vary. Finally, we chose a small number of products to use as in-kind payments by design, and we acknowledge that having a wider range of goods would have further mitigated the likelihood of extra-marginal transfers. This could have reduced or even removed any differences in WTP between in-kind and cash. However, it would have added an element of ambiguity with respect to each participant's private valuation of the good if some of the items were unfamiliar or not consumed by all of the participants. One additional limitation is related to the timing of our experiment. Koraput district suffered from drought-like conditions in 2012 due a late monsoon, and it is possible that this recent event had an impact on the decision making of the participants involved. However, climate change scientists predict that drought conditions may become more prevalent in the future, so it is also possible that these recent events are more representative of future conditions.
Our results imply that researchers working with partners in less developed (or developed) countries who are asked not to use cash payments should consider the effects of in-kind payment and the possibility of overestimation carefully, as it may affect the interpretation and comparability of their results. The choice of in-kind items used in lieu of cash can potentially have a large impact on WTP, and we argue that it is important to choose in-kind items whose values are fairly homogeneous across participants. Our results are applicable not only to WTP studies, but to all economics experiments in which remuneration is offered, such as dictator or trust games.