I. INTRODUCTION
Microwave radiation is used extensively for materials processing. Examples includeReference Clark and Sutton1,Reference Zhou, Yan, Zhang, Zhou, Pu and Hu2 food processing, chemical syntheses, medical treatments, sintering of ceramics, vulcanization of rubber, curing of epoxy resins, and fiber-reinforced epoxy composites, and even waste remediation. In many cases, microwave processing is advantageous because it requires less energy and/or is more rapid than conventional thermal processing.
It has been shownReference Craven, Cripps and Viney3 that silk fibers can impart useful reinforcement to an epoxy matrix. Thus, situations may arise in which silk is intentionally subjected to microwave exposure while serving in a fiber-reinforced composite. For example: (i) microwave radiation may serve as a means for curing the composite during manufacture, and/or (ii) the composite may be considered for use in an environment—such as an aircraft radome—where it is exposed to significant microwave radiation. In such cases, degradation of silk mechanical properties resulting from microwave exposure would be undesirable. Changes to the mechanical properties of silk as a result of microwave exposure are therefore worth investigating, because they will directly affect decisions about the conditions under which silk may be processed and/or used as an engineering material.
A 2004 studyReference Morrison, Bell, Beautrait, Ritchie, Smith, McEwen, Viney, Aizenberg, Orme, Landis and Wang4 indicated that microwave radiation enhances many of the mechanical properties of Bombyx mori silkworm cocoon silk and Nephila clavipes spider major ampullate silk. However, there was no attempt to standardize the conditions under which samples were stored prior to testing.
We have recently proposed a reproducible test protocol for investigating silk mechanical properties in general, and the effects of microwave radiation on silk mechanical properties in particular,Reference Reed, Viney, Nolte, Shiba, Narayan and Nolte5 that takes into account the sensitivity of silk to ambient storage conditions.Reference Reed, Bianchini and Viney6 Here, we broaden and refine the investigation with additional data and analyses from tensile tests performed on microwave-irradiated silk:
(i) We address mechanical properties individually (yield stress, yield strain, breaking stress, breaking strain, Young's modulus, toughness), as well as stress relaxation behavior, as a function of microwave exposure time.
(ii) Samples used in each comparison are selected to have similar diameters and a consistent color, to minimize possible contributionsReference Reed, Bianchini and Viney6 from these variables.
(iii) We use nonparametric statistical tests—which do not assume a particular type of distribution for the data—to inform our decisions about whether any perceived effects of microwave radiation are in fact significant.
(iv) We use Weibull statistics to investigate how the predictability of fiber failure is affected by microwave radiation.
II. EXPERIMENTAL DETAILS
A. Microwave oven calibration
A Panasonic microwave oven (“The Genius Premier,” Model No. NN-S969BA, Danville, KY) equipped with a rotating turntable was used as the microwave source in all experiments. The apparent output power (P) of the microwave oven was calibrated by heating a known volume of water (V) for a given time (t), measuring the resulting temperature change (ΔT), and performing a simple calculationReference Knight7 as follows:
 $$P = (\Delta T)Vc{\rm{\rho }}/t\quad ,$$
where c and ρ respectively are the specific heat and the density of water. To obtain P in watts (J/s), ΔT was measured in °C, t in seconds, and V in milliliters; we used c = 4.18 J/(g·K) and ρ = 0.997 g/mLReference Reed8 and assumed that both were constant within the temperature range of our experiments.
For all calibrations, 1 L of water was used in a 2 L beaker, and the microwave exposure times were between 5 and 60 s. Because more heat is lost from the water as microwave time progresses, a plot of P versus microwave exposure time will have a small negative slope. Therefore, we extrapolate back on the plot to small microwave run times (when heat losses are negligible) for a true estimate of the oven's power. A full description of the process can be found elsewhere.Reference Reed, Viney, Nolte, Shiba, Narayan and Nolte5,Reference Reed and Viney9 All calibrations were performed after the microwave oven magnetron was “warmed up”Reference Login, Leonard and Dvorak10 by running it for 180 s with a 1 L beaker of water inside.
B. Silk collection
Bombyx mori silkworm cocoons were degummed by boiling individually in ∼1 L of water for 30 min. The cocoon was then removed from the beaker and allowed to cool. While still wet, lengths of silk were gently teased from the cocoon, using tweezers and gloved hands. All silk was collected in this way by the same person, and care was taken to avoid unnecessarily straining the fibers during collection. If resistance increased noticeably while pulling on a fiber, scissors were used to cut that fiber from the cocoon without applying further stress. If necessary, the collected fibers were subsequently cut into shorter lengths (approximately 70 mm), which were taped onto black cardstock frames for storage. In figure captions throughout this paper, the color of the cocoon from which silk was collected is noted. The possible (but practically small) influence of color on the mechanical properties of silkworm silk is discussed elsewhere.Reference Reed, Bianchini and Viney6
C. Microwave exposure
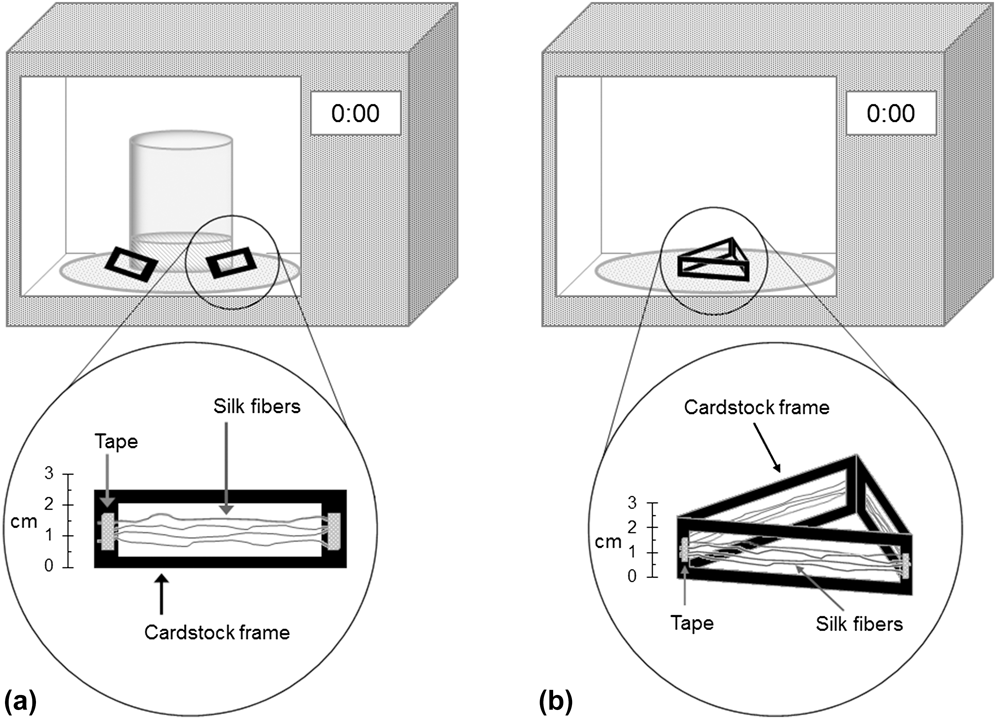
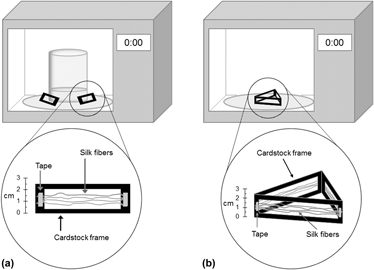
The microwave oven power level was set to 100%, which corresponds to 788 ± 12 W according to our calibrations (based on 18 measurementsReference Reed and Viney9). For some experiments (identified explicitly below), a 200 mL “load” (or “sink”) of water was included in the oven, in a 2 L beaker centered on the turntable. The beaker was covered with a layer of household plastic wrap to minimize humidity changes in the oven. This water load was introduced as a precaution to protect the magnetron from potentially damaging build-up of microwave energy inside the oven.Reference Zhou, Yan, Zhang, Zhou, Pu and Hu2 The cardstock frames with silk attached were positioned to lean against the beaker, so that the lengths of silk were only in contact with air, approximately 1 cm above the glass turntable [see Fig. 1(a)]. After every minute of microwave exposure, the water load was replaced with a fresh 200 mL of water at room temperature.
Schematic representation of silk fibers ready for exposure to microwave radiation: (a) with a water load included in the microwave oven as a sink for microwave radiation, and (b) without such a water load.

Experiments were also conducted without a water load, initially as a control to determine whether the presence of the water had an effect on the results; recalibration of the oven confirmed that there was no detrimental effect on the power output. Cardstock frames supporting samples that were microwaved without including a water load were placed in a triangular configuration around the center of the turntable [Fig. 1(b)], so that again the silk was approximately 1 cm above the glass. Microwave set time was either 30 or 60 s, as noted throughout.
After each microwave burst, the turntable was cooled back to approximately ambient temperature if it had become warm.
D. Storage conditions
Degummed fibers were stored at ambient conditions overnight. After microwaving (but prior to tensile testing), all samples were stored over a silica gel desiccant in an airtight plastic container. The samples on their cardstock frames rested on paper that separated them from direct contact with the desiccant.
E. Diameter measurements
Each silk sample was glued across a rectangular hole onto its own black cardstock support for diameter characterization and subsequent mechanical testing. The length of the hole (55 mm) was dictated by the punch size used in preparing the cardstock supports, and corresponds directly to the gage length in subsequent mechanical tests. Since the gage length used in silk research varies throughout the literature,Reference Viney, Prorok, Barthelat, Korach, Grande-Allen, Lipke, Lykofatitits and Zavattieri11 we chose to use a readily available commercial product (Fiskars brand “Leave it to Weaver” border punch) that can also be acquired easily by other researchers.
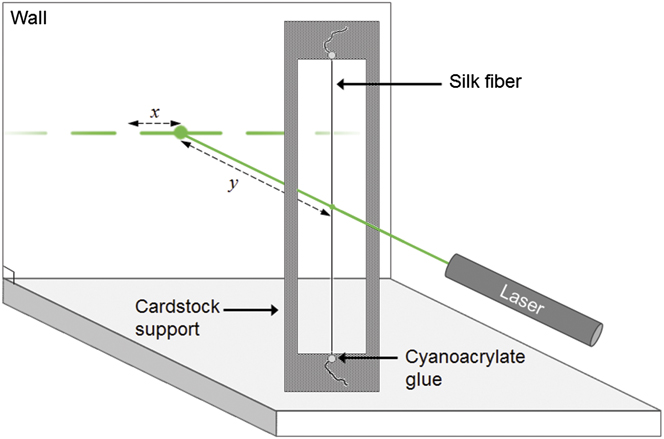
Fraunhofer diffraction of green light from a laser pointer (RadioShack®, Fort Worth, TX, cat. no. 63-132, wave length λ = 532 ± 10 nm) was used to measure the apparent diameter d of samples:
 $$d = {\rm{\lambda }}/\sin [{\tan ^{ - 1}}(x/y)]\quad ,$$
where y (= 1 m) is the distance from the sample to the wall on which the diffraction pattern was viewed; x is the distance from the direct beam to the first dark band in the pattern (Fig. 2).
Schematic representation of Fraunhofer diffraction used to measure the apparent diameter d of samples.
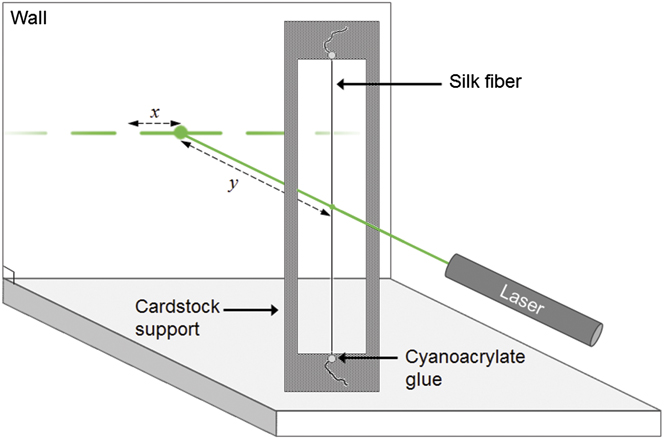
Silk fibers typically have a non-circular cross section,Reference Viney12 suggesting that several diameter measurements at different angles of fiber rotation ought to be made to determine an average diameter. However, since the diameter varies along the length of the fiber, and the fibers are also twisted, the averaging that is achieved by taking several measurements along the length of the fiber will be equivalent to the averaging obtained by taking several measurements at different angles of rotation. Furthermore, each measurement is itself already an average over a length of fiber equivalent to the spot size of the laser. Thus, for each fiber, 8 measurements of x were taken at approximately equally spaced intervals along the sample length, and averaged for use in Eq. (2).
It is worth noting that our degumming treatment is not harsh enough to achieve a complete removal of sericin (but minimizes the possibility of damage to the fiber and a degradation of mechanical properties). The diameter measurements therefore will slightly overestimate the diameter of the fibroin component of the fibers. However, this overestimate will be consistent for all of our samples, and thus will not interfere with comparisons made between different sample groups.
F. Mechanical tests: Stress–strain
Samples on their cardstock supports were mounted vertically into a 3369 Instron Tensile Tester equipped with a 0.5 N cantilever load cell (Model S-100, Strain Measurement Devices Ltd., Bury-St-Edmunds, UK). Prior to the start of each test, both sides of the support were cut, so that all of the force during the test was transmitted through the silk fiber. The gage length was 55 mm, and the crosshead speed was 0.275 mm/min, corresponding to a nominal strain rate of 0.005 min−1 (or 8.33 × 10⁻⁵ s−1).
Load versus extension data were collected via Instron's Bluehill® 2 software. Microsoft Office Excel was used to rescale and plot the data in terms of nominal stress and nominal strain, and to calculate numerical values of mechanical properties. The yield point (εy, σy), was determined by visual inspection of the stress–strain graph, using a conventional 0.2% strain offset yield criterion: a line was extended upwards from 0.002 on the strain axis, parallel to the initial linear region of the graph, to intercept the data at the point (εy, σy).
G. Mechanical tests: Stress relaxation
Prior to each stress relaxation test, εy was found by performing a constant strain rate tensile test on silk fiber taken from the same cocoon as the material to be used in the stress relaxation test. Next, a 55 mm gage length sample was elongated at a rate of 0.275 mm/min (unless otherwise noted) to an extension of 0.6εy. Time dependent load was then measured at that fixed elongation for 1200 s and re-scaled to obtain stress relaxation data.
H. Statistical methods
We used nonparametric statistical tests to decide whether significant differences exist in particular properties when comparing sets of data from different levels of microwave exposure.
When sample sizes are small (less than 30), and when it cannot necessarily be supposed that data are normally distributed, nonparametric statistical tests are more appropriate than parametric ones such as a t-test.Reference Sullivan13 In the case of silkworm silk, there are many systematic (i.e., non-random) contributions to the measured mechanical properties—for example, the variable draw ratio imposed by motion of the silkworm's head during spinning. Therefore, it would not be appropriate to assume that our data come from a normal distribution. We have previously tested some of our silk data for normality by constructing normal probability plots (not shown here), and in several cases our data failed these tests; thus we turn to nonparametric (Kruskal–Wallis and Mann–Whitney) tests. For comparison with the nonparametric test results, we also provide the conventionally calculated average, standard deviation (SD), and coefficient of variation (CV) with each set of data.
III. RESULTS AND DISCUSSION
A. Effect of microwave exposure times on B. mori silk tensile properties
Figure 3 shows comparison plots of properties measured from silk fibers that received three different levels of microwave exposure. Twelve samples were tested to breaking (four from each level of microwave exposure). Fiber diameters in the three groups were comparable (11.6 ± 2.5 μm), and so were the testing conditions (20.7 ± 0.6 °C, 41 ± 2% relative humidity). All samples were collected from the same white cocoon. Silk was microwaved in 60 s bursts, with a 200 mL water load present in the oven.
Comparison of tensile properties of silk samples collected from a single white cocoon and microwaved for 20, 30, or 40 min. The conventionally calculated mean ( $\bar x$) ± SD is given below each set of samples (in the same units as the plotted data), along with the CV.
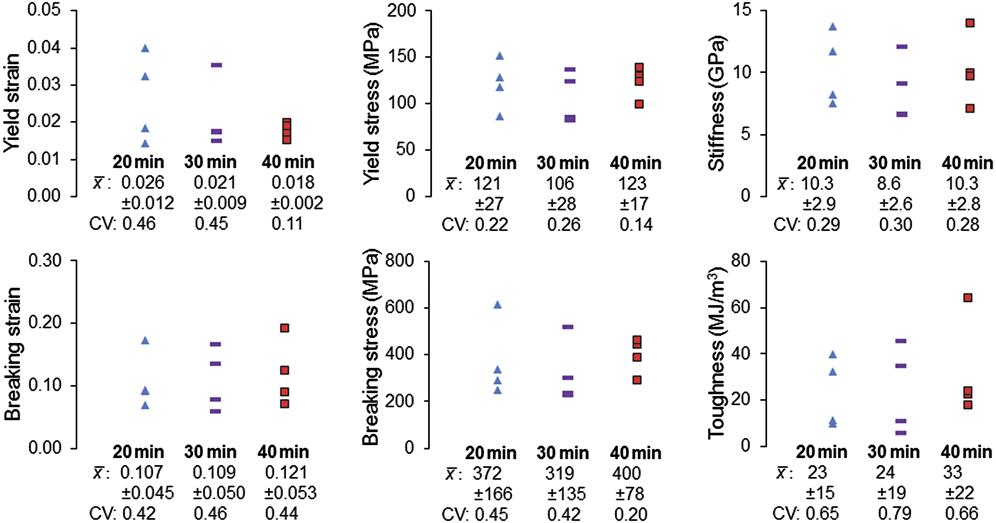
Results from the three different levels of microwave exposure were compared using a Kruskal–Wallis nonparametric statistical test.Reference Sullivan13 At the 90% confidence level, there were no significant differences between the three groups for any of the properties represented in Fig. 3.
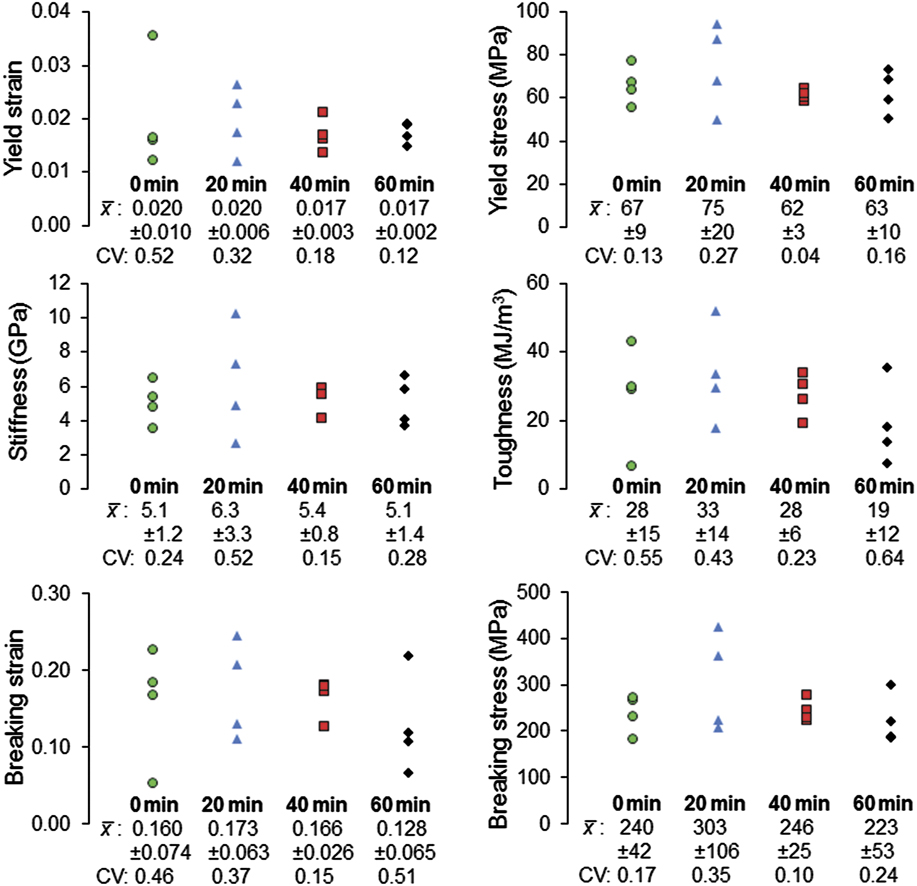
The experiment was repeated with silk from a different (yellow) cocoon, covering a wider range of microwave exposure times: 0, 20, 40, and 60 min of cumulative microwave exposure. Figure 4 shows the experimental results. Fiber diameters were again comparable between groups (17.2 ± 3.5 μm), as were testing conditions (23.0 ± 0.6 °C and 42 ± 4% relative humidity).
Comparison of tensile properties of silk samples collected from a single yellow cocoon and microwaved for 0 min (6 samples), 20 min (5 samples), 40 min (6 samples), and 60 min (5 samples). The conventionally calculated mean ( $\bar x$) ± SD is given below each set of samples (in the same units as the plotted data), along with the CV.
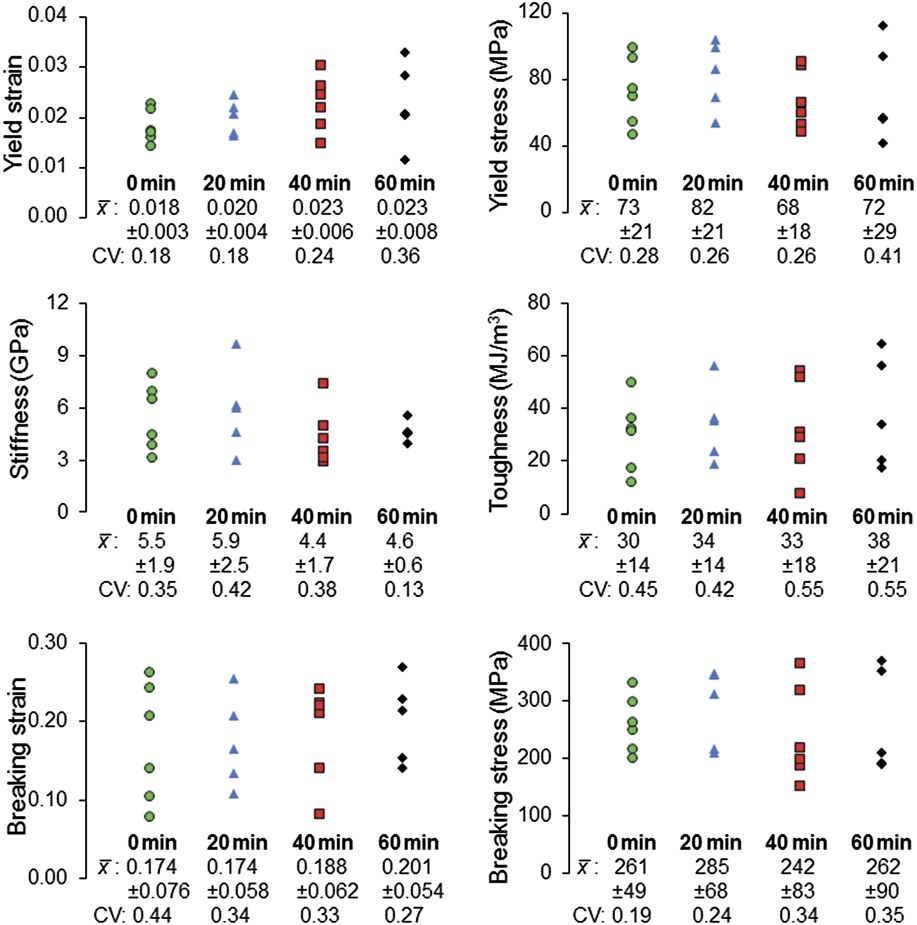
Once again, when a Kruskal–Wallis test is used to compare results from the different levels of microwave exposure, no significant change is observed in any of the tensile properties (at the 90% confidence level).
Our initial attempts to reproduce the microwave effect reported previouslyReference Morrison, Bell, Beautrait, Ritchie, Smith, McEwen, Viney, Aizenberg, Orme, Landis and Wang4 were unsuccessful under the prevailing conditions of our lab (Figs. 3 and 4). Factors leading to the differences in results between our experiments reported here and those in which a microwave effect was observed may include:
(i) Microwave irradiation conditions: in the experiments summarized in Figs. 3 and 4, a water load was included in the microwave oven—a precaution not taken during the previous study.Reference Morrison, Bell, Beautrait, Ritchie, Smith, McEwen, Viney, Aizenberg, Orme, Landis and Wang4
(ii) The power output of the microwave oven was not measured in the previous study,Reference Morrison, Bell, Beautrait, Ritchie, Smith, McEwen, Viney, Aizenberg, Orme, Landis and Wang4 so there is no way to tell if the radiation levels in our experiments are comparable.
(iii) Tensile testing conditions: the gage length of our samples was 55 mm, versus 100 mm in the previous study.Reference Morrison, Bell, Beautrait, Ritchie, Smith, McEwen, Viney, Aizenberg, Orme, Landis and Wang4
(iv) Ambient conditions during the experiments: humidity and temperature are known to affect the behavior of many silks,Reference Fu, Porter and Shao14–Reference Savage, Guerette and Gosline20 and the ambient conditions in our laboratory (Merced, CA) tend to be warmer and drier than those reported in the original study (Edinburgh, Scotland).
While we have no way of achieving the precise ambient conditions that existed in the original study, we have attempted to address (iv) already by at least standardizing our own storage conditions: all samples in the present study were kept in the same desiccating environment prior to mechanical tests, and the temperature and humidity were recorded each day that tensile tests were performed. While our samples had a shorter gage length than those in the original study (due to the size of the punch that we used for making the cardstock supports), we ensured that the strain rate during tensile tests was the same. Thus, (iii) is an unlikely source of the different results obtained from the current study and the previous4 one. We therefore turned our attention to (i) (microwave irradiation conditions), and performed additional experiments accordingly.
B. Effect of water load on microwave absorption by B. mori silk fibers
One possible explanation for having no significant effect of microwave radiation in the data presented in Figs. 3 and 4 is that the water load included in the oven may have inadvertently dominated microwave absorption. We therefore performed a set of experiments with no water load in the microwave oven for comparison (Fig. 5). In addition, we reduced the duration of individual microwaving bursts from 1 min to 30 s, in keeping with the 2004 study.Reference Morrison, Bell, Beautrait, Ritchie, Smith, McEwen, Viney, Aizenberg, Orme, Landis and Wang4 Sample diameters from different groups were comparable: 16.5 ± 3.2 μm. Ambient conditions at the time of testing were similar for all groups: 23.0 ± 1.2 °C, 52% ± 4% relative humidity.
Comparison of tensile properties of silk samples collected from a single yellow cocoon and microwaved for 0, 20, 40, and 60 min (4 samples in each case). No water load was included in the microwave oven. The conventionally calculated mean ( $\bar x$) ± SD is given below each set of samples (in the same units as the plotted data), along with the CV.
When a Kruskal–Wallis test is used to compare results from the different levels of microwave exposure, no significant change is observed in any of the tensile properties (at the 90% confidence level).
We performed an additional property comparison in the form of stress relaxation tests, to check whether the microwave effect reported previously for stress relaxationReference Morrison, Bell, Beautrait, Ritchie, Smith, McEwen, Viney, Aizenberg, Orme, Landis and Wang4 was repeated in our data. Our results, from experiments performed on samples selected from the same batches of silk as represented in Fig. 5, showed no significant dependence on microwave exposure (Fig. 6). Comparison was based on the normalized load at the end of the experiments, using a Kruskal–Wallis test at the 90% confidence level. Ambient temperature and humidity at the time of stress relaxation testing were comparable between sample groups (23.4 ± 0.8 °C and 51% ± 3% relative humidity), and so were sample diameters (14.5 ± 2.8 μm).
Stress relaxation in silkworm cocoon silk with 0, 20, 40, and 60 min of microwave exposure. No water load was included in the microwave oven. Two samples were tested at each level of microwave exposure. The conventionally calculated mean ( $\bar x$) ± SD of the normalized stress at the end of the test is given in each case, along with the CV. The horizontal broken line was obtained from carbon fiber (a material highly resistant to stress relaxation), demonstrating that the relaxation behavior observed with silk is not an artifact of the equipment used to perform the tests.

Since different microwave exposure times in the absence of a water load did not lead to significant changes in any of the measured mechanical properties, we conclude that microwave absorption by the water load did not affect the outcome of the experiments summarized in Figs. 3 and 4. We reiterate that subsequent recalibration of the power output confirmed that the microwave oven was not damaged by operation without the water load.
C. Effect of strain rate on the apparent tensile properties of B. mori silk fibers
One of the effects of microwave radiation reported previouslyReference Morrison, Bell, Beautrait, Ritchie, Smith, McEwen, Viney, Aizenberg, Orme, Landis and Wang4 was a decrease in stress relaxation when compared to samples that had not been microwaved. Samples that had not been microwaved relaxed to a normalized stress of 0.69 after 1200 s, compared to 0.87 for microwaved samples (values approximated from Fig. 1 of Ref. Reference Morrison, Bell, Beautrait, Ritchie, Smith, McEwen, Viney, Aizenberg, Orme, Landis and Wang4).
Our results presented in Fig. 6 show samples (regardless of microwave exposure time) relaxing to a normalized stress of approximately 0.6 on average. Because our samples, tested under local ambient conditions, relaxed more than those reported previously, we wondered if the effects of microwave exposure were masked in our experiments by an ability of the samples to relax during the ramping step. Therefore, an additional experiment was performed in which the ramp rate to establish the initial load was doubled to 0.550 mm/min (corresponding to a strain rate of 1.67 × 10⁻⁴ s−1), to reduce the ability of samples to relax during the elongation step.
Figure 7 shows the results of stress relaxation tests performed on samples deformed at the higher strain rate; the silk was taken from the same white cocoon as the samples represented in Fig. 3. Microwaving was carried out in 30 s bursts, and no water load was included in the microwave oven. Ambient temperature and humidity during testing were 23.1 ± 0.3 °C and 43% ± 5%, respectively.
Stress relaxation in silkworm cocoon silk with 0 min (4 samples) and 20 min (9 samples) of microwave exposure. Initial ramp rate was doubled relative to the tests plotted in Fig. 6. The conventionally calculated mean ( $\bar x$) ± SD of the normalized stress at the end of the test is given for each batch of silk, along with the CV. The horizontal broken line was obtained from carbon fiber.
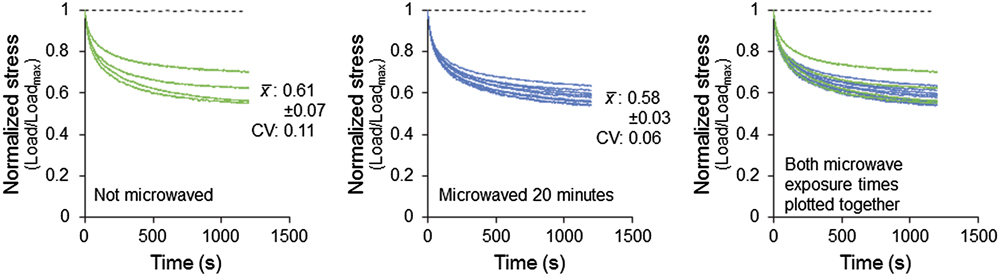
A statistical comparison between samples that were microwaved and those that were not was made with a two-tailed Mann–Whitney test at the 90% confidence level. The normalized loads at the end of the tests were not significantly different in the two groups. Moreover, the normalized load at the end of the tests was still approximately 0.6.
Since doubling the ramp rate in stress relaxation tests still revealed no significant effects of microwaving, tensile tests to failure (which generally occur over a longer time scale) were not carried out at the increased strain rate. Over the course of a tensile test to failure, samples would have even more time to relax away from any microwave induced changes, so we expect that such a test would not provide additional information.
D. Effect of microwave radiation on the failure predictability of B. mori silk fibers
While we observe no statistical change in any mechanical property as a function of microwave exposure time, the possibility remains that the spread of the property values may have been affected by microwave exposure. Practically, a change in the spread of the data translates to a change in the predictability of failure—in other words, a measure of the reliability of the material. To quantify the failure predictability, we use Weibull statistics, in line with previous studies performed on silk.Reference Pérez-Rigueiro, Viney, Llorca and Elices21,Reference Zhao, Feng and Shi22 Using the two parameter Weibull distribution,Reference Abernethy23 the probability of fracture at stress σ is given by:
 $$F({\rm{\sigma }}) = 1 - e{\,\^\,\,}{}[ - ({\rm{\sigma }}/{\rm{\eta }}){\,\^\,\,}{\rm{\beta }}]\quad ,$$
where β is the Weibull modulus (also known as the shape parameter of the distribution) and η is the scale parameter (equivalent to the stress at which 63.2% of samples will have fractured). The distribution function can be rearranged so that the data can be plotted as a straight line (if indeed the data belong to a Weibull distribution):
 $${\rm{ln}}\,{\rm{ln\{ 1/[1}} - F{\rm{(\sigma )]\} }} = {\rm{\beta\; ln(\sigma )}} - {\rm{\beta \;ln(\eta )}}\quad {\rm{,}}$$
Here, ln ln {1/[1 − F(σ)]} is plotted as the vertical axis, and ln (σ) as the horizontal axis. Then, β can be read from the plot as the slope. A higher Weibull modulus corresponds to more predictable behavior. To calculate the probability of failure F(σ), the breaking strengths are first ranked from the smallest to the largest. Then, for the ith of n samples, we used the median rank approximation [Eq. (5)], as this has been deemed more appropriate than other methods.Reference Fothergill24
 $$F({\rm{\sigma }}) = (i - 0.3)/(n + 0.4)\quad .$$
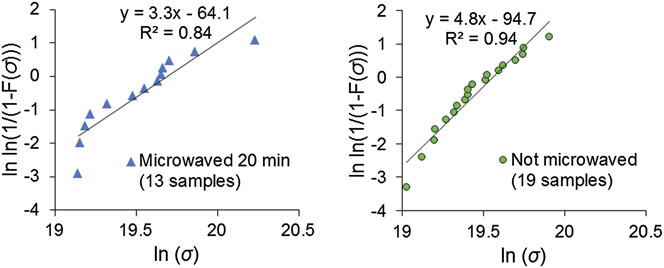
Figure 8 shows the comparison between the Weibull plots of silk with 20 min of cumulative microwave exposure, and of silk that had not been microwaved. When a straight line is fitted to the data, the plots show that β decreases from 4.8 to 3.3 upon microwaving, suggesting that microwave exposure decreases the failure predictability of silk. We note however that, especially in the case of the microwaved silk, the data do not fit well to a straight line; also, the number of samples in the microwaved set is small (13 samples, compared to the recommendedReference Abernethy23 minimum of 21), so confidence in the estimated value of β should be limited.
Weibull plots constructed with the breaking strength of (a) samples with 20 min of microwave exposure, and (b) samples that had not been microwaved.
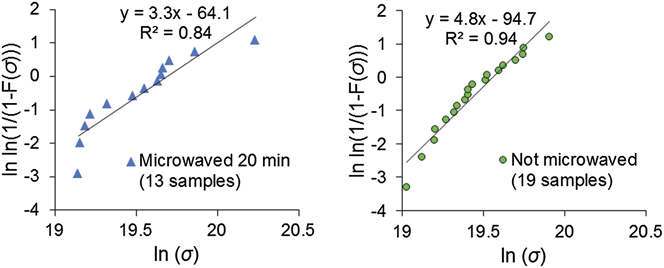
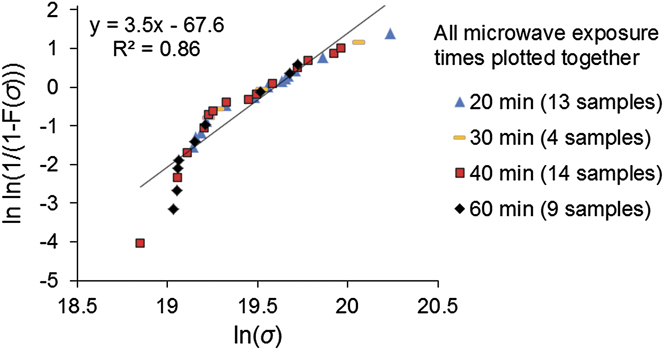
Since our comparisons of mechanical properties (Figs. 3–7) revealed no differences between any of the microwave exposure times, we compiled an additional plot (Fig. 9) with data from all the microwaved samples (40) combined. While this plot confirmed the decrease in the Weibull modulus (β = 3.5) in response to microwaving, it also confirmed that the nonlinearity was not a simple random consequence of working with a small data set. Nonlinearity in a Weibull plot can indicate that a mixture of failure modes is present.Reference Abernethy23 At least two different slopes are apparent in the Weibull plot of Fig. 9, suggesting that at least two failure mechanisms may be active in the silk fibers that we tested.
Weibull plot constructed with the breaking strengths of samples that had been microwaved for 20–60 min.

Previous studies have noted that mechanical behavior depends on sample diameterReference Zhao, Feng and Shi22,Reference Porter, Guan and Vollrath25,Reference Zhao, Feng, Cui and Zou26 as well as sample volume,Reference Viney, Prorok, Barthelat, Korach, Grande-Allen, Lipke, Lykofatitits and Zavattieri11 but the presence of two distinct slopes (as opposed to a curve with a continuously decreasing slope) in our combined Weibull plot suggests that these contributions alone may not be sufficient to explain the results we observe.
Molecular dynamics simulations have shownReference Keten, Xu, Ihle and Buehler27 that the failure mechanism of beta-sheet nanocrystals in silk depends on the size of these nanocrystals. Larger nanocrystals fail by a bending mechanism, in which hydrogen bonds break one at a time as bending progresses. Smaller nanocrystals fail by a shearing mechanism that allows hydrogen bonds to act collectively in conferring resistance to deformation, so that the small crystals are stronger and tougher than the larger ones. These simulations may provide insight into our Weibull plots. Low breaking strengths (which are associated with a higher Weibull modulus; Fig. 9) may correspond to fibers in which the response is dominated by larger beta-sheet crystals; the crystals break at a relatively predictable stress level, because hydrogen bonds only break one at a time in each nanocrystal. Higher breaking strengths may correspond to silk with small beta-sheet crystals; the stress at which these fibers break is less predictable, because it will depend on how many hydrogen bonds are present within each layer of the nanocrystal to support shear loading. Also, nanocrystals in which multiple hydrogen bonds have to break simultaneously will require a minimum threshold of stress to trigger failure, corresponding to the stress at which we observe the change in slope of the Weibull plots.
While these different failure mechanisms are initiated on a scale too small to observe with traditional light microscopy or scanning electron microscopy, an x-ray diffraction analysis of the fibers with higher and lower breaking strengths represented in our Weibull plot would allow beta-sheet crystal sizes to be determined. Establishing proof of a link between the two different Weibull slopes and beta-sheet crystal sizes would be an interesting direction for future study.
IV. CONCLUSIONS
(1) Provided that ambient conditions are comparable to those presented in this study, B. mori silk can be exposed to a wide range of microwave radiation doses without its mechanical properties being adversely affected. Thus, the silk can be used to reinforce materials that are subjected to microwave processing, as well as materials that are subjected to in-service microwave radiation.
(2) While the mean values of mechanical properties were unaffected by the microwave treatments delivered in this study, the spread of breaking strength values as measured by the Weibull modulus increased with microwave exposure. The decrease in failure predictability of individual fibers suggests that silk can more appropriately be used in a composite material for situations where it will be exposed to microwave radiation, rather than relying on individual, isolated fibers for mechanical performance.
(3) Due to the significant variations in ambient conditions when comparing results from different laboratories, standardization of storage and testing conditions is essential for meaningful inter-laboratory comparisons to become possible.
ACKNOWLEDGMENTS
All silkworm cocoons used in this study were provided by Marian Goldsmith, Department of Biological Sciences, University of Rhode Island. Michael Colvin (School of Natural Sciences, University of California, Merced) is gratefully acknowledged for recommendations regarding nonparametric statistical tests.