Background
The fetal circulation undergoes significant transition at birth, with multiple physiological changes occurring immediately after birth and possibly continuing for days or weeks. This transitional period can be challenging, especially for the very preterm infant; hence, an understanding of these changes is important for recognition and management of circulatory disturbances in this population.Reference Evans 1 Significant changes in cardiac pump function can be observed in the first day of life, but there is a paucity of available data in uncomplicated preterm infants after the immediate transitional period, because these stable preterm infants do not routinely receive echocardiograms.Reference Murase, Ishida and Momota 2 – Reference Sloot, de Waal and van der Lee 4 Significant cardiovascular complications, however, can occur in this period, and a reference to normal cardiovascular development could help interpret findings in unstable infants.
Novel techniques such as tissue Doppler and speckle tracking analysis have made it possible to study myocardial function in detail. Several investigators have reported on cardiac function up to term-corrected age using those techniques; however, results on post-transitional changes in left ventricular function were conflicting.Reference Murase, Ishida and Morisawa 5 – Reference James, Corcoran and Breatnach 11 Although most of the studies had large sample sizes, they all included infants who experienced common complications of prematurity such as respiratory distress syndrome, a patent ductus arteriosus, sepsis, and subsequent therapies that can potentially influence cardiac function. It is possible that the measured population adapted to their new haemodynamic condition in the post-transitional period, and results cannot be interpreted as normal for age. A recent study described stable, preterm infants at the time of measurement, but measurements took place after the period where most cardiovascular changes are expected in this population.Reference Hirose, Khoo and Aziz 12 The aim of this study was to describe left ventricular function using conventional and novel echocardiography techniques in the first few weeks after birth in a cohort of very preterm infants who did not experience significant antenatal or postnatal complications and treatments.
Methods
Study population
Preterm infants of <30 weeks of gestation at birth admitted to our neonatal intensive care unit were eligible for inclusion. Exclusion criteria were significant congenital abnormalities or CHD and significant perinatal hypoxia. Antenatal complications such as maternal diabetes, twin pregnancy, major antepartum haemorrhage, eclampsia, proven chorioamnionitis, and severe intrauterine growth restriction (<3rd percentile) were excluded as well as infants with indications of significant perinatal hypoxia (umbilical cord pH<7.10). After obtaining informed consent, infants were prospectively measured with echocardiography at days 3, 7, 14, 21, and 28 after birth. Image acquisition was performed by two investigators (K.W., N.P.) who were not blinded to the clinical situation. This study is part of a larger ongoing study to explore cardiovascular development in preterm infants, and approval for this study was obtained from the Hunter New England human research ethics committee.
To define a normal preterm population, we excluded infants with postnatal complications likely to affect cardiac function and development. We pre-defined four main exclusion groups: infants with significant lung disease during the study period, defined as the need for mechanical ventilation at any time and/or a fraction of inspired oxygen >0.30 after 24 hours of life; infants who received early surfactant treatment and infants on nasal continuous positive airway pressure were not excluded; infants with a patent ductus arteriosus diameter >1.5 mm before day 3 and/or >1.0 mm on subsequent scans; infants who developed sepsis that was clinically and blood-culture positive, necrotising enterocolitis, or who needed surgery during the study period; and infants who were given cardiovascular medications before or during the study period, such as inotropes, inhaled nitric oxide, non-steroidal anti-inflammatory drugs such as indomethacin and ibuprofen, dexamethasone, and diuretics.
Echocardiographic image acquisition
A 12-MHz phased-array transducer was used with an iE33 echocardiographic scanner (Philips Medical Systems, the Netherlands). Images were acquired from two cardiac cycles triggered by the R wave and stored at an acquired frame rate (typically 90–110 frames/second). To minimise handling time in these small fragile infants, our limited protocol included four-chamber images, short-axis images at the level of the papillary muscle, and the high parasternal views.
Conventional echocardiography parameters
Left ventricular length was measured from the four-chamber images in end diastole from the mitral annular hinge points to the apex, and ventricular diameter was the internal diameter just below the papillary muscles.Reference Lopez, Colan and Frommelt 13 A sphericity index was calculated by dividing ventricular diameter with length.
Left atrium length was measured in end systole from the apical four-chamber images as a perpendicular drawn from the midpoint of the plane of the mitral annulus to the superior aspect of the atrium, and left atrium area was estimated by manually tracing the atrium with exclusion of the appendage and pulmonary veins. Volume was calculated using monoplane summation of disks method indexed on body weight.
Posterior wall thickness and internal diameters were measured from the short-axis images in systole and diastole, and a fractional shortening was calculated.Reference Lopez, Colan and Frommelt 13 End-systolic wall stress was calculated using the formula described by Courand et al.Reference Courand, Marshall and Chang 14
The ductus arteriosus was viewed from the high parasternal view. The minimum diameter of the colour flow jet closest to the entry to the main pulmonary artery in end systole was taken as ductus diameter.Reference Evans and Iyer 15
Two-dimensional speckle tracking analysis
Speckle tracking analysis was performed using vendor-independent software (Cardiac Performance Analysis, version 1.1; Tomtec Imaging Systems, Unterschleissheim, Germany). Peak systolic longitudinal strain and peak systolic and maximum diastolic longitudinal strain rate were measured from the apical four-chamber view, and peak systolic circumferential strain and strain rate were measured from the parasternal short-axis images at the level of the papillary muscle.
TomTec software provides an automated method for measuring left ventricular volume parameters.Reference Nishikage, Nakai and Mor-Avi 16 Using monoplane summation of disks method on the trace from the four-chamber images, the software calculates volume for each frame. The minimum volume (end-systolic volume) and maximum volume (end-diastolic volume) allows for calculation of stroke volume and ejection fraction. As volume is calculated for each frame, the software also reports on rate of volume changes.Reference Zeidan, Erbel and Barkhausen 17 Rate of volume changes of the left ventricle represents aortic outflow and mitral inflow patterns, with a systolic wave, early diastolic filling wave, and an atrial contraction wave. We present peak rate of volume changes for each wave. All volume parameters were indexed on body weight.
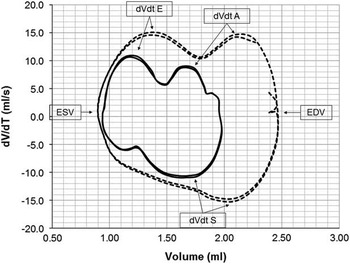
Volume rate of volume changes loops were constructed for each patient to provide a visual presentation of the individual volume changes over time (Fig 1). Raw frame-by-frame speckle tracking data were exported to Microsoft Excel 2010, where time progression matched with volume data was graphed in an XY scatter-chart type with smooth connecting lines.
Volume-dVdt loops of two cardiac cycles at day 3 (solid lines) and at day 28 (dotted lines) showing changes over time in a 28-week-gestation, 1140 g infant. An R-timed cardiac cycle starts at the right-hand side of the graph at end-diastolic volume (EDV) and moves downwards and to the left until ejection is completed at end-systolic volume (ESV). Diastole starts at the left-hand side of the graph and moves upwards and to the right until a full cardiac cycle is completed at EDV. Maximum rate of volume changes for each part of the cardiac cycle (systolic dVdt S, early diastolic dVdt E, and atrial contraction dVdt A) can be appreciated, as well as the changes over time in cardiac volumes and dVdt.

Basal septal and lateral velocities obtained with speckle tracking analysis were averaged and presented as systolic, early diastolic, and atrial contraction peak velocities.Reference de Waal, Phad and Lakkundi 18 An Ee’ ratio was calculated from the rate of volume changes at early diastole E divided by the early diastolic basal myocardial velocity as an estimate of left ventricular filling pressure.Reference van Dalen, Bosch and Kauer 19 , Reference Park and Marwick 20 Images with complete fusion of early diastolic and atrial contraction velocities or rate of volume changes were excluded from analysis.
We have previously studied the reliability of our methodology with good inter- and intra-rater reliability for the reported deformation parameters (correlation coefficient 0.82–0.94) and moderate reliability for dVdt and speckle tracking-derived myocardial velocities (correlation coefficient 0.68–0.84).Reference de Waal, Phad and Lakkundi 18
Statistical analysis
This is a descriptive study with no comparators. All parameters were explored for normal distribution. Repeat-measures analysis of variance was conducted to examine differences between the measurement time points. p Values <0.05 were considered to indicate significance. Statistical analyses were performed using SPSS for Windows, version 16.0 (SPSS, Inc., Chicago, Illinois, United States of America).
Results
There were 129 admissions <30 weeks of gestation during the 24-month study period. Among them, 27 were excluded because of antenatal complications, and 88 consented to participate in the study. In addition, eight infants were excluded because of significant respiratory disease, 49 because of a patent ductus arteriosus with or without respiratory disease, and six because of sepsis or necrotising enterocolitis, leaving 25 relatively stable preterm infants for analysis.
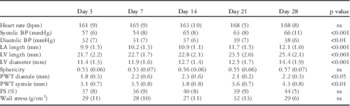
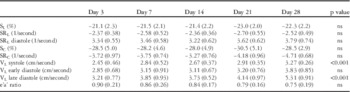
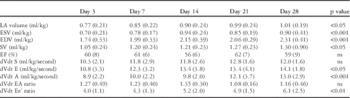
The median gestational age of the included infants was 28 weeks (range 25–29 weeks) and birth weight was 1062 g (range 630–1530 g). Of our included patients, 14 were males, and most scans were performed while the infants were on nasal continuous positive airway pressure support. A patent ductus arteriosus was found in 13, 6 and 2 infants on days 3, 7, and 14 with diameters ranging between 0.5 and 1.4, 0.5 and 0.8, and 0.3 and 0.6 mm, respectively. No patent ductus arteriosus was found after day 14. The cardiovascular results are presented in Tables 1, 2, and 3.
Clinical and cardiac dimension parameters presented in mean (SD).

BP=blood pressure; FS=fractional shortening; LA=left atrium; LV=left ventricle; PWT=posterior wall thickness
Myocardial deformation and basal myocardial velocity parameters presented in mean (SD).

SL=peak longitudinal strain; SRL=peak longitudinal strain rate; SC=peak systolic circumferential strain; SRC=peak systolic circumferential strain rate; VL=longitudinal velocity; e’a’ ratio=early diastolic to atrial contraction basal myocardial velocities ratio
Cardiac volume parameters presented in mean (SD).

dVdt A=early diastolic rate of volume changes; dVdt E=early diastolic rate of volume changes; dVdt EA ratio=early diastolic to atrial contraction rate of volume changes ratio; dVdt Ee’ ratio=early diastolic rate of volume changes to early diastolic velocity myocardial ratio; dVdt S=systolic rate of volume changes; EDV=end-diastolic volume; EF=ejection fraction; ESV=end-systolic volume; LA=left atrium; SV=stoke volume
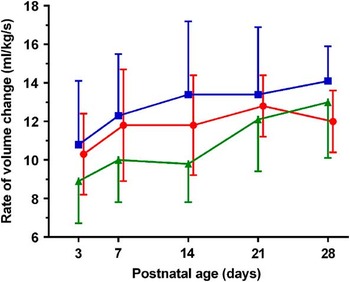
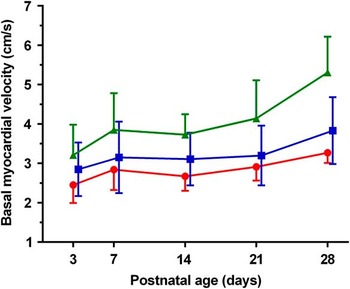
There was a significant increase in blood pressure and cardiac dimensions from day 3 to day 28. End-systolic volume, end-diastolic volume, and stroke volume increased over time, with most change occurring between day 3 and day 7. Rate of volume changes increased over time during early diastole (p=0.041) and atrial contraction (p<0.001), but not significantly during systole (p=0.054). Standard deviations for rate of volume changes were wide for the whole group, indicating individual variations (Fig 2). A visual representation of the volume rate of volume changes over time as seen in one individual patient is presented in Figure 1. Basal myocardial velocities increased in systole and atrial contraction, but not during early diastole (Fig 3, p<0.001, 0.055, and <0.001, respectively). Heart rate, fractional shortening, ejection fraction, and wall stress did not change.
Rate of volume changes (dVdt) for systole (red circles), early diastole (blue squares), and atrial contraction (green triangles).

Basal myocardial velocities for systole (red circles), early diastole (blue squares), and atrial contraction (green triangles).

Both longitudinal and circumferential left ventricular deformation remained stable throughout the study period. For longitudinal deformation, this was found for both systolic and diastolic parameters.
Discussion
This study presents post-transitional adaptation of longitudinal left heart volumes, wall shortening, and myocardial velocities obtained via conventional analysis and deformation imaging with speckle tracking analysis in a small cohort of uncomplicated, very preterm infants. In very preterm infants without significant antenatal and postnatal complications, we documented a small increase in blood pressure and a large increase in preload in the first few weeks of life without changes in cardiac deformation. We hypothesised that the morphological changes of the left ventricle predominantly followed the change in loading conditions, and that function was dictated by the morphological changes.
Stroke volume increased by 24% during the study period, presumably to accommodate higher tissue demands. To facilitate increase in volume, several post-transitional adaptations were seen in the preterm heart. First, cardiac size increased over the study period. The increase in ventricular diameter made it possible to increase stroke volume and at the same time maintain constant longitudinal wall shortening. As ventricular length also increased, the basal segments would have to travel with increased basal systolic velocity as heart rate remained unchanged. Second, wall stress was maintained with the increase in blood pressure by increasing ventricular radius and a small increase in posterior wall thickness. These changes did not lead to changes in circumferential deformation. According to Hooke’s law and with unchanged tissue elasticity in this period as early diastolic velocity and strain rate remained stable, it would be reasonable to assume that contractile force was not changed despite the increase in stroke volume. The adaptive changes of the preterm heart follow cardiac adaptations as described in volume load, not pressure load.Reference Bijnens, Cikes and Claus 21 In adult hearts, there is a clear relationship between cardiac size and stroke volume, with a dilated heart able to generate a larger stroke volume with the same contractile force. The increase in deformation with increasing stroke volume is compensated by the decrease in deformation due to the bigger size.Reference Marciniak, Claus and Sutherland 22 According to our data, the preterm heart is similarly capable of adapting to changes in volume load, and suggests that mechanical load continues to play a major role in regulating ventricular morphology and function during preterm cardiac development.Reference Tobita, Garrison, Liu, Tinney and Keller 23
Although systolic function remained largely unchanged, subtle changes in diastolic function could be appreciated. An increase in our speckle tracking-derived Ee’ ratio, where early diastolic inflow increased more than early diastolic myocardial velocity, suggests that the increase in flow during the study period was driven by increased filling pressure instead of improved relaxation. Hirose et al. showed that cardiac development from day 28 up to term corrected evolved with an increase in early diastolic inflow and myocardial velocities without significant changes in the Ee’ ratio.Reference Hirose, Khoo and Aziz 12 Diastolic function, however, was not restored to normal term values, suggesting a delay in continued maturation of the myocardium during postnatal life. Despite selecting the most uncomplicated infants for our study, delayed maturation was common in the first few weeks after preterm birth.
Myocardial velocities during atrial contraction increased in our study. The preterm heart is more dependent on atrial function compared with term infants, and its function resembles that of the fetus.Reference Hirose, Khoo and Aziz 12 , Reference Nii, Roman and Kingdom 24 Previous studies in preterm infants <30 weeks of gestation, where a high number of infants was supported with mechanical ventilation, did not show this increase in atrial velocities, suggesting impaired atrial function in more complicated or unwell preterm infants.Reference Murase, Morisawa and Ishida 6 , Reference Saleemi, El-Khuffash and Franklin 9
Most of our findings were comparable with other studies. Other investigators also noted an increase in left ventricular size and blood pressure over time and no or minimal changes in left ventricular deformation parameters up to 28 days or term-corrected age.Reference Helfer, Schmitz and Buhrer 7 , Reference Czernik, Rhode, Helfer, Schmalisch, Bührer and Schmitz 8 , Reference Schubert, Müller and Abdul-Khaliq 10 – Reference Hirose, Khoo and Aziz 12 The influence of a patent ductus arteriosus or the development of bronchopulmonary dysplasia on motion and deformation parameters was not consistent among investigators and may be related to patient selection;Reference Helfer, Schmitz and Buhrer 7 , Reference Czernik, Rhode, Helfer, Schmalisch, Bührer and Schmitz 8 , Reference de Waal, Phad and Lakkundi 18 however, direct comparison of deformation values between investigators is complex because of inherent differences between tissue Doppler and speckle tracking, as well as in vendor hardware and software. In a systematic review on reference ranges of left ventricular strain in children, differences in hardware and software could not explain the heterogeneity between studies.Reference Levy, Machefsky and Sanchez 25 Intervendor agreement was low, and the authors highlight important technical and methodological aspects of speckle tracking and the need to standardise deformation imaging in children. Deformation imaging can provide important additional information to conventional echocardiography, but its place in neonatal clinical practice has not been defined yet.Reference Breatnach, Levy and James 26
Our study has several strengths and limitations. The accuracy and reliability of speckle tracking analysis is, besides image quality, dependent on generated frames per second. With our hardware, we were able to obtain a maximum of 0.7 frames/second/bpm. This would be considered the lower end of optimal and could affect reliability of the diastolic parameters at high heart rate.Reference Sanchez, Levy and Sekarski 27 The main limitation to our study is the small sample size. Differences due to common maternal and neonatal confounders – that is, age, gender, and race – could not be explored; however, defining normal parameters in an abnormal population can be challenging. Only 25% of all eligible infants admitted during the study period met all criteria, and no infant <25 weeks of gestation could be included using our definition of normal. An optimal sample size for reference values depends on distribution of the data and variability of the measurements, but generally over 200 patients are recommended. Such a large sample size would not be feasible for any single neonatal centre. A multicentre approach would be limited by the fact that different centres would often use different hardware and software, adding to the variance in velocity and deformation measurements. We would stress the importance of excluding common pathology and treatments in this population if data on normal adaptation are sought. In previous reports, a large portion of infants had a significant patent ductus arteriosus and/or were mechanically ventilated at the time of the investigation.Reference Murase, Morisawa and Ishida 6 – Reference Saleemi, El-Khuffash and Franklin 9 , Reference James, Corcoran and Breatnach 11 , Reference Hirose, Khoo and Aziz 12 Mechanical ventilation can impair cardiac filling and alter afterload depending on lung condition and ventilator settings.Reference Pinsky 28 A patent ductus arteriosus can increase preload and reduce afterload, and thus alter cardiac size and function.Reference Helfer, Schmitz and Buhrer 7 , Reference de Waal, Phad and Lakkundi 18 Patent ductus arteriosus treatments such as non-steroidal anti-inflammatory drugs and surgical ligation significantly reduce longitudinal strain, and it remains unclear whether the treatments themselves or the change in loading conditions were responsible for those changes.Reference Sehgal, Doctor and Menahem 29 , Reference El-Khuffash, Jain and Dragulescu 30 It would be difficult to distinguish normal cardiac function from cardiac adaptation under such mixed circumstances.
Conclusion
We provided data on left ventricular function using conventional and novel echocardiography techniques in the first few weeks after birth in a small cohort of very preterm infants who did not experience significant antenatal or postnatal complications and treatments. Stroke volume increased in the first 28 days after preterm birth, and the preterm heart adapted by increasing its size while maintaining systolic and atrial function. Longitudinal deformation of the left ventricle remained unchanged, suggesting relatively preserved function with maturation. Maturation of early diastolic function was delayed leading to increased filling pressure.
Acknowledgements
None.
Financial Support
Financial support was obtained through a grant from the John Hunter Hospital Charitable Trust.
Conflicts of Interest
None.
Ethical Standards
The authors assert that all procedures contributing to this work comply with the ethical standards of the relevant national guidelines on human experimentation (Human Research Ethics Committee Australia) and with the Helsinki Declaration of 1975, as revised in 2008, and has been approved by the institutional committee of the Hunter New England human research ethics committee.