Introduction
The business environment of American companies is shaped by a collection of federal and state policies. This overlap of policies affects the political incentives of companies to participate in political processes. Sometimes, these policies are mutually complementary; at other times, they conflict with each other. However, the political science literature does not extensively address the role that state-federal overlaps play in the political process of lobbying. Although there is an abundance of recent empirical literature on federal lobbying (e.g., Aisbett and McAusland Reference Aisbett and McAusland2013; Baumgartner et al. Reference Baumgartner, Berry, Hojnacki, Leech and Kimball2009; Baumgartner and Leech Reference Baumgartner and Leech1998; Blanes i Vidal, Draca, and Fons-Rosen, Reference Blanes i Vidal, Draca and Fons-Rosen2012; Boehmke, Gailmard, and Patty Reference Boehmke, Gailmard and Patty2013; Faccio Reference Faccio2006; Kerr, Lincoln, and Mishra Reference Kerr, Lincoln and Mishra2014; Mahoney Reference Mahoney2008; You Reference You2017), few studies consider state policy a determinant of lobbying behavior at the federal level. To advance the study of lobbying, the next logical step would be a rigorous theoretical and empirical investigation of the role of state-level policy in federal lobbying. Ignoring state policies leaves political science with an incomplete view of the drivers of federal lobbying. Studies of lobbying in the American context should account for state policy and institutions to gain a clearer understanding of the determinants of lobbying behavior. This is particularly important at a time of political polarization, when policies differ dramatically across states (e.g., Caughey and Warshaw Reference Caughey and Warshaw2016).
We study the relationship between state and federal policy in the case of America’s booming renewable electricity markets. Since 1999, the American wind power industry has grown in part, thanks to the federal production tax credit (PTC). The PTC has always been a controversial policy with many committed proponents and opponents. The largest generator of nuclear power in the United States, Exelon Energy, for example, has mobilized against the PTC so aggressively that the American Wind Energy Association revoked the company’s membership in 2012.Footnote 1 Exelon’s complaint is that the PTC unfairly favors renewable sources of energy over other low-carbon alternatives, especially nuclear power. However, the PTC is not the only policy shaping the impact of renewables in the American energy economy. As of 2012, 21 states and the District of Columbia had a renewable portfolio standard (RPS) effectively in place that requires electric utilities to meet a certain percentage of their total generation from renewable sources.Footnote 2 These state-level policies co-exist with the PTC, leaving electric utilities, renewable energy developers, and consumers of electricity with a complex patchwork of various policies.
Our contribution draws on an analysis of lobbying behavior among electric utilities in the shadow of the PTC and the RPS mosaic in the states. We examine how electric utilities, which can use the PTC to buy cheaper renewable electricity but must increase their renewable electricity generation under an RPS, condition their federal lobbying behavior on federal- and state-level developments.Footnote 3 Not only are the profits and strategies of electric utilities strongly dependent on PTC and RPS policies, but electric utilities are also active lobbyists in the American political system (Kim, Urpelainen, and Yang Reference Kim, Urpelainen and Yang2016). Electricity generation requires large fixed investments that encourage utilities to lobby for policies that protect the profitability of said investments. The case of electric utilities is not only a useful laboratory for empirical analysis of lobbying, but also essential to understanding the politics of climate change and energy security. In 2017, 28% of U.S. carbon dioxide emissions came from electricity generation alone.Footnote 4 Besides general lessons about the political economy of lobbying, our study offers new insights into vested interests’ lobbying on a critical clean energy policy.
To identify the effects of federal and state policies on lobbying behavior, we compare electric utilities’ propensity to lobby when the PTC is about to expire, and when it is not. The Congress has typically renewed the PTC for a year at a time, creating regular variation in electric utilities’ incentive to lobby. When the PTC continues, electric utilities have less incentive to lobby. But when the PTC is about to expire, the policy stakes are high. Since the introduction of the PTC in 1992, which was originally scheduled to expire in 1999, there have been multiple occasions of legislative debate on whether to extend or modify the policy or permit the policy to lapse. The PTC was allowed to lapse three times and extended seven times. We exploit the quasi-exogenous nature of the timing of PTC expirations and extensions to examine whether utilities lobby more extensively when the PTC was about to expire than other periods.
We next consider the incentives of electric utilities depending on how much of their electricity generation is from states governed by an RPS. As we shall argue, electric utilities with generation capacity in RPS states face very different incentives than electric utilities that do not face a renewable electricity generation requirement. Because the RPS requires utilities to purchase or generate renewable electricity, the presence of such policies means that the PTC does not change the demand for renewable electricity in the state. Therefore, the presence of the RPS means that the interest of electric utilities in the PTC decreases, and thus their reactions to the threat of PTC expiration should be mitigated.Footnote 5
Our analysis of lobbying data reveals that the timing of PTC expiration increases the propensity of lobbying by utilities. However, this effect is smaller for utilities in states with stringent RPS policies. For a non-RPS utility, the threat of PTC expiration increases the likelihood of lobbying by about 4% compared with the average probability of engaging in lobbying among the examined utilities.Footnote 6 In contrast, this threat actually lowers lobbying probability for RPS-compliant utilities by approximately 8%. Furthermore, we find that this substitution effect applies to utilities whether they possess renewable energy capacity (potential winners of PTC) or not (potential losers). Although both types of electric utilities are less likely to lobby under an RPS, the difference is particularly pronounced when the PTC is under the threat of expiration. This result is consistent with the notion that both potential winners and losers from a subsidy policy respond to state policies.
Our study speaks to the large body of literature on lobbying behavior in various aspects. First of all, the findings suggest that state policies affect federal lobbying. Studies of lobbying in the federal system examine how federal-level policies influence state-level lobbying by state interest groups (Baumgartner, Gray, and Lowery Reference Baumgartner, Gray and Lowery2009) or federal-level lobbying by state officials (Crotty Reference Crotty1987). However, little attention has been paid to the interactive effect of state policies on federal lobbying activity even though previous studies have already documented the mutual influence between national-level and subnational-level policies (e.g., Graham, Shipan, and Volden Reference Graham, Shipan and Volden2013; Welch and Thompson Reference Welch and Thompson1980). While higher levels of government can impose “top-down” pressures like fiscal incentives or even coercion on lower levels to implement certain policies (Allen, Pettus, and Haider-Markel Reference Allen, Pettus and Haider-Markel2004; Shipan and Volden Reference Shipan and Volden2008), “bottom-up” pressures are also frequent via transmission of policy-relevant information through interest groups (Shipan and Volden Reference Shipan and Volden2006). We highlight the importance of accounting for state policies when examining the impact of federal policy on the lobbying strategies of individual firms. The RPS is one sector-specific example; from taxation to subsidies and environmental regulations, state policies not only influence economic interests directly but also indirectly by modifying the effects of federal policies. Therefore, whenever state policy modifies the effects of federal policy, understanding and explaining lobbying behavior at the federal level will require a consideration of the state policy context.
Also, our findings contribute to the literature on lobbying behavior by identifying political factors that determine the size of incentives for lobbying. The literature has suggested various rationales for lobbying. Prominent explanations point to the incentive to support a legislator in exchange for firm-specific benefits (e.g., Richter, Samphantharak, and Timmons Reference Richter, Samphantharak and Timmons2009) or preferred legislation (e.g., Baron Reference Baron1989; Grossman and Helpman Reference Grossman and Helpman1994; Hillman Reference Hillman1982; Snyder Reference Snyder1990), provide information, or signal their position to a legislator (e.g., Hall and Deardorff Reference Hall and Deardorff2006). Our analysis offers new insight by highlighting an important variation in the size of these incentives for lobbying and providing causal estimates of factors that determine these incentives. Our findings reveal that electoral utilities’ heterogeneous incentives to lobby at the federal level are affected by state-level policies. Furthermore, our work contributes to a growing body of literature on dynamic lobbying, which focuses on the timing of lobbying. While lobbying is “sticky” mainly due to the presence of fixed entry costs and decreasing marginal cost of additional lobbying (Drutman Reference Drutman2015), corporations make lobbying decisions by accounting for ebbs and flows of the political agenda. Furthermore, by examining not only the likelihood of lobbying (extensive margin of lobbying) but also lobbying expenditures (intensive margin of lobbying), we show that PTC activity and RPS adoption jointly decrease incentives to lobby in the first place rather than adjusting expenditures for lobbying activities.
Theory and Hypotheses
Lobbying is an essential component of the political strategy of major corporations in American politics (Baumgartner and Leech Reference Baumgartner and Leech1998). According to the OpenSecrets.org database, in 2018, lobbyists spent US$3.46 billion at the federal level.Footnote 7 The energy industry plays a major role; oil/gas producers and electric utilities were the fifth and sixth most important lobbying sectors in 2018, contributing US$125 million and US$122 million, respectively. As the energy industry tends to be capital intensive and requires specific assets, industry players have formidable incentives to influence policy outcomes (Alt et al. Reference Alt, Carlsen, Heum and Johansen1999; Hughes and Lipscy Reference Hughes and Lipscy2013). In fact, a voluminous literature on energy politics has found that interest groups in the energy industry exert substantial influence on energy and environmental policies (Aidt Reference Aidt1998; Cheon and Urpelainen Reference Cheon and Urpelainen2013; Gullberg Reference Gullberg2008; Kang Reference Kang2015; Kim, Urpelainen, and Yang Reference Kim, Urpelainen and Yang2016; Michaelowa Reference Michaelowa2005; Raustiala Reference Raustiala1997; Vogel Reference Vogel1996).
The literature on lobbying offers several different, but not mutually exclusive, rationales for lobbying. In the conventional political economy approach, lobbyists support a legislator politically in exchange for preferred legislation (Aidt Reference Aidt1998; Aisbett and McAusland Reference Aisbett and McAusland2013; Faccio Reference Faccio2006; Grossman and Helpman Reference Grossman and Helpman1994; Hillman Reference Hillman1982; Hillman, Keim, and Schuler Reference Hillman, Keim and Schuler2004). Although actual exchange of money for policy is illegal, lobbyists can indirectly use their access to promise support in elections, perhaps in the form of campaign contributions or employee mobilization (Ansolabehere, Snyder, and Tripathi Reference Ansolabehere, Snyder and Tripathi2002; Baron Reference Baron1989; Snyder Reference Snyder1990). Another approach emphasizes the role of information provision and costly signaling in lobbying (Austen-Smith Reference Austen-Smith1993; Hall and Deardorff Reference Hall and Deardorff2006). In this approach, interest groups and firms lobby legislators to either signal their preferred position through a costly action or provide the legislator with helpful information. As policymakers are not fully informed about the possible consequences of various policies, lobbyists can influence the decisions of policymakers by providing technical and complex information that may not have been previously available.
Electric Utilities and the Federal PTC for Renewable Energy
We first explore how variation in the federal political environment condition vested interests and then investigate the responses of these vested interests under different constellations of state policy. As articulated in Moe (Reference Moe2015), vested interests are fundamental to an understanding of the stability and change of political institutions, from the formal governmental structures to governmental programs. They can be sources of the stability, but also of the change. It is our attempt here to understand one of the mechanisms through which vested interests can influence the policy outcome. By investigating how utilities respond to the potential change in the federal program, we illustrate one mechanism through which vested interests influence the stability and change of government programs.
To keep the discussion focused, we begin with a brief introduction to the PTC, which was initially enacted on October 24, 1992, as part of Energy Policy Act (H.R.776.ENR) and set to expire on June 30, 1999. Since then, it has been repeatedly under threat of expiration with renewals effective for only one or two years at a time. With the exception of the initial expiration date in June 1999, the PTC has always been scheduled to expire at the end of the calendar year.
Fuel choice is one of the fundamental factors shaping electric utilities’ interests. Depending on the type of fuel in which utilities have invested for electricity generation, climate policies can result in significant benefits or losses. Specifically, by offering credit for electricity generation from wind and other eligible renewables, the PTC boosts their profitability. In 2014, wind, geothermal, and closed-loop biomass were eligible for a rebate of US$0.023 per kilowatt-hour, equivalent to around 15% of the average levelized cost of renewable energy generation in 2014 (US$0.148 per kilowatt-hour), while the rebate for other eligible technologies was US$0.011 per kilowatt-hour.Footnote 8 The rebates are available for generation during the first 10 years of a project.Footnote 9
Studies show that the PTC has been a boon for wind energy in particular. In 2014, the National Renewable Energy Laboratory (Lantz et al. Reference Lantz, Steinberg, Mendelsohn, Zinaman, James, Porro, Hand, Mai, Logan, Heeter and Bird2014) conducted a modeling exercise. If the PTC expires without alternative federal-level support, wind electricity generation capacity would only grow by 3 to 5 gigawatts annually versus 5 to 15 gigawatts under the PTC. In other words, the PTC could increase wind energy deployment by up to three times.
For the purposes of lobbying, the timing of PTC expiration and modifications can be considered quasi-exogenous. The legislative history of the PTC shows that the typical PTC extension is one year, and the only exceptions have been instances of major legislative activity that have allowed pro-renewable supporters to demand longer extensions. As we detail below, in neither case is the timing of PTC expiration systematically related to lobbying activity though the outcome may well be.
The expiration of the PTC has historically generated intense lobbying activity. Consider, for example, the threat of expiration on December 31, 2012. On October 26, 2012, “[t]wo dozen investors representing over $800 billion in assets under management sent a letter to Congressional leaders today calling for an immediate extension.”Footnote 10 On December 12, 2012, the American Wind Energy Association (AWEA) published a press releaseFootnote 11 saying that
The wind industry recognizes that our country is facing significant fiscal challenges and is supportive of all energy technology incentives being reviewed and even phased down when Congress considers tax reform. However, the PTC has supported the wind industry in its efforts to significantly reduce the cost of producing electricity, and its continued availability for a reasonable period of time will allow the industry to invest in the cost-saving technologies required to finish the job.
The lobbying is not limited to proponents of the PTC. As noted in the introduction, the electric utility Exelon, a major producer of nuclear power had to resign from AWEA because it lobbied against the extension of the PTC. On November 4, 2013, the conservative advocacy organization Americans for Prosperity sent a letter to the Senate saying that the
wind industry has very little to show after 20 years of preferential tax treatment; it remains woefully dependent on this federal support . . . Congress should break from the past and allow the wind PTC to expire as scheduled.Footnote 12
Given this logic, we expect the consideration of PTC renewal to increase the lobbying activity of electric utilities. Consider how the PTC influences the electricity demand from utilities and the supply from electricity producers in the wholesale electricity market. (For the graphical illustration of the changes of the demand and the supply, see Section A10 in the online appendix.) When the PTC is about to expire or under legislative debate, electric utilities have stronger incentives to lobby than at other times.
This logic is equally applicable to both expected winners and losers. On one hand, the consideration of PTC renewal makes lobbying more beneficial for expected winners, electric utilities that generate electricity from renewable sources, because the PTC provides rebates for their electricity generation. On the other hand, this would place utilities that do not rely on renewable sources at a comparative disadvantage in the wholesale electricity market. The PTC would increase the profitability of renewable electricity, which raises the supply of renewables and reduces electricity prices. While utilities that do not rely on renewable sources may benefit from reduced electricity prices at which they buy, utilities are in competition in the wholesale market and concerned about the differential effects of the PTC on different types of utilities. This logic is also consistent with why Exelon opposed the PTC for wind energy due to its differential effects on wind versus other energy types such as nuclear.Footnote 13 Due to this competition, utilities without any renewable energy generation would be relative losers from the PTC and would have increased incentive to lobby against it.
Hypothesis 1: When PTC renewal is under consideration, electric utilities are more likely to lobby.
Federal and State Policies
A key contribution of this study is the characterization of the effects of state policy on federal lobbying. In a federal system, firms must consider the effects of state policy on incentives to lobby at the federal level. For renewable energy, the question is whether the presence of an RPS increases or decreases the propensity of lobbying when the PTC is about to expire. Though RPS policies comprise heterogeneous designs across states in various dimensions such as coverage, penalty, requirements for “new” investments in renewables, and enforced through a credit-trading mechanism, they all share a key feature: all RPS policies mandate electric utilities to meet a certain percentage of their total generation from renewable sources by purchasing electricity from renewable energy sources (Shrimali, Lynes, and Indvik Reference Shrimali, Lynes and Indvik2015; Wiser et al. Reference Wiser, Namovicz, Gielecki and Smith2007; Yin and Powers Reference Yin and Powers2010). The utilities that do not own or develop renewable energy assets typically meet this requirement by making long-term contracts with other independent renewable producers or by purchasing renewable energy credits. Without an RPS, both types of electric utilities have increased incentives to lobby on PTC when its renewable is under consideration, as outlined above. When RPS has been implemented in a state, both winners and losers have less incentive to lobby on PTC due to the substitution effects between federal-level PTC and state-level RPS.
We consider how the state-level adoption of an RPS affects the lobbying strategy of both winners and losers of the federal-level renewable energy policy. First, consider winners of the federal-level renewable energy policy—electric utilities with renewable electricity generation capabilities. Without RPS, these utilities have a clear incentive to lobby for the PTC extension because the PTC provides a subsidy for renewable energy generation, thereby reducing the net production cost of renewables. The utilities with renewable electricity generation capabilities in the states with RPS, however, have less incentives to lobby for the PTC extension compared with the ones in the states without RPS. These two policies clearly act as a substitute. Most RPSs use renewable energy certificates that are issued for the production of renewable electricity. The RPS requires electricity retailers to purchase certificates, which act as a subsidy to renewable energy generators who can sell the certificate credit at the market price (Fell, Linn, and Munnings Reference Fell, Linn and Munnings2012). As utilities in the RPS states already enjoy the benefits of state-level RPS that provides quasi-subsidy, they have less incentive to engage in costly lobbying on the PTC extension. Even if they lose benefits from the PTC, they would still enjoy from the RPS requirement.
Next, consider losers of the PTC—electric utilities without renewable energy generation capabilities. Utilities in the states without RPS have a clear incentive to oppose the PTC. The PTC decreases the production costs of renewable energy generation, which depresses electricity prices in general. While the reduction in prices is offset by subsidy for utilities with renewable energy generation, those utilities without renewable energy generation cannot enjoy the subsidy. Therefore, these utilities have incentives to engage in lobbying for the expiration of the PTC. However, in states with RPS, utilities expecting to have to purchase renewable electricity from others do not have any obvious additional incentive to lobby. These utilities now have to purchase renewable electricity under the RPS, and the subsidy from the PTC reduces their costs of doing so. Thus, although the market price for electricity decreases, the cost of meeting the RPS requirement also decreases. Thus, these utilities under the RPS system have both gains and losses from the PTC, so their incentives to lobby are not obvious. Given that engaging in lobbying is costly, we can expect that these utilities would not engage in lobbying unless they expect clear benefits or losses from the policy that will far offset the cost of lobbying.
Moreover, the PTC may even generate some benefits to previous losers, especially if they choose to become renewable electricity generators. If the PTC is sufficiently attractive to make renewable electricity generation profitable, some utilities may choose to actively lobby in favor of the continuation of the policy when under the threat of expiration. In this case, some of the previous losers, who would have lobbied against the PTC without the RPS, now lobby in support of it. Thus, the overall level of lobbying again remains unchanged.
This reasoning can be turned into a testable hypothesis by comparing how utilities affected and unaffected by a state RPS respond to the threat of PTC expiration. Given that a state RPS and the PTC tax credit are essentially substitutes, we hypothesize that utilities with production capacity covered by an RPS are less likely to mobilize in response to the threat of PTC expiration.
Hypothesis 2: When PTC renewal is under consideration, electric utilities in states with stringent RPS policies are less likely to lobby than in states without.
Before we turn to discuss our research design, it should be noted that the two hypotheses are not mutually exclusive. While the first hypothesis examines the independent effects of the consideration of PTC renewal on the likelihood of lobbying, the second hypothesis focuses on how the size of such depends on the presence of state-level RPS. While we expect utilities (both expected winners and losers) on average to be more likely to engage in lobbying when PTC renewal is under consideration per our first hypothesis, such effects would be expected to be smaller for utilities operating in RPS states per our second hypothesis.
Research Design
We identify the effect of the PTC threat on utilities’ lobbying behavior under different state policies. The outcome variable is a binary indicator for whether or not an electric utility lobbied at a given time. We focus on individual lobbying instead of collective lobbying as the number of relevant trade associations is too small for systematic hypothesis testing.Footnote 14
To test the above hypotheses, we put together a data set of all lobbying records from the Congress between the years 1998–2012. While the PTC was initially implemented in 1992, we begin in 1998 because lobbying disclosure became mandatory at that time. We collected all the lobbying reports of this period. We then created a comprehensive data set of American electric utilities, again for the same time period, by combining lobbying disclosure data with detailed information on characteristics of electric utilities, such as size and generating capacity within the states where they operate. Such utility-level characteristics are extracted from the Energy Information Administration’s (EIA) annual EIA-923 form for power generators. Because the EIA data provide the generation data at the plant level for every year in our sample, we can identify the distribution of generation capacity across different states.
The basic unit of analysis is a utility-period, where the time period is either three or six months depending on the lobbying disclosure rules. The lobbying data were recorded biannually up to 2007 and quarterly from 2008. As the dependent variable is a binary indicator for lobbying, we estimate conditional logistic regressions with utility fixed effects.Footnote 15 Our primary regression equation is specified as follows:
 $$ \begin{array}{l}\mathrm{Pr}({\mathrm{Lobbying}}_{i,t}=1)=F({\alpha}_i+{\beta}_1\mathrm{PTC}\ {\mathrm{Active}}_t+{\beta}_2{\mathrm{RPS}}_{i,t}\\ {}+{\beta}_3\mathrm{PTC}\ {\mathrm{Active}}_t\times {\mathrm{RPS}}_{i,t}+{\beta}_4\mathrm{Total}\ \mathrm{Net}\ {\mathrm{Generation}}_{i,t}\\ {}+\delta +\eta +\lambda ),\end{array} $$
where i indexes utilities and t time periods. The dependent variable is Lobbyingi,t, which refers to a dummy variable coded 1 if a utility i lobbied in period t. F is the cumulative logistic distribution, and PTC Activet is a dummy variable coded as one if the PTC is about to expire or under legislative debate in period t. RPSi,t is a binary variable, denoting a utility that produces electricity generation in the states with RPS regulations. In addition, we add the interaction term between PTC Activet and RPSi,t to capture the interactive effect of PTC and RPS on lobbying behaviors. In turn, αi denotes utility fixed effects. We also control for the total amount of electricity generation to account for utility size. The value of total generation at the utility level is logarithmized to adjust for skewness. To ensure that the results are robust, we also estimate logistic regressions with conditional utility fixed effects.Footnote 16 We cluster standard errors by states that are assigned to RPSi,t throughout the analyses.Footnote 17
We also include linear year trend (δ), biannual dummies (η), and quarter dummies (λ) to account for temporal trends. Models with the linear year trend allow us to compare times of PTC and non-PTC activity while controlling for any secular trends in lobbying over time. Biannual and quarter dummies account for seasonal variation in lobbying within calendar years. Some specifications include year dummies instead of δ so that we only exploit within-year variation in PTC and non-PTC activity. Finally, in some models, we include fixed effects for each quarter of each year. However, in these models, we do not include PTC Activet because quarterly fixed effects absorb the impact of PTC Activet, which is invariant across utilities in period t. These models are ideal for identifying the coefficient for the interaction term, but they cannot be used to compare episodes with and without PTC activity.
To test if the magnitude of the substitution effect between the PTC and the RPS depends on a utility’s readiness to invest in renewables, we also estimated models with triple interaction terms between PTC Activet, RPSi,t, and Renew Geni,t, a dummy variable denoting if a utility i is a renewable electricity generator in period t. This approach is based on the idea that a utility with preexisting renewable electricity generation has accumulated experience in installing and operating these plants and is thus better positioned to make additional investments in renewable electricity generation in a growing market.
Dependent Variable
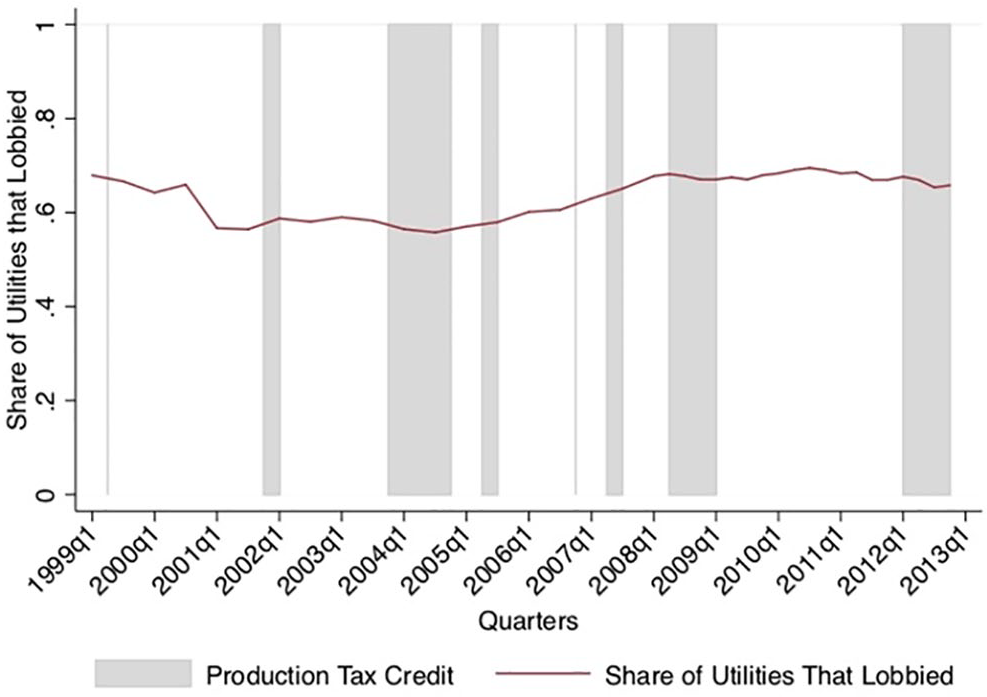
As noted above, the dependent variable is a binary indicator for lobbying by utility i at time t. To minimize concerns about the effects of barriers to entry in lobbying, such as upfront costs and returns to experience (Drutman Reference Drutman2015; Kerr, Lincoln, and Mishra Reference Kerr, Lincoln and Mishra2014), we first restrict our sample to the utilities that had engaged in lobbying at least once during the 1998–2012 period. Among 3,389 utilities in our original sample, 2,860 utilities (84.4%) did not engage in lobbying in the given period at all. We exclude these utilities from our sample in the first analysis and focus on the 529 utilities that had lobbied at least once. This analysis is interested in variation in lobbying propensity among utilities that are generally capable of entering the lobbying game. This approach allows us to focus solely on the timing of lobbying, but the results are robust if we consider all nonlobbying utilities by omitting utility fixed effects (Section A6 in the online appendix). The distribution of lobbying over time and the periods when the PTC was under legislative debate, is shown in Figure 1.
Share of electric utilities in the sample that lobby over time, overlaid on periods of legislative activity over the PTC.
Note. PTC = production tax credit.

Based on the lobbying disclosure data, we check the distribution of lobbying reports that fall into relevant lobbying categories: energy, environment, and utilities. The majority of lobbying reports are found to be related these three categories. The category of energy was the most frequently lobbied topics, with 44% of lobbying reports by utilities in the sample found to be related to energy. Next, 32% and 13% of lobbying are relevant to the issue of environment and energy, respectively. It should be also noted that lobbying reports are related to multiple issues: 6% of lobbying reports are related to all three categories, 22% have lobbied on two of three categories, and 31% have lobbied one category among three. Only 41% of lobbying reports did not choose any relevant category.
Explanatory Variable: PTC Activity
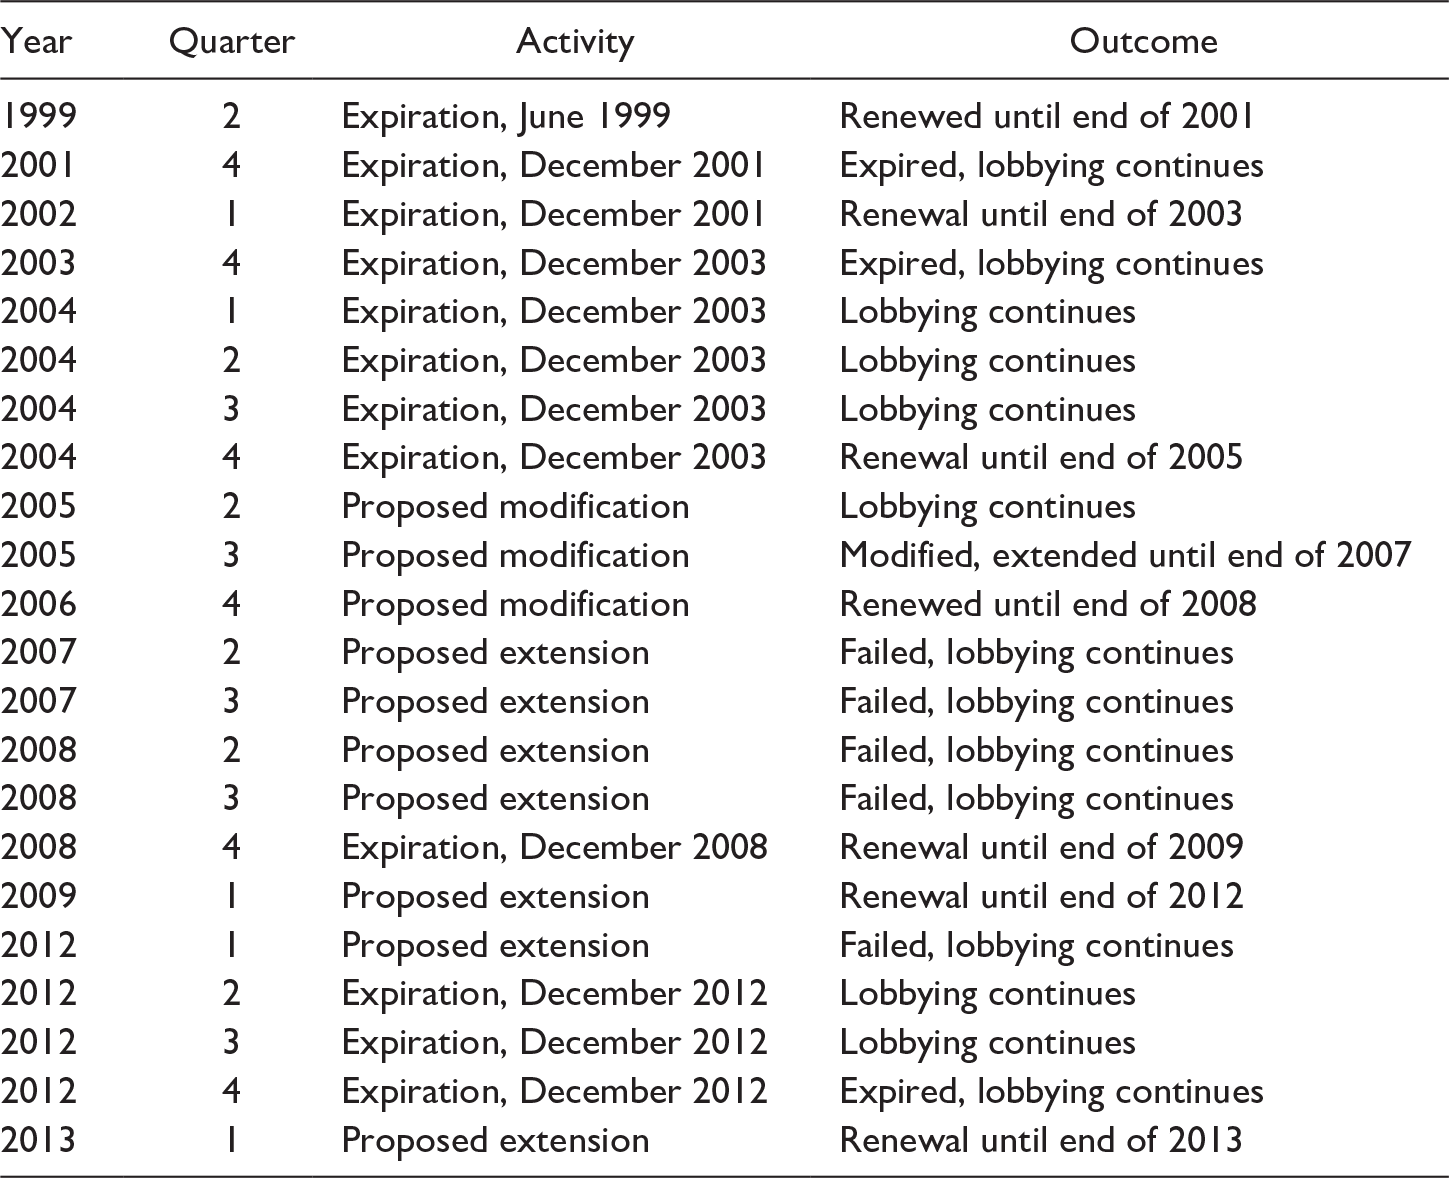
The first explanatory variable is an indicator for legislative activity around the impending expiration of the PTC at a given time. Since it was first enacted in 1992, the PTC has experienced only short-term and unpredictable extensions with occasional expirations. The legislative activities and outcomes are summarized in Table 1. We created a binary indicator to denote periods of legislative activity regarding the PTC, be it debate or impending expiration, coding those periods as 1. We coded periods of zero PTC legislative activity as 0. The exogeneity of the timing of PTC expiration and extension is an important identifying assumption for this study, and we will discuss it in depth below.
Summary Table of Legislative Activities and Outcomes Regarding PTC Extension, 1999–2013.

Note. PTC = production tax credit.
Explanatory Variable: State Renewable Energy Policy
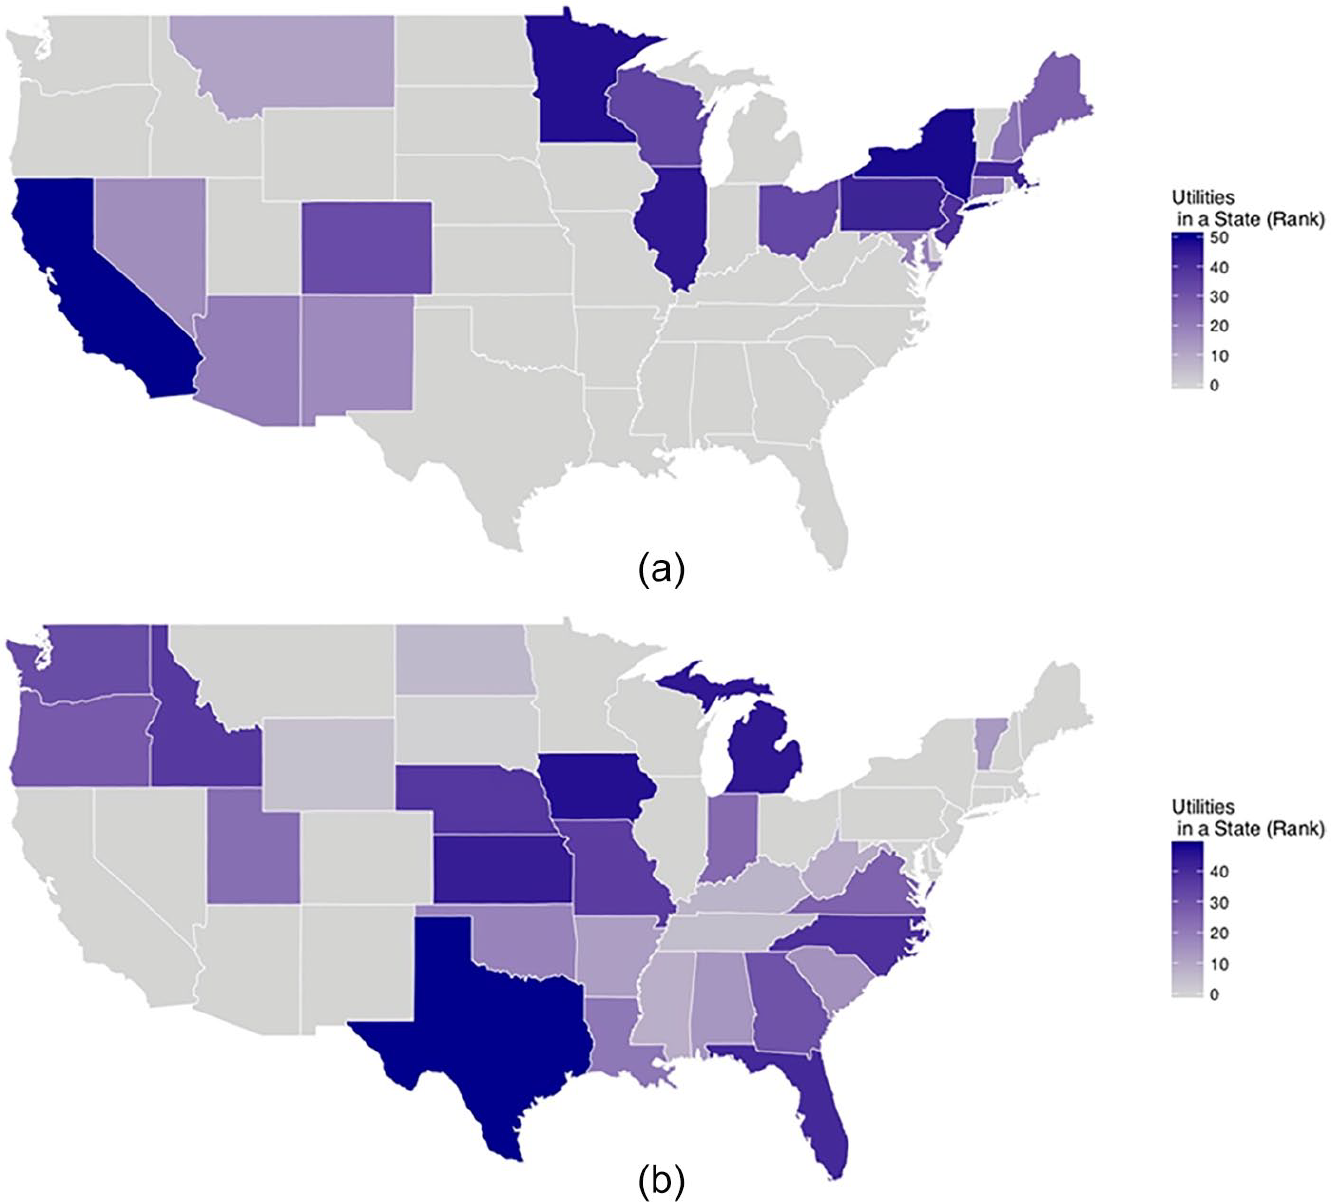
Our next explanatory variable is a measure of how much a utility is affected by the RPS. Our RPS data are from Shrimali, Lynes, et al. (Reference Shrimali, Chan, Jenner, Groba and Indvik2015). Of the various policy options to promote renewable energy resource development in individual states, the RPS is the most common and important. It requires energy suppliers to procure renewable energy or renewable energy credits to make up a certain percentage of their electricity sales or generating capacity. Figure 2 describes which states have implemented the RPS as of 2012 along with the location of utilities. The comparison of the two panels shows that the location of the utilities is not systematically related to the presence of RPS.
Implementation of RPS across the states in 2012 and the location of utilities: (a) Number of utilities operating in the states that had the RPS (as of 2012). (b) Number of utilities operating in the states that did not have the RPS (as of 2012).
Note. The upper panel (a) features the states that had the RPS in 2012. The lower panel (b) features the states that did not have the RPS in 2012. We rank the states from the one that has the least number of utilities to the one with the most number of utilities. States with more utilities are colored in darker purple. In calculating the number of utilities in a given state, we assigned weights according to the electricity generation in a given state. RPS = renewable portfolio standard.

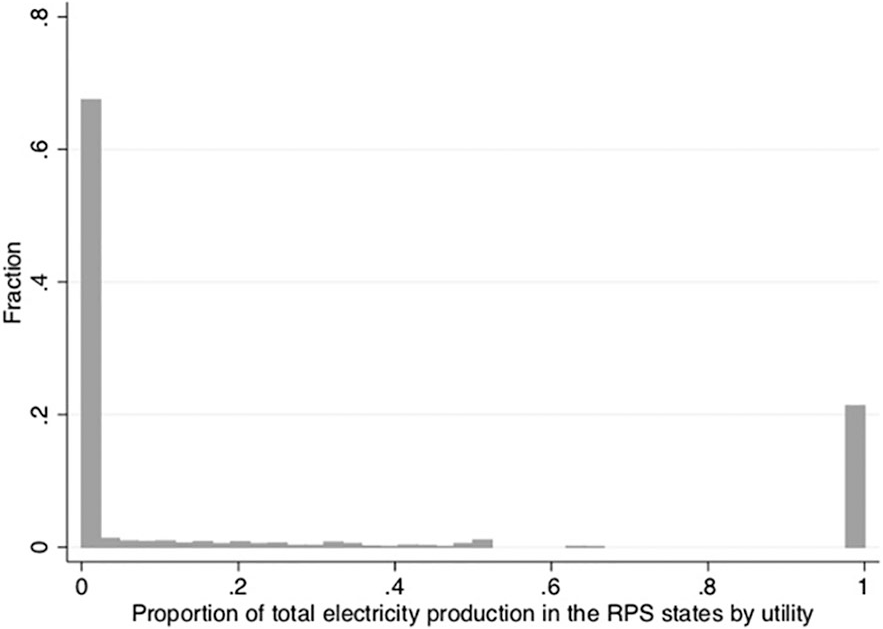
To capture the extent to which utilities are influenced by state RPS policies, we utilize a simple binary indicator for RPS states. We calculate the share of electricity generation by each utility in those states in each time period. Because our utility data are at the plant level, we assign weights to different state policies across all utilities in our sample. For example, if utility i generates 30% of its total electricity in the states that adopted RPS regulations in period t, it is recorded as 0.3. The distribution of the utilities’ share of electricity generation in the RPS states is presented in Figure 3. The vast majority of utilities (85%) in our sample fall under the two extreme values of 0 and 1. This distribution suggests that using a continuous measurement of the extent that a utility is affected by RPS is problematic, as the distribution is neither continuous nor normal. We therefore construct a dichotomous variable, coded as 1 for a utility that operates only in the RPS states and 0 otherwise. As an alternative specification, we use the average share of electricity generation in the RPS states (0.238) as a cutoff point and coded 1 for utilities above that point and 0 for those below (Section A8 in the online appendix).
Histogram of the share of electricity generation in the RPS states.
Note. RPS = renewable portfolio standard.

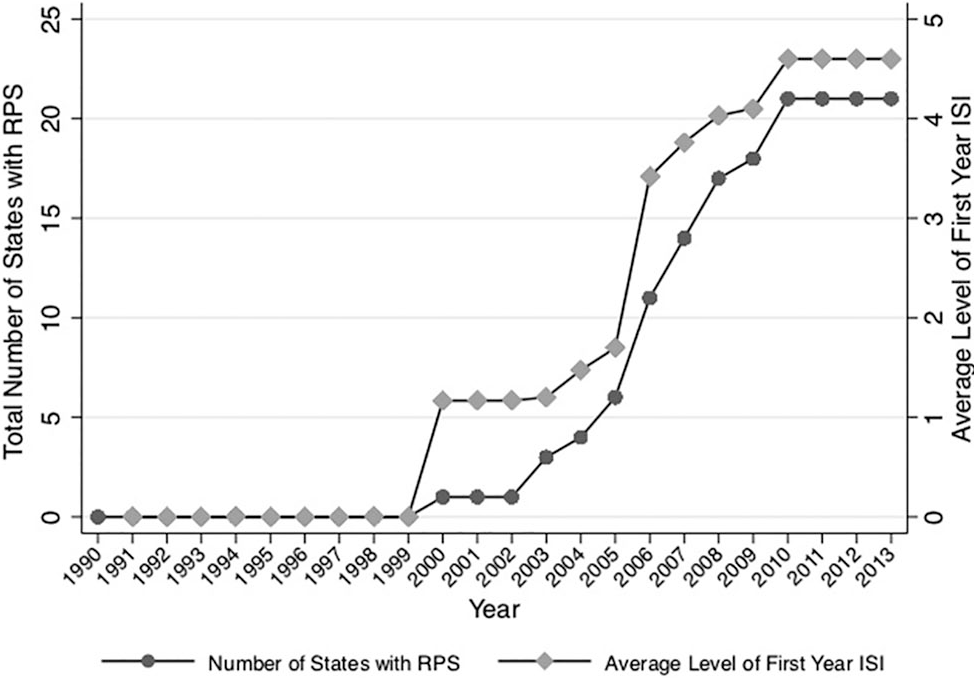
The adoption of RPS over time is illustrated in Figure 4. The number of states that have adopted an RPS has sharply increased since 2000. In addition, the stringency of state RPS, measured by the incremental share indicator (ISI), which measures the incremental percentage requirement in renewable generation, increased over years (Shrimali, Chan, et al., Reference Shrimali, Chan, Jenner, Groba and Indvik2015; Yin and Powers Reference Yin and Powers2010). By adjusting the estimates for existing renewable electricity capacity, this measure captures the utilities’ need to add new renewable energy generation capacity to their portfolio (Shrimali, Chan, et al., Reference Shrimali, Chan, Jenner, Groba and Indvik2015). Specifically, we use the incremental requirement in wind energy generation mandated by an RPS policy. Along with the adoption of RPS, the average level of wind ISI has also increased.
Adoption of RPS policy by states and average wind ISI level over time, 1990–2012.
Note. RPS = renewable portfolio standard; ISI = incremental share indicator.

In our empirical analysis, we also estimate all the models using an indicator for wind ISI mandated by RPS policies to account for heterogeneity in RPS policies (Section A7 in the online appendix). We construct a dichotomous indicator for wind ISI as the distribution is, again, not continuous and significantly skewed to the right.Footnote 18
Furthermore, we check whether the results remain robust when using continuous measure of RPS coverage instead of a binary specification of RPS (Section A8 in the online appendix). Specifically, we use a continuous indicator that captures yearly RES-E deployment requirement as a percent of total generation available from Shrimali, Lynes, and Indvik (Reference Shrimali, Lynes and Indvik2015). Again, we weighted this measure with regard to an utility’s share of electricity generation in the states where it operates.
Identifying Assumptions
Our identification strategy is based on the idea that lobbying by electric utilities changes with the quasi-exogenous timing of episodes of PTC consideration in the Congress. The change in lobbying is caused by the heightened salience of the PTC, but PTC activity does not change other incentives to lobby. The size of the effect, in turn, depends on whether the utility has capacity in RPS states. As long as RPS adoption at the state level is quasi-exogenous to PTC consideration, we can identify the interaction term of our regression model. Specifically, we impose three assumptions.
First, we assume that the timing of legislative PTC activity is quasi-exogenous to federal lobbying. This assumption can be validated by looking at the factors that determine whether the PTC is debated or not. As shown in Table 1 above, with the exception of the original expiration date of June 1999, the PTC has always been set to expire at the end of the budget year, a regular scheduling decision that is unrelated to federal lobbying. The most important exceptions to this pattern are shown in Section A1 in the online appendix. The exact timing in all these cases depends on the timing of much broader bills on the legislative agenda. It is unlikely that utilities can have such a short-term influence on the legislative agenda of the same quarter. The quarter during which the PTC was debated is thus not something a utility lobbyist can plausibly influence. Other than these measures, the only notable variation is in the length of each PTC period and whether or not the Congress managed to renew the PTC in December of year t or in January of year t + 1.
One threat to inference that we must consider is the possibility of anticipation effects: if utilities anticipate times of legislative debate, then they may begin to lobby earlier. To quantify the sign of any possible bias, such lobbying would induce a downward bias in our estimates of the importance of PTC consideration for lobbying as some of that lobbying would occur in anticipation.
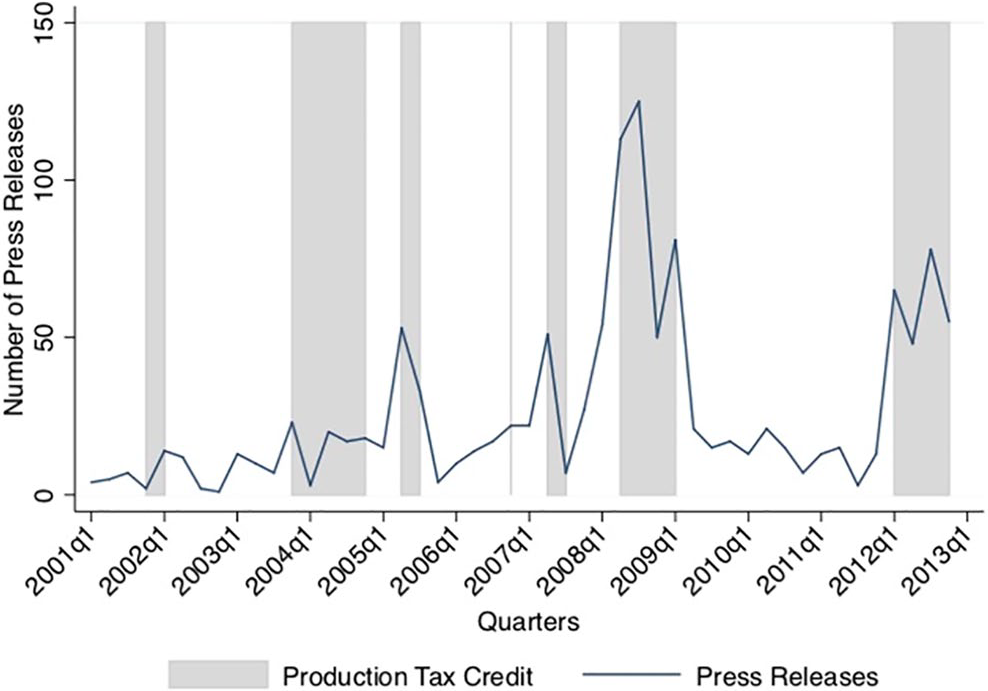
To assess this possibility of a downward bias, Figure 5 shows the number of press releases by Senate and House members, as well as government agencies, mentioning the PTC. Anticipation effects would presumably accompany considerable public attention to the PTC before the beginning of the legislative debate. As the figure shows, press releases are much more common during periods of legislative debate and related lobbying. The data support our coding and alleviate concerns about anticipation effects.Footnote 19
Number of press releases mentioning “Production Tax Credit” and “energy” anywhere in the documents distributed by members of the U.S. Senate and House as well as government agencies, overlaid on periods of legislative activity over the PTC.
Note. PTC = production tax credit.

Our second, less stringent, assumption is that the creation of RPS policies is not determined by lobbying activity on the PTC in particular. While RPS policies are obviously influenced by lobbying, we only need to assume that variation in PTC consideration does not itself determine the likelihood and timing of state-level RPS adoption. This assumption is not very stringent because the timing of PTC consideration is erratic and influenced by factors irrelevant to state policy adoption as discussed in detail above.
Based on Figure 4 above, this assumption appears valid. The number of RPS policies increased almost linearly between the years 2002 and 2010, with no relationship to the fluctuating fortunes of the PTC. Moreover, the literature on RPS policies emphasizes their origins in state economics and politics (Lyon and Yin Reference Lyon and Yin2010; Rabe Reference Rabe2006), with no evidence to suggest that federal policies or the lobbying surrounding them would either directly or indirectly influence RPS adoption.Footnote 20
The third assumption is that RPS adoption, as opposed to other state-level factors, drives differential lobbying efforts over PTC among utilities. The validity of the assumption is not obvious, so we must test it carefully. As there is no reason to believe that pre-RPS adoption years would modify the effect of PTC activity on lobbying, we conduct a placebo test by running the main regressions with a modified RPS variable. This variable codes RPS adoption as 1 for a state for the five-year period before actual RPS adoption. If unobserved state characteristics correlated with RPS adoption condition the effect of PTC activity,Footnote 21 then the modified variable should behave similarly to the actual RPS-adoption dummy. The estimation results are presented in Section A3 in the online appendix. The results show no substantive effects between the placebo RPS and the PTC: across all model specifications, coefficients of the interaction term are not statistically significant. This suggests that RPS adoption, as opposed to other state-level factors, affects utilities’ lobbying behavior when the PTC extension is about to expire or under legislative debate.
When these three assumptions are met, we can estimate the effects of PTC legislative activity on the lobbying behavior of utilities with different levels of exposure to RPS policies. The triple interaction models that further condition the interactive effects of PTC legislative activity and RPS policies on renewable electricity generation capacity are, in turn, based on theoretically partial correlations. Here, we make no claims about causal identification and instead focus on more classical hypothesis testing of ex ante theoretical expectations.
The relationship between state-level lobbying and federal lobbying warrants a comment. It is certainly possible that lobbying on the RPS itself occurs, but such lobbying should not influence the effects of PTC legislative activity on utilities’ federal lobbying. To the extent that lobbying on the RPS reduces resources available for federal lobbying, the resource reductions should affect all kinds of lobbying, as opposed to only lobbying when the PTC is under threat. Thus, resource constraints from lobbying on the RPS should not have a particular effect under PTC legislative activity at the federal level; potential diversion of resources or attention from the federal level would, instead, cause an overall reduction in federal lobbying activity among utilities.
Finally, it should be noted that our analysis may produce a lower estimate of the effects of PTC expiration and RPS, given that the PTC can be credited over a 10-year period. While this does not prevent utilities from developing a new renewable energy project, utilities that had exhausted their 10-year eligibility would have no clear incentives to lobby on the expiration of PTC if they do not have any plans for a new renewable energy project. This suggests that our estimates would be conservative, and the actual effects of PTC expiration and RPS would be higher than our estimate.
Findings
We begin with a presentation of the main results and then add the triple interaction terms to examine winner–loser dynamics. The remainder of the section focuses on the content of lobbying and summarizes a series of robustness checks and placebo tests.
Main Results
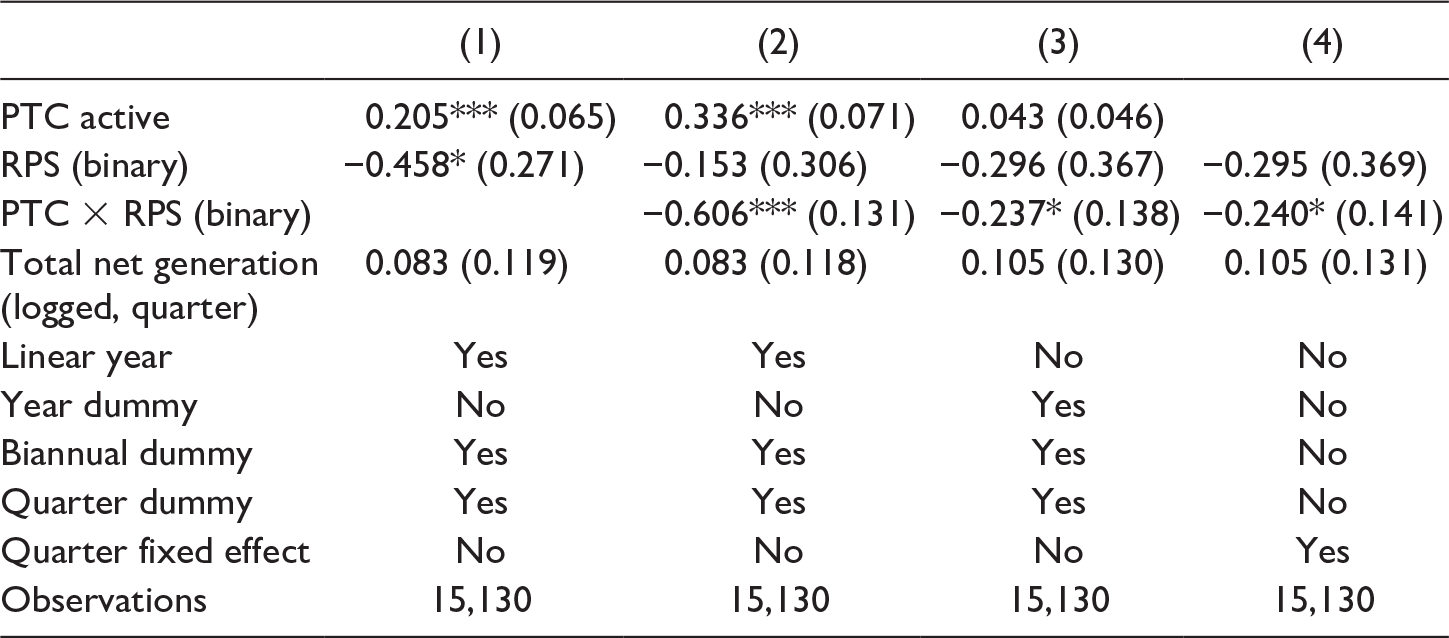
The main estimation results are shown in Table 2. In each set of models, we start by examining the effects of impending PTC expiration and the RPS independently. We then add the interaction term and a different time variable in each of the other models. We use the linear year trend, biannual dummies, and quarter dummies in Models 1 and 2, respectively, and a year-dummy in Model 3. In Model 4, we include quarterly fixed effects to allow nonlinear heterogeneity across time periods.
Effect of PTC Activity on Lobbying by Electric Utilities, 1998–2012.

Note. Clustered standard errors at the state-level in parentheses. Utility FE is included across all models. PTC = production tax credit; RPS = renewable portfolio standard.
*p < .10. **p < .05. ***p < .01.
The results across estimated models provide support for our theoretical expectations. In line with Hypothesis 1, we find that the propensity to lobby goes up when the PTC is about to expire. In Model 1, the coefficient for the PTC renewal variable is positive and statistically distinguishable from 0. The first model indicates that the odds of lobbying by utilities, on average, are 1.2 times larger when there is a threat of PTC expiration, holding other factors constant. RPS on its own reduces lobbying propensity, as indicated by negative coefficients across the models. These findings suggest that the consideration of PTC expiration and the presence of RPS independently influences the probability of lobbying, but only to a modest degree.
More interestingly, the positive effect of possible PTC expiration on the probability of lobbying is substantially reduced in the presence of an RPS, as indicated by the coefficients on the interaction term. The coefficients are negative in their direction and statistically significant at the conventional level across all the specifications. According to Models 2 to 4, when the PTC is about to expire, the probability that utilities operating in RPS states lobby is about 1.3 to 1.9 times those in non-RPS states. These results show the important interactive effect of federal and state policies. PTC expiration at the federal level increases the incentive to lobby in general, but utilities under the influence of state-level RPS are far less likely to be influenced by PTC expiration than utilities operating in a non-RPS state. The results provide empirical support for Hypothesis 2.
Among other variables, one factor that appears to have substantial effects on lobbying propensity is total net generation, which consistently shows strong positive effects across the models. Not surprisingly, large utilities are more likely to lobby, ceteris paribus. This finding is consistent with the previous literature that argues that smaller utilities in general do not individually lobby because they lack the resources and the political power to influence outcomes (Kim, Urpelainen, and Yang Reference Kim, Urpelainen and Yang2016).
Lobbying by Renewable Electricity Generators and Others
The above analysis provides evidence on the substitution effect between the timing of PTC expiration and state-level renewable policies on lobbying behavior. We further hypothesized that the substitution effect might be stronger for utilities with renewable energy capacity than those without. To test this hypothesis, we estimate models with triple interactions to compare the responses of electric utilities with and without renewable electricity generation.
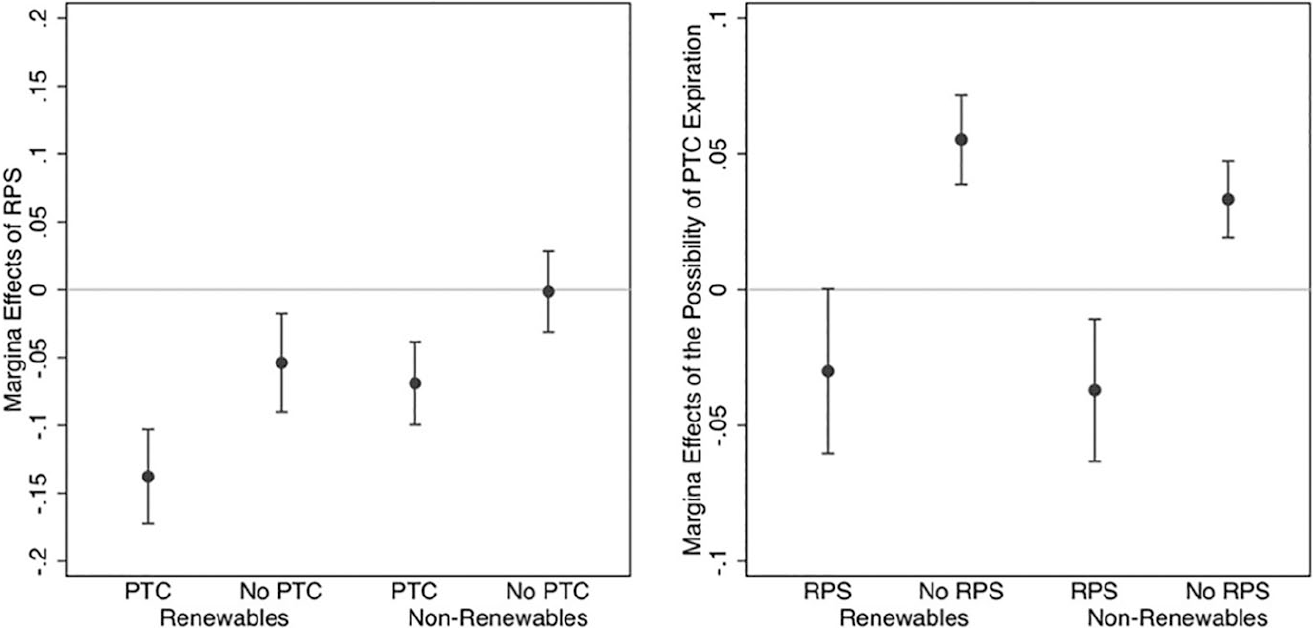
To better describe how possible PTC expiration and renewable energy generation modify the effect of RPS on lobbying probability, we present the marginal effects of RPS under different conditions in Figure 6. The figure clearly demonstrates the difference in direction and magnitude of marginal effects of RPS across the four different conditions. The first notable pattern is the varying effect of RPS depending on PTC legislative activity. For both types of utilities, the negative effect of RPS is more substantial when PTC is about to expire. The second notable pattern is the difference between renewable and nonrenewable energy generators. RPS makes renewable energy generators 14 percentage points less likely to lobby when the PTC is about to expire. This effect translates to a 23% reduction from the average lobbying probability (61.2%). For nonrenewable energy generators, this negative effect is substantially smaller with only a 7 percentage point decrease (or 11% decrease from the average lobbying probability).
Marginal effect of RPS by renewable versus nonrenewable utilities conditional on the consideration of PTC expiration (left); marginal effect of PTC by renewable versus nonrenewable utilities conditional on the presence of RPS (right). The calculation of marginal effects is based on Model 1 in Table A4 in the online appendix.
Note. RPS = renewable portfolio standard; PTC = production tax credit.

We also illustrate how RPS presence and renewable energy generation capacity change the marginal effect of the PTC in the right panel of Figure 6. The effect of possible PTC expiration is strikingly different between utilities in RPS and non-RPS states. For both types of utilities, the possibility of PTC expiration increases the lobbying probability only for non-RPS utilities. Another observed pattern is the higher sensitivity that utilities with preexisting renewable energy generation capacity operating in non-RPS states have toward impending PTC expiration (5 percentage point increase in lobbying probability due to the possibility of PTC expiration) compared with nonrenewable utilities under the same condition (3 percentage point increase).
Intensive and Extensive Margin of Lobbying
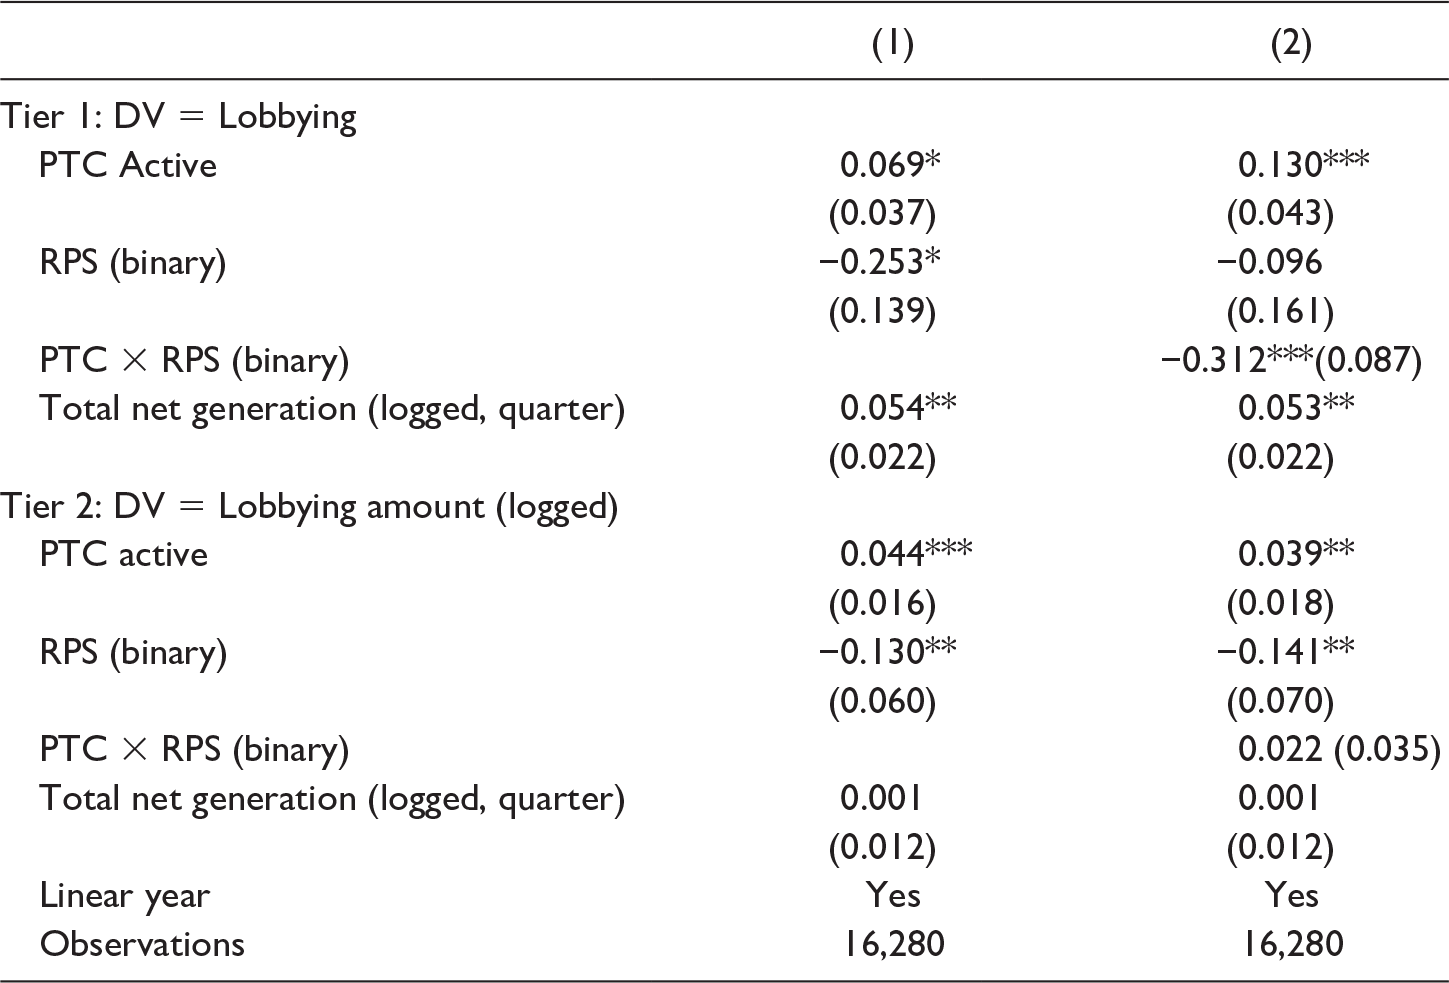
In this section, we investigate the effects of the PTC and RPS on the intensive margin of lobbying—how much is spent on lobbying expenditures when the decision to lobby has been made (Kerr, Lincoln, and Mishra Reference Kerr, Lincoln and Mishra2014). To systematically estimate the effects, we employ a “double hurdle model” (Cragg Reference Cragg1971). Unlike a tobit model, which assumes the same decision-making process for the act of lobbying and the amount spent on the activity, the double hurdle model allows these two decisions to be determined by separate processes (Cragg Reference Cragg1971; Wooldridge Reference Wooldridge2010). We use probit regressions with unconditional utility fixed effects to determine the probability of lobbying by utilities in the first tier, and a truncated ordinary least squares (OLS) regression with utility fixed effects for lobbying expenditures using our base Model 2 in Table 2.
Data on lobbying expenditures were extracted from the mandated lobbying reports. Under the Lobbying Disclosure Act of 1995, lobbying firms must report whether lobbying expenditures were less than US$5,000, as well as the total amount if it exceeds that amount. Therefore, we set the lower truncation limit to US$5,000 in the second tier of the double hurdle models. Also, we utilize the logarithmized value of lobbying expenditures.
The results for the first and second tiers are reported in Table 3. Consistent with the results from our main models, the estimated effect of RPS on lobbying decisions when the PTC is about to expire is negative and robust, as shown in the first-tier results. On the contrary, the second-stage results indicate that there might not be substitution effects between RPS and the PTC on lobbying expenditures. However, the coefficient is not precisely estimated at conventional levels. Such null results imply that there is no difference in lobbying intensity between utilities in RPS and non-RPS states. Combined with the robust effects for the extensive margin of lobbying, such results suggest that utilities operating in states with stringent RPSs adjust their lobbying decisions rather than the amount of lobbying expenses when they face the threat of PTC expiration. In other words, as our theory suggests, the substitution effect of the PTC and RPS decrease utilities’ incentives to lobby in the first place rather than the intensity of lobbying activities.
Estimation Results Using Double-Hurdle Models: Effect of PTC Activity on Lobbying Amount (Logged) by Electric Utilities, 1998–2012.

Note. Standard errors clustered at the state-level in parentheses. Utility FE is included across all models. For Tier 1, the dependent variable is lobbying. For Tier 2, the dependent variable is the logarithmized value of the lobbying amount. FE = fixed effect; PTC = production tax credit; RPS = renewable portfolio standard.
*p < .10. **p < .05. ***p < .01.
Issues Lobbied
Having demonstrated the effect of federal and state policies on the likelihood of lobbying by electric utilities, we next conduct a validity test to investigate whether electric utilities lobby on issues related to energy policy. While lobbying reports do not contain information on whether firms lobby for or against a given policy, firms report on which issues they lobby. We can use information on the lobbied issues to test the validity of our empirical analysis. If electric utilities do not lobby on the energy issue, our analysis would not be valid in testing the effects of energy policy on their lobbying behavior.
We examine the specific lobbying issues described in lobbying reports. The text data we analyze come from the “specific lobbying issues” section in the lobbying reports. In this section, organizations or lobbying firms describe bills or issues that they lobbied on during a given period. Our analysis focuses on observations where this description is available because some do not provide a description of specific lobbying issues. Among the examined lobbying reports in our analysis, 12.8% provide information on specific issues they lobbied on. The degree of specificities of the contents varies greatly across lobbying reports. For instance, the AES Corporation mentions “climate and energy legislation” without further details in their lobbying report in the first quarter of 2009. Invenergy Wind provides more detailed information that they lobbied on the issue of “legislative and regulatory services related to PTC of section 45: H.R. 7060; the Renewable Energy and Job Creation Act of 2008” in their lobbying report of the same quarter.Footnote 22
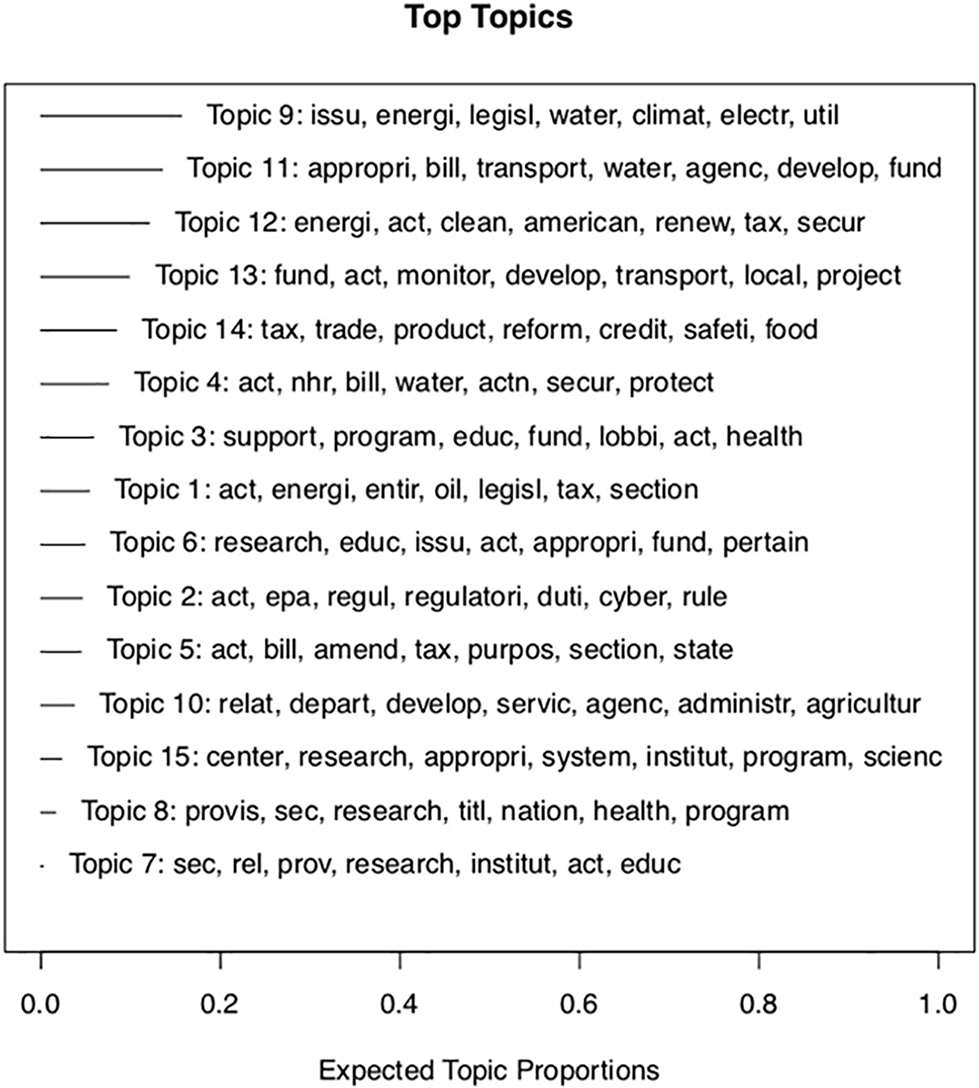
We analyze the contents of specific lobbied issues in the lobbying reports using a topic modeling technique. Specifically, we classify the contents into a number of topics using a text analysis technique, the structural topic model (STM), which enables the discovery of topics from given text data that incorporate information about each document (Roberts et al. Reference Roberts, Stewart, Tingley, Lucas, Leder-Luis, Gadarian, Albertson and Rand2014). We briefly discuss the estimation procedure and visually describe the topic model results and provide a detailed discussion on the estimation and the results in the online appendix (Section A11 in the online appendix).
We utilized the STM R package from preprocessing to estimation. After preprocessing our texts (e.g., removing stop words, stemming), we estimated eight topic models with a varying number of topics from five to 10 and 15 to 40 with an interval of five. After examining the results from various topic model estimations, we select the model with 15 topics (as the results from a larger number of topics do not provide new insights into the reports). Figure 7 presents the proportion of each topic. The most frequently lobbied issue (Topic 9) and the third most frequently lobbied issue (Topic 12) are directly related to the issue of energy.Footnote 23
Expected topic proportions from structural topic model estimation results.
Note. Data for the analysis are from specific lobbying issues in lobbying reports by utilities.

Robustness
As a robustness check, we estimate another set of models by focusing on energy and environment-related lobbying behaviors among electric utilities. The goal is to ensure that our results are not driven by lobbying activities targeted at other irrelevant issues, but instead capture utilities’ incentives to lobby in response to the PTC and RPS. In Table A17 in the online appendix, we report results from specifications that utilize lobbying on energy and environmental issues as the dependent variable. We find the results very similar to the regressions using all lobbying activities by utilities. A negative coefficient on the PTC-RPS interaction term is consistently found and obtained a conventional level of statistical significance in almost all the estimated models.
Placebo Test
We next explore whether the effects we documented are driven by lobbying activities on issues unrelated to renewables. We expect RPS and the PTC to only affect utilities’ incentives to lobby on energy and environmental issues, but not other issues. To verify this, we conduct a placebo test using lobbying on trade issues as the dependent variable. The critical condition for a good placebo test is to choose an issue area that is completely irrelevant to the PTC. This was why trade was chosen over tax even though the former is more frequently lobbied on (35.3% vs. 16.2%). Unlike taxation issues, trade is largely about tariffs and other trade policies, which are irrelevant to the purely domestic PTC. For the classification of lobbied issues, we follow the issue codes provided in the lobbying reports. The dependent variable is coded 1 when utilities lobbied on issues related to trade but not energy and environment, and 0 otherwise.
We present the results with lobbying on trade as dependent variable in Table A20 in the online appendix. There is no evidence of the substitution effect between RPS and the PTC on trade-related lobbying activities. The interaction term appears to be negative but close to 0 and not statistically significant at the conventional level in any of the estimated models. These findings provide support for our proposed mechanism.
Conclusion
We have shown that the dynamics of federal lobbying depend on the state-level policy environments that firms face. Our findings are consistent with our proposed theory that explores how firms respond to an expected change in the federal program and how the responses vary across firms depending on state-level policies. Consistent with our first hypothesis, we have shown that the consideration of PTC expiration increases the probability of lobbying by electric utilities. Such effects of PTC expiration are smaller for utilities that already enjoy benefits of renewable energy policy in states with RPS, which provides support for our second hypothesis. This points to an importance of understanding the variation in the responses of utilities to legislative activity around the PTC. In particular, the presence of an RPS policy reduces the importance of the PTC for both renewable electricity generators and non-generators.
The findings are, first and foremost, important for the literature on lobbying by firms. In contexts with federal structures like the United States, policies formulated in Washington shape outcomes in an environment that is best described as a patchwork of state policies. Opportunities to influence federal policy are shaped by state policies; thus, a comprehensive theory of federal lobbying must consider state policies. Nevertheless, the existing literature has largely focused on lobbying activities either at the state level (e.g., Grasse and Heidbreder Reference Grasse and Heidbreder2011) or at the federal level (e.g., Richter, Samphantharak, and Timmons Reference Richter, Samphantharak and Timmons2009) in isolation, overlooking the possibility that the state-level policies affect incentives to lobby at the federal level. By showing that electric utilities’ lobbying activities concerning the PTC are affected by the state-level RPS policies, our study provides robust evidence about the effects of state policies on the lobbying strategies. Moreover, while causal identification of state policy effects is difficult, our emphasis on windows of opportunity opened by the PTC contributes toward solving this empirical problem and thereby allows for causal estimates. We also see opportunities to adapt and adjust our framework to other federal structures in countries such as Brazil or India, where federal policy affects behavior and outcomes across a wide variety of state contexts.
Although we have focused on renewable energy, we expect our theoretical insights to apply more generally, whenever preexisting state policy shapes the value of federal rules. A natural extension of this study would be to examine the effects of state-level taxation on federal lobbying. Tax issues are an important lobbying priority for all firms (Richter, Samphantharak, and Timmons Reference Richter, Samphantharak and Timmons2009), but they may face different incentives given a significant variation in tax rates across states (Hayes and Dennis Reference Hayes and Dennis2014). Another interesting case would be to explore the effects of state adoption of the Tax and Expenditure Limitations that impose limits on annual expenditures or revenue growth (New Reference New2010). In states with stringent expenditure limitations, education or health care industries may become more sensitive to federal spending and increase their federal lobbying efforts. Our study can also be pertinent to trade policy. State governments can adopt policies that limit discrimination in government procurement (e.g., the Agreement of Government Procurement of the World Trade Organization), which creates considerable variation in trade policy across states (Kim Reference Kim2009). This may affect firms’ incentives for federal lobbying in trade policy.
The results are also of importance to the literature on renewable energy policy. The literature has long emphasized state-level characteristics in renewable energy policy making (e.g., Carley and Miller Reference Carley and Miller2012; Lyon Reference Lyon2016; Rabe Reference Rabe2004; Stokes and Breetz Reference Stokes and Breetz2018). Our study adds to the literature by identifying how state policies influence the federal-level lobbying by electric utilities. The normative implications of this observation depend on the balance of lobbying power between pro-renewable and anti-renewable lobbyists. On one hand, reduced lobbying by pro-renewables interests may undermine the political stability of the PTC because their decision not to lobby on the PTC can be interpreted as a signal that the PTC is not essential for the renewable energy industry. On the other hand, reduced lobbying by anti-renewable interests may reduce political uncertainties and conflicts surrounding the PTC, possibly stabilizing it as a central federal policy to promote renewables in the future. While the PTC had successfully been renewed, we now begin to observe that the balance between the two forces might have tipped against the PTC. While the PTC for wind is expected to phase out by 2020, even AWEA has not indicated any intention to push for another extension.Footnote 24 Our study suggests, to the extent that RPS policies in individual states reflect the power of renewable energy generators, it is likely that these policies undermine federal pro-renewables lobbying on balance, as the opponents of RPS policies are concentrated in states with at best weak policies.
Acknowledgments
Sung Eun Kim would like to thank the Korea University Grant (No. K2002041) for support for this research. Joonseok Yang is grateful for support from the Program in Corporate Welfare Studies at the University of California, Irvine for this research. The authors would also like to thank In Song Kim and Alexander Hertel-Fernandez for their excellent comments on the previous draft of the mansucript.
Declaration of Conflicting Interests
The author(s) declared no potential conflicts of interest with respect to the research, authorship, and/or publication of this article.
Funding
The author(s) received no financial support for the research, authorship, and/or publication of this article.
ORCID iD
Joonseok Yang https://orcid.org/0000-0003-2895-6365
Supplemental Material
Supplemental material for this article is available online.
Author Biographies
Sung Eun Kim is an assistant professor at the Department of Political Science and International Relations at Korea University. Her research interests include International Relations, and Comparative and International Political Economy, with a focus on the strategic use of information by political elites and interest groups.
Johannes Urpelainen is the Prince Sultan bin Abdulaziz professor of Energy, Resources and Environment at the Johns Hopkins School of Advanced International Studies and the Founding Director of the Initiative for Sustainable Energy Policy. His primary research focuses on environmental politics, energy policy, and global governance.
Joonseok Yang is an assistant professor in the Department of Political Science & Diplomacy at Sungkyunkwan University, Seoul, South Korea. His research explores the political economy of business-government relations.