INTRODUCTION
Thin loess deposits have long been recognized on the uplands of the southeastern Colorado Plateau, along with dune sands derived largely through weathering and reworking of sandstone bedrock (Thorp et al., Reference Vandenberghe1952; Hunt, Reference Hunt1956; Arrhenius and Bonatti, Reference Arrhenius and Bonatti1965; Price et al., Reference Price, Nettleton, Bowman and Clay1988; Wells et al., Reference Williams1990). In addition, modern eolian dust is ubiquitous in the region and has been incorporated into surface and buried soils during the late Quaternary (Reheis et al., Reference Reheis, Reynolds, Goldstein, Roberts, Yount, Axford, Cummings and Shearin2005; Reynolds et al., Reference Reynolds, Reheis, Yount and Lamothe2006b). Dust inputs to soils have a large influence on soil contents of macro- and micronutrients (e.g., Syers et al., Reference Thorp, Smith, Baldwin, Bowser, Flint, Gould, Moss, Reed, Smith and Trowbridge1969; Chadwick et al., Reference Chadwick, Derry, Vitousek, Huebert and Hedin1999; Reynolds et al., Reference Reynolds, Reheis, Neff, Goldstein and Yount2006a; Field et al., Reference Field, Belnap, Breshears, Neff, Okin, Whicker, Painter, Ravi, Reheis and Reynolds2009). The presence of loess and dust-affected soils is important to agriculture today and was important to native cultures in the past. For example, the Mesa Verde (MV) peoples are thought to have farmed the loess soils extensively on the mesa tops (Rohn, Reference Rohn1963; Wyckoff, Reference Wyckoff1977). Today, dryland farming exploits loess soils on the Sage Plain in southwestern Colorado and adjacent Utah to produce crops such as pinto beans (Phaseolus vulgaris, pinto group). However, there have been few studies of soils formed on loess in this area (Arrhenius and Bonatti, Reference Arrhenius and Bonatti1965; Price et al., Reference Price, Nettleton, Bowman and Clay1988; Steensen, Reference Steensen1992), and the ages of loess deposits are known from only a few radiocarbon dates (Arrhenius and Bonatti, Reference Arrhenius and Bonatti1965; McDonald et al., Reference McDonald, Neusius and Clay1987). Previous studies have proposed upwind floodplains or exposed bedrock as loess sources, but no chemical or mineralogical analyses have been conducted to identify sources. Sand dunes and sand sheets and their pedogenesis have been better studied and dated (Wells et al., Reference Williams1990; Reheis et al., Reference Reheis, Reynolds, Goldstein, Roberts, Yount, Axford, Cummings and Shearin2005; Ellwein et al., Reference Ellwein, Mahan and McFadden2011, Reference Ellwein, Mahan and McFadden2015).
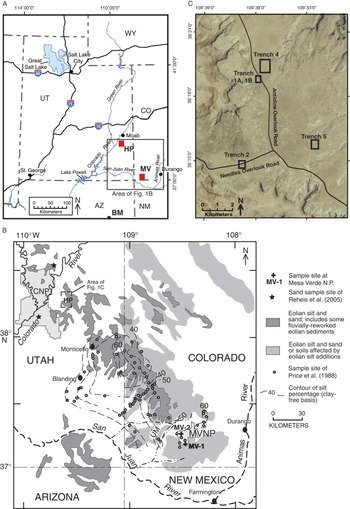
The goals of this article are to describe the loess and soils that are preserved on mesas in the Hatch Point (HP) area of Canyonlands and on MV (Fig. 1), discuss the timing of deposition using new age data, and infer the potential sources of these loess deposits using particle-size, chemical, and magnetic data. The study was originally motivated by recognition that geomorphology and soils may influence boundaries between shrubland and grassland ecosystems in the study area. Shrubland ecosystems dominated by sagebrush (Artemisia tridentata) and grassland ecosystems dominated by native perennial grasses (e.g., Hilaria jamesii and Sporabolis sp.) are high-priority conservation targets for resource managers because of their diversity, productivity, and vital importance as wildlife habitat. The complex soil patterns that appeared to be present in the subsurface on the basis of soil sampling across vegetation boundaries led to an effort to understand these patterns better by excavating backhoe trenches on HP mesa (Fig. 1C; Goldstein et al., Reference Goldstein, Miller, Yount, Reheis, Reynolds, Belnap, Lamothe and McGeehin2009). Loess and reworked loess deposits encountered in these trenches and in auger holes displayed weakly to moderately developed surface and buried soils. In many locations, it appeared that a shallow depth (~50 cm) to a buried soil favored the presence of shrubs versus grasses. We sampled and analyzed the soils and sediments and used optically stimulated luminescence (OSL) dating to assess deposit ages. As similar deposits and soils were identified by previous studies in Mesa Verde National Park (MVNP; Fig. 1A and B; Arrhenius and Bonatti, Reference Arrhenius and Bonatti1965) and may be readily seen in the walls of some archaeological excavations on the mesa top, we extended the geographic scope of the project by obtaining OSL ages at two sites within this park.
(color online) Location maps for study sites. (A) Index map showing major drainages, highways, and towns. BM, Black Mesa; HP, Hatch Point mesa; MV, Mesa Verde. (B) Map of the Four Corners area showing settings of the two study sites relative to areas mapped as having eolian-affected soils. Contour lines and dots taken from Price et al. (Reference Price, Nettleton, Bowman and Clay1988). Map and shaded areas modified from Bettis et al. (Reference Bettis, Muhs, Roberts and Wintle2003), compiled from Price et al. (Reference Price, Nettleton, Bowman and Clay1988), O’Sullivan and Beikman (Reference O’Sullivan and Beikman1963), Williams (Reference Wyckoff1964), and Haynes et al. (Reference Haynes, Vogel and Wyant1972). CNP, Canyonlands National Park; HP, Hatch Point study area; MV-1 and MV-2, locations of Mesa Verde sample sites; MVNP, Mesa Verde National Park; UM, Ute Mountain laccolith. (C) Aerial photograph of trench locations on Hatch Point mesa. For details, see Goldstein et al. (Reference Goldstein, Miller, Yount, Reheis, Reynolds, Belnap, Lamothe and McGeehin2009).

Geographic setting
The eastern Colorado Plateau is characterized by deep dissection by the Colorado River and its tributaries into mesas capped by resistant Mesozoic sandstones. In the HP area of Canyonlands, mesa tops at an elevation of about 1800 m lie 600–700 m above the Colorado River 15 km to the west (Fig. 1B). The mesas at MVNP in Colorado are higher, sloping south from about 2500 to 2000 m, and have a similar geomorphic setting above tributaries of the San Juan River (Fig. 1B) that are incised about 400 m below the mesa tops. Gently rolling uplands in the Sage Plain region between MV, Colorado, and Monticello, Utah, have long been recognized to be covered by loess deposits (Hunt, Reference Hunt1956; Haynes et al., Reference Haynes, Vogel and Wyant1972; Price et al., Reference Price, Nettleton, Bowman and Clay1988).
Most geologists working in the Sage Plain region mapped silty deposits as loess, whether deposited in situ (primary) or transported (reworked) (Hinrichs et al., Reference Hinrichs, Connor, Moore and Krummel1971; Haynes et al., Reference Haynes, Vogel and Wyant1972). The two forms are difficult to discriminate because primary loess can exhibit bedding such as faint laminations (Muhs, Reference Muhs2007). Carrara (Reference Carrara2012) showed primary loess capping upland surfaces in MVNP, whereas Price et al. (Reference Price, Nettleton, Bowman and Clay1988), examining a larger area, referred to the upland deposits as “eolian deposits” or “eolian-influenced soils.” Soils examined in the park by Arrhenius and Bonatti (Reference Arrhenius and Bonatti1965) had particle-size distributions and structure consistent with primary loess.
There are two potential sources of loess in the study area: floodplains and exposed bedrock. Previous studies inferred that an increase in percentage of silt with distance to the northeast (downwind) from the San Juan River (Fig. 1B) suggests that the river is a primary source of loess in this region (Price et al., Reference Price, Nettleton, Bowman and Clay1988; Bettis et al., Reference Bettis, Muhs, Roberts and Wintle2003), along with exposed fine-grained Mesozoic rocks. However, the mesas around HP are 100 km north of the San Juan River, and the nearby Colorado River is deeply incised into bedrock with limited floodplain deposits. Thus, a more likely source for loess at HP may be erosion of local sedimentary rocks or possibly long-distance transport.
Previous work
Loess deposits were recognized and mapped in the southeastern Colorado Plateau as early as Thorp et al. (Reference Vandenberghe1952) and Hunt (Reference Hunt1956). The loess has been described as a relatively thin blanket on upland surfaces, generally 1–2 m thick (soil survey data in Price et al., Reference Price, Nettleton, Bowman and Clay1988; Bettis et al., Reference Bettis, Muhs, Roberts and Wintle2003) and locally up to 3 m thick on MV (Arrhenius and Bonatti, Reference Arrhenius and Bonatti1965). However, soil surveys do not always measure the full thickness of sediments, and measurements taken from outcrops may be minimum estimates of average thickness because outcrops tend to lie near the eroding edges of mesa tops. Two studies noted loess as much as 6 m thick at sites east of Monticello (Fig. 1B) (Steensen, Reference Steensen1992) and south of Blanding (Biggar et al., Reference Biggar, Harden and Gillam1981). Carrara (Reference Carrara2012) estimated a maximum thickness of 3–5 m for loess on MV. The distribution of eolian silt and sand and eolian silt-affected soils shown in Figure 1B was compiled by D. Muhs (in Bettis et al., Reference Bettis, Muhs, Roberts and Wintle2003) from several sources, including Price et al. (Reference Price, Nettleton, Bowman and Clay1988) for Colorado and adjacent Utah, and several geologic maps, which varied greatly in their discrimination of eolian units (O’Sullivan and Beikman, Reference O’Sullivan and Beikman1963; Williams, Reference Wyckoff1964; Haynes et al., Reference Haynes, Vogel and Wyant1972). This compilation likely includes large areas of dune sand. For example, satellite imagery indicates that the area depicted in Utah and Arizona south of the San Juan River is probably covered by linear sand dunes and sheet sands rather than loess.
The earliest attempt to date the loess at MV (Fig. 1B) was part of a large archaeological investigation in the 1960s. Arrhenius and Bonatti (Reference Arrhenius and Bonatti1965) identified three loess units and two buried soils exposed in two excavations on Chapin Mesa. They attempted to date the units at one of the sites using radiocarbon assays of organic and inorganic carbon (soil carbonate). The upper two units yielded mid-Holocene ages, whereas the basal loess unit gave ages of 21 and >35 ka. However, these ages are suspect given the known issues with dating pedogenic organic carbon and soil carbonate. Further efforts to define and date stratigraphic units and paleosols occurred in the 1970s when the Paleozoic salt deposits in the region were being considered for nuclear waste storage. Biggar et al. (Reference Biggar, Harden and Gillam1981) reported multiple calcic soils formed in about 6 m of loess south of Blanding, Utah, and inferred that the oldest was of “pre-Wisconsin” age. Steensen (Reference Steensen1992) used estimated carbonate accumulation rates (method of Machette, Reference Machette1985) to infer the ages of the soils and loess units in the western Sage Plain between Monticello and Blanding (Fig. 1B). He defined four loess units on the basis of soil morphology and correlated among sites using the relative degree of development of soil carbonate horizons. Buried soils developed on Qe1, the oldest, displayed stage III–IV carbonate morphology, and had an estimated age range of more than 270 ka to about 100 ka. Buried Qe2 soils were estimated to range from 43 to 25 ka. Buried Qe3 soils had carbonate accumulation ages of 13–8 ka, and Qe4 (surface) soils had estimated ages of 5.2–1.8 ka. The only numerical age on loess in the study area was reported by McDonald et al. (Reference McDonald, Neusius and Clay1987), who described a partial skeleton of a fossil musk ox (Ovibos moschatus) 1.15 m below the surface within the youngest loess present at one site in southwest Colorado. They obtained a 14C age on bone collagen of 15,970±155 yr BP. Price et al. (Reference Price, Nettleton, Bowman and Clay1988) used this age to infer that most of the eolian deposition in the southeastern Colorado Plateau was completed by the beginning of the Holocene, in contrast to interpretations of Holocene loess deposition by Arrhenius and Bonatti (Reference Arrhenius and Bonatti1965) and Steensen (Reference Steensen1992).
METHODS
Soil and sediment samples
The five trenches at the HP study area (Fig. 1C; altitudes of ~1900–1920 m) were excavated across shrub-grass vegetation boundaries using a backhoe (see Goldstein et al., Reference Goldstein, Miller, Yount, Reheis, Reynolds, Belnap, Lamothe and McGeehin2009, for details of description and sampling). The trenches exposed 1–2 m of loess and reworked loess. One wall of each trench was gridded in 1 m squares using a level line, nails, and string. After delineating and describing the stratigraphic units, two soil profiles were described and sampled in representative locations under shrub versus grass cover.
In MVNP (Fig. 1B), we were permitted to sample two sites where previous disturbance had occurred and loess was known to be present. MV-1 exposed ~1.3 m of loess at an altitude of 2080 m near the southern park boundary on Chapin Mesa. MV-2 exposed ~1.6 m of loess at 2455 m on the north end of Chapin Mesa. At both sites, we dug back into the slope to expose vertical faces and fresh material for describing and sampling.
Samples were analyzed at the U.S. Geological Survey (USGS) soils and magnetics laboratories (Denver, CO) for calcium carbonate content, particle-size distribution, and magnetic properties (data for HP soils are in Goldstein et al. [Reference Goldstein, Miller, Yount, Reheis, Reynolds, Belnap, Lamothe and McGeehin2009], and data for MV soils and samples of Cliff House Sandstone are in Supplementary Tables 1–5). The soil analyses followed the protocols outlined in Singer and Janitzky (Reference Singer and Janitzky1986), except that particle size was determined using a laser analyzer. Prior to particle-size analysis, all samples were prepared by digesting organic matter and CaCO3 using 30% H2O2 and 10% HCl, respectively, and sodium hexametaphosphate was added to each sample to deflocculate clays. Magnetic properties were determined on the <2-mm-size fraction and included low-frequency (600 Hz) and high-frequency (6000 Hz) magnetic susceptibility (MSlf, MShf), anhysteretic remanent magnetization (ARM), and isothermal remanent magnetization imparted in opposite directions at 1.2 Tesla (IRM1.2T) and 0.3 Tesla (IRM−0.3T). These properties and methods are described in Goldstein et al. (Reference Goldstein, Reynolds, Reheis, Yount and Neff2008, Reference Goldstein, Miller, Yount, Reheis, Reynolds, Belnap, Lamothe and McGeehin2009). Briefly, magnetic susceptibility (MS) is a measure primarily of the concentration of magnetite (Fe3O4) but with possible contribution from other paramagnetic Fe-bearing minerals. Frequency-dependent MS [FDMS, expressed as a percentage (((MSlf − MShf)/MSlf) × 100)] is a measure for ultrafine particles of iron oxide, commonly used to assess the amount of pedogenic magnetite and maghemite in soils. The IRM−0.3T parameter is a measure of magnetite without those other mineral contributors and is thus preferred as a more reliable indicator of magnetite concentration than is MS. Hard IRM (HIRM) [(IRM1.2T + IRM−0.3T)/2; King and Channel, Reference King and Channel1991] is a measure of the ferric oxide (hematite and goethite) content.
Bulk geochemical analysis was performed on the finely ground <2 mm fraction by inductively coupled plasma atomic emission spectrometry (Briggs, Reference Briggs2002), inductively coupled plasma mass spectrometry (Briggs and Meier, Reference Briggs and Meier2002), and instrumental neutron activation analysis techniques (Budahn and Wandless, Reference Budahn and Wandless2002).
Age determinations
We obtained OSL dates on selected loess deposits after thorough examination of stratigraphy and soil development. Samples were taken from trench and outcrop walls by using PVC pipe hammered horizontally and, in the trenches, by excavating large blocks where the sediment was highly cohesive and/or cemented. Samples were protected from light by wrapping the capped ends of the PVC with electrical tape and by wrapping the blocks in thick black plastic tarps.
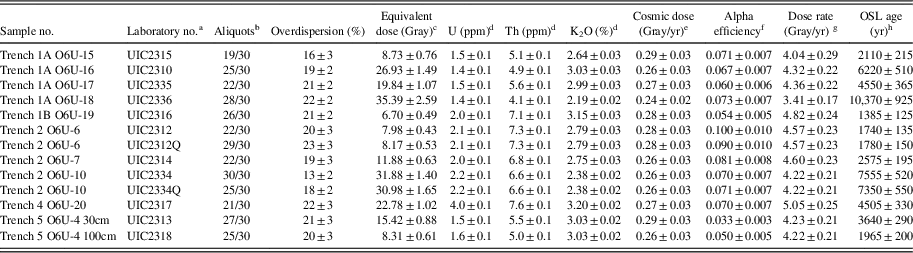
OSL ages from the HP trenches were determined at the Luminescence Dating Research Laboratory, University of Illinois at Chicago using single aliquot regeneration (SAR) protocols (Murray and Wintle, Reference Murray and Wintle2003; Rhodes, Reference Rhodes2011) (for details of procedures, see Supplementary Data for HP OSL). The 4–11 µm fraction was used for the age determinations to avoid coarser grains derived from adjacent outcrops that might not have been sufficiently exposed to sunlight during transport. Most of the ages are on the polymineral fraction. For comparison, we also analyzed the 4–11 µm quartz fraction of two of the samples (Table 1). Dose rates are assumed to be the same for both fractions because of the small grain size.
Optical ages and data for fine-grained polymineral and selected quartz extracts for loess from Hatch Point mesa, Canyonlands, Utah.

a Fine-grained (4–11 μm) polymineral fraction analyzed with a prior infrared (880±40 nm) exposure and subsequent blue-light excitation (470±20 nm) by single aliquot regeneration protocol (cf. Banerjee et al., Reference Banerjee, Murray, Bøtter-Jensen and Lang2001; Murray and Wintle, Reference Murray and Wintle2003). “Q” designates the fine-grained quartz extract from digestion of the polymineral sample in hydrofluosilicic acid (silica saturated) for 6 days (Roberts, Reference Roberts2007), subsequently analyzed by single aliquot regeneration protocols (Murray and Wintle, Reference Murray and Wintle2003).
b Aliquots used in equivalent dose calculation versus number of aliquots measured.
c Equivalent dose calculated using the central age model of Galbraith et al. (Reference Galbraith, Roberts, Laslett, Yoshida and Olley1999), in reference to overdispersion values <25%.
d U, Th, and K2O content analyzed by inductively coupled plasma mass spectrometry analyzed by Activation Laboratory LTD, Ontario, Canada.
e From Prescott and Hutton (1994).
f Alpha efficiency (A) value calculated from equation in Aitken and Bowman (Reference Aitken and Bowman1975).
g Includes a moisture content of 5±2%.
h All errors are at 1 sigma and calculated in a quadrature. Ages from the reference year AD 2000 and rounded to nearest half decade.
OSL ages from the MV locations were determined on the 180–250 µm quartz fraction (Duller, Reference Duller2008) at the USGS Luminescence Geochronology Laboratory (Denver). SAR procedures used by the USGS laboratory follow Murray and Wintle (Reference Murray and Wintle2003), Gray et al. (Reference Gray, Mahan, Rittenour and Nelson2015), Nelson et al. (Reference Nelson, Gray, Johnson, Rittenour, Feathers and Mahan2015), and internal protocols (for details, see Supplementary Data for MV OSL).
We also dated charcoal from the contact between unit 1 and 2 in trench 1A using radiocarbon methods. Charcoal was sampled using a metal trowel and placed into a plastic bag. The charcoal received a standard acid-alkali-acid pretreatment at the 14C laboratory of the USGS (Reston, VA), and the age was determined by accelerator mass spectrometry at the Center for Accelerator Mass Spectrometry, Lawrence Livermore National Laboratory, Livermore, California. The 14C age was corrected for δ13C content and calibrated using the CALIB program of Reimer et al. (Reference Reimer, Bard, Bayliss, Beck, Blackwell, Ramsey and Buck2013).
SITE DESCRIPTIONS AND DATES
Hatch Point sites
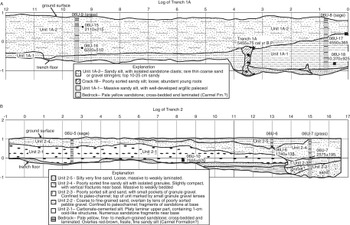
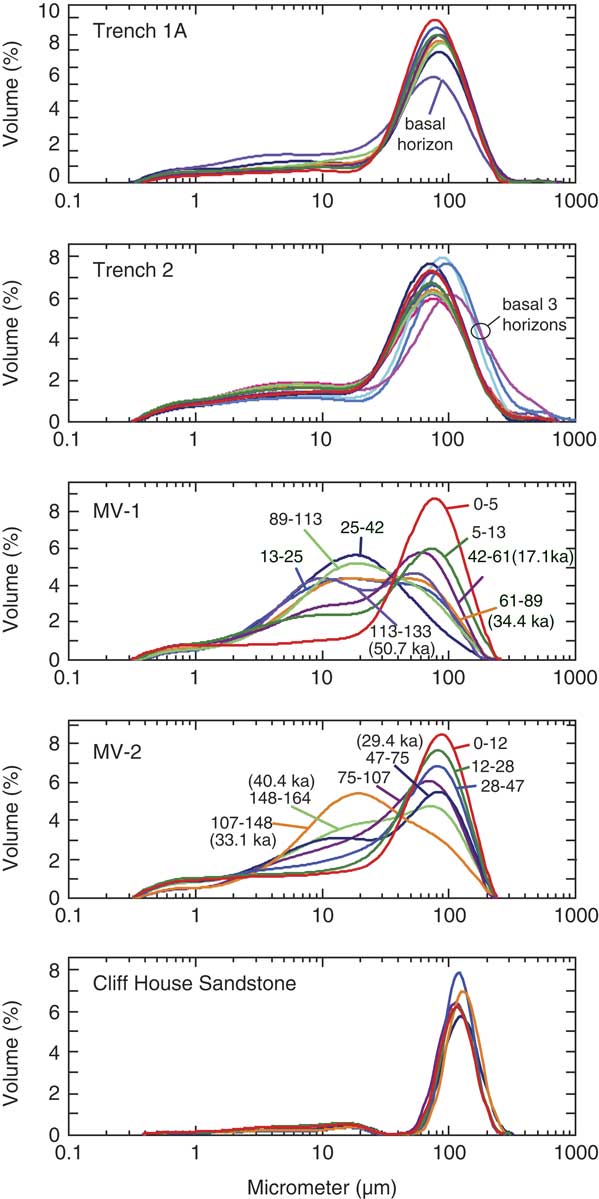
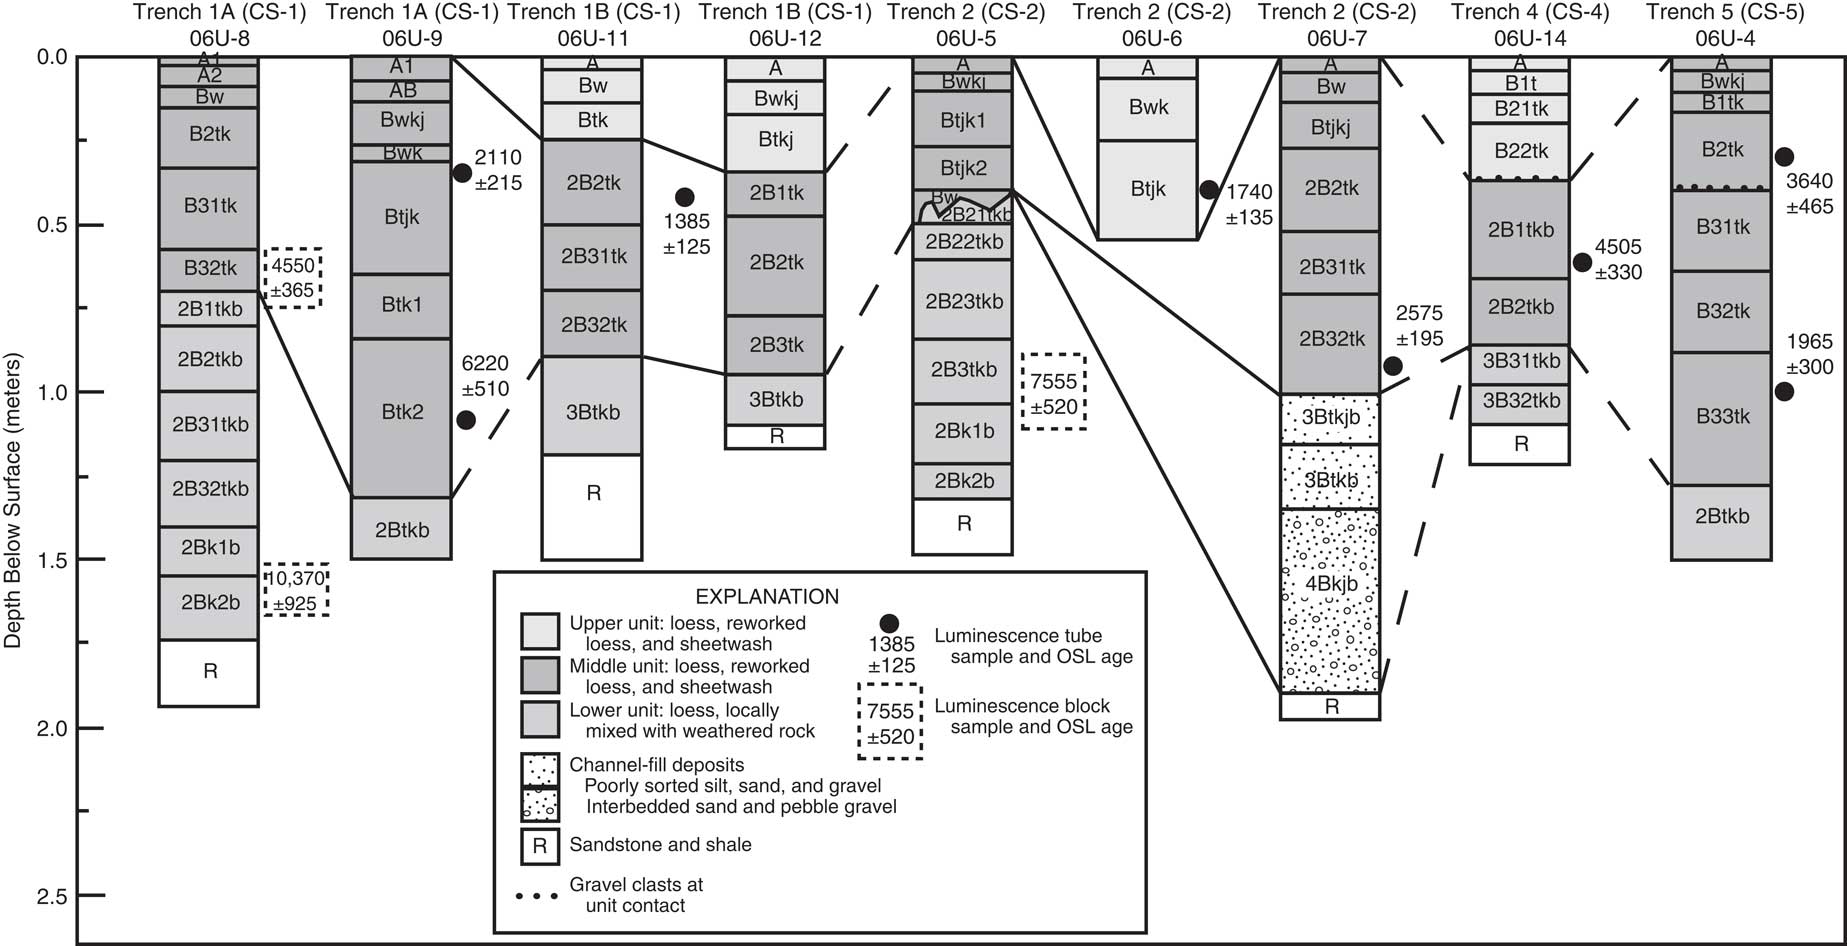
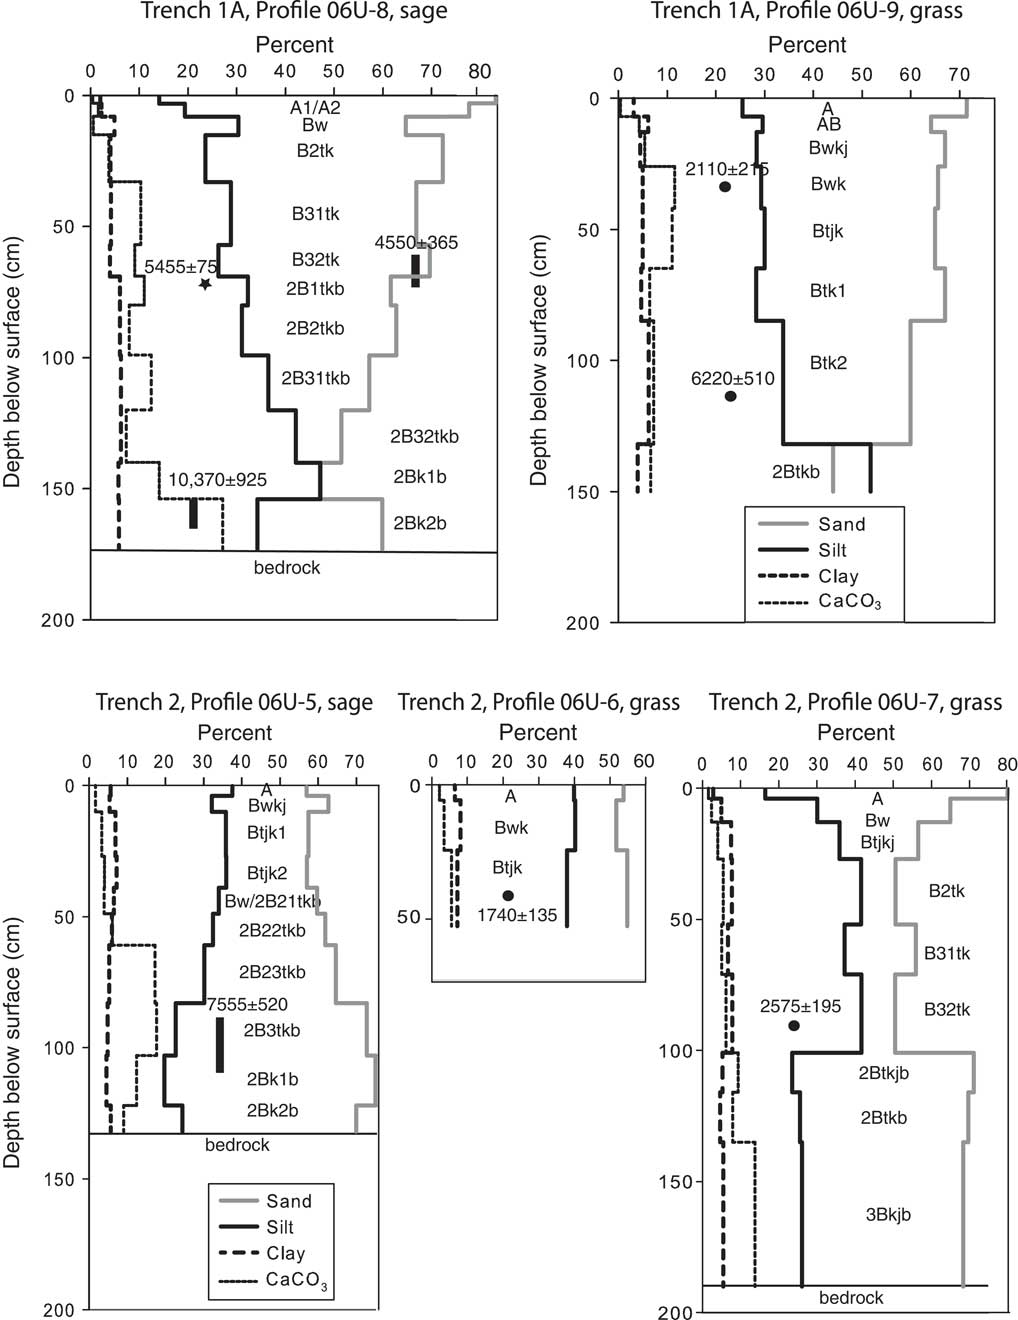
The backhoe trenches on HP mesa were located on undissected, gently sloping surfaces (Fig. 2) underlain by Navajo Sandstone (Hinrichs et al., Reference Hinrichs, Connor, Moore and Krummel1971). All the trenches exposed two or three loess and (or) reworked loess units overlying bedrock (Fig. 2; see Goldstein et al. [Reference Goldstein, Miller, Yount, Reheis, Reynolds, Belnap, Lamothe and McGeehin2009] for full descriptions and logs of trenches 1B, 4, and 5 not shown here). The particle-size distribution of most of the sampled deposits is unimodal, having a peak between 70 and 80 µm (Fig. 3). The exceptions are the basal 1–3 horizons in each profile, which shift to a peak mode at about 100 µm and tend to have a broad low secondary mode between 2 and 10 µm. This shift may be caused by mixing with the underlying weathered bedrock. The primary mode of very fine sand suggests a nearby source of loess (Vandenberghe, Reference Wells, McFadden and Schultz2013). Because the silt fraction in the samples is generally less than 50% (except in trench 4), the deposits are considered silty sand or sandy loess, but for brevity, we will refer to them as “loess.” Trench 2 is an exception; this trench was cut across a shallow swale and exposed a buried channel. This channel was incised into the oldest loess and was later partly filled with alluvial sand and gravel capped by younger loess and reworked loess.
Representative trench logs for trenches 1A and 2 on Hatch Point mesa. Shaded vertical boxes are locations of soil profiles and samples; horizontal lines within boxes are soil horizon boundaries. Black squares are sediment blocks sampled for optically stimulated luminescence (OSL) dating; black circles are OSL sediment cores. OSL ages shown with 1 standard deviation. Star in trench 1A is location of charcoal sample, shown with calibrated age.

(color online) Representative particle-size distributions (U.S. Department of Agriculture scale) for sediments at Hatch Point and Mesa Verde. Hatch Point: Trench 1A, profile 06U-9. Trench 2: coarser peaks are the basal alluvial units of profile 06U-7. Mesa Verde: MV-1: note strong bimodal character of most samples; peak strength varies with depth. MV-2: note dominantly coarser mode of most samples; overall, profile coarsens upward. Cliff House Sandstone: samples display consistent strong peaks at 100 µm.

The lowest unit is composed of massive, well-sorted loess having a buried, moderately developed soil with an argillic horizon and a Bk horizon with stage II–III carbonate (see Goldstein et al., Reference Goldstein, Miller, Yount, Reheis, Reynolds, Belnap, Lamothe and McGeehin2009, for detailed soil descriptions). Buried soils with similar characteristics formed in loess are also present in all the other trenches (Fig. 4).
Correlation among soil and stratigraphic units exposed in trenches on Hatch Point mesa. Solid correlation lines indicate contacts physically traced in a single trench; dashed lines indicate correlations on the basis of soil and sediment properties. See Figure 1C for locations.

A middle unit overlies the lowest loess in every trench; this unit is variably composed of loess, reworked loess, and minor sheetwash. Reworked loess is composed of sediment with the same particle-size distribution as the sandy loess in the lower unit but locally displays faint bedding or poor sorting suggestive of redeposited loess. Sheetwash is generally similar in particle size but displays more obvious bedding and locally contains stringers of granule- to pebble-sized clasts apparently derived from nearby sandstone outcrops. The middle unit is characterized by a soil that displays evidence of clay translocation (a cambic or argillic Bt horizon) and stage I–II carbonate but is more weakly developed than the buried soil on the lower loess (Goldstein et al., Reference Goldstein, Miller, Yount, Reheis, Reynolds, Belnap, Lamothe and McGeehin2009).
In trenches 1B, 2, and 4, the middle unit is buried by an upper unit also variably composed of loess, reworked loess, and sheetwash (Fig. 4). A weak soil having a Bw horizon with structure but little or no evidence of clay translocation and only stage I carbonate formed on the upper unit. In trenches 2 and 4, the upper unit and surface soil overlie a buried soil on the middle unit. However, in profiles 06U-11 and -12 in trench 1B, the surface soil appears to transition into the middle unit without evidence for a buried soil.
Soil descriptions
Most of the soils formed on all three units exposed in the trenches have ochric epipedons underlain by argillic and calcic horizons. They classify as Ustic Calciargids (with argillic horizon) or Ustic Haplocambids (no argillic horizon) in the U.S. Department of Agriculture (USDA) soil taxonomic system (Soil Survey Staff, 1996). However, the soil series mapped in this area is Begay sandy loam, which typically does not have an argillic horizon (http://casoilresource.lawr.ucdavis.edu/gmap/ [accessed May 24, 2017]). The soils on the three loessial units can be distinguished by their increasing degree of profile development, described previously, with relative unit age. Most of the soil samples are fine sandy loams, or loams where sand content is lower (Fig. 5; Goldstein et al., Reference Goldstein, Miller, Yount, Reheis, Reynolds, Belnap, Lamothe and McGeehin2009). Clay content rarely exceeds 10% even in argillic B horizons. Carbonate content is as high as 20–25% in soils formed on the oldest loess unit, especially where bedrock is shallow, but does not exceed 10–12% in the soils on the two younger units. In both the middle and older loess units, clay films (Bt designation) are generally present throughout the B horizons even where the combined B horizons exceed a meter in thickness (Figs. 4 and 5). We interpret this to mean that soils were forming on the older two units during gradual accretion of loess and reworked loess, yielding cumulic soil profiles.
CaCO3, sand, silt, and clay percentages for representative soil profiles in trenches 1A and 2. Dots are optically stimulated luminescence (OSL) tube samples with dates (1 standard deviation); black bars are OSL block samples. Star in trench 1A is location of charcoal sample with calibrated radiocarbon age.

Chemical and magnetic properties
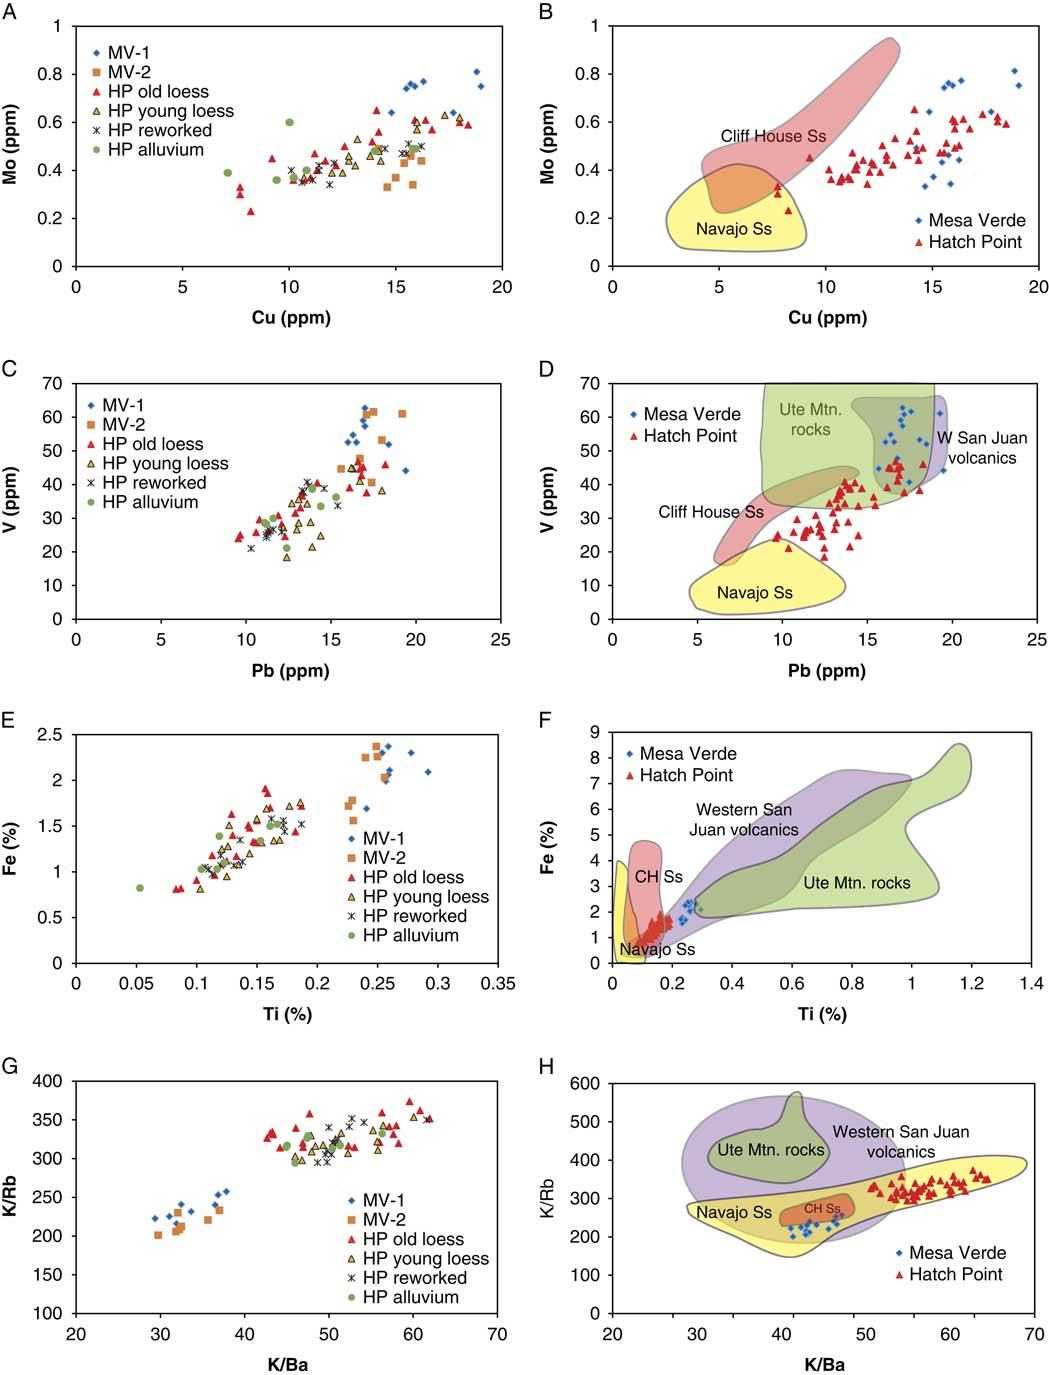
Chemical analyses (Fig. 6A, C, E, and G; data in Goldstein et al., Reference Goldstein, Miller, Yount, Reheis, Reynolds, Belnap, Lamothe and McGeehin2009) show that all units exposed in the HP trenches are derived from a similar source, consistent with the particle-size analyses. The chemistry also demonstrates that the reworked loess and sheetwash inferred to be derived in part from loess have the same composition as the primary loess deposits. Ratios of K, Ba, and Rb, elements that are largely carried in feldspars, can be used to discriminate sediment sources (Muhs et al., Reference Muhs2017). To compare with HP samples, we obtained elemental data for rocks in potential source areas of the HP loess, including samples of the Navajo Sandstone (Goldstein et al., Reference Goldstein, Reynolds, Reheis, Yount and Lamothe2007; Reynolds et al., Reference Reynolds, Goldstein and Miller2010; Phillips et al., Reference Phillips, Morris, Tingey and Eggett2015) in central and eastern Utah and samples of volcanic rocks that dominate the San Juan River headwaters (Lipman, Reference Lipman2004). HP samples contain relatively high values of K/Ba and lie within a small range of K/Rb values (Fig. 6H; K/Cs ratios are similar, not shown). HP samples lie well within the envelope defined by ratios of the Navajo Sandstone, and only a few samples overlap with a small part of the range of San Juan volcanic rock samples. These results indicate that the coarse silt and very fine sand fractions that dominate the HP loess are derived from the local sandstone. However, other trace element contents of the HP samples (e.g., Mo, Cu, V, Pb, Ti; Fig. 6B, D, and F) and several others not shown are distinctly different from those of the Navajo Sandstone.
Examples of elemental contents of all samples from Mesa Verde (MV) and Hatch Point (HP) study sites and comparison with potential sources. Left column shows HP and MV loess samples plotted by sediment type for HP and by site for MV; right column shows samples grouped by study area compared with fields defined by samples of potential source rocks. (A and B) Copper versus molybdenum. (C and D) Lead versus vanadium. (E and F) Titanium versus iron. (G and H) Ratios of K/Ba versus K/Rb. Note the clear distinction between MV and HP samples in most elements. MV-1 and MV-2 samples overlap yet are also slightly different, most notably in molybdenum. All samples from the HP trenches comprise a single population, whether from loess, reworked loess, or alluvium. Data for Navajo Sandstone (N=14–24 depending on element) in eastern and central Utah from Goldstein et al. (2007), Reynolds et al. (Reference Reynolds, Goldstein and Miller2010), and Phillips et al. (Reference Phillips, Morris, Tingey and Eggett2015). Data for Cliff House Sandstone analyzed for this report (N=6; see Supplementary Table 5). Data for western San Juan volcanic field from Lipman (Reference Lipman2004; N=42–136). Data for Ute Mountain abstracted from National Geochemistry Database (https://mrdata.usgs.gov/ngdb/rock/ [accessed April 25, 2017]; N=28–34).

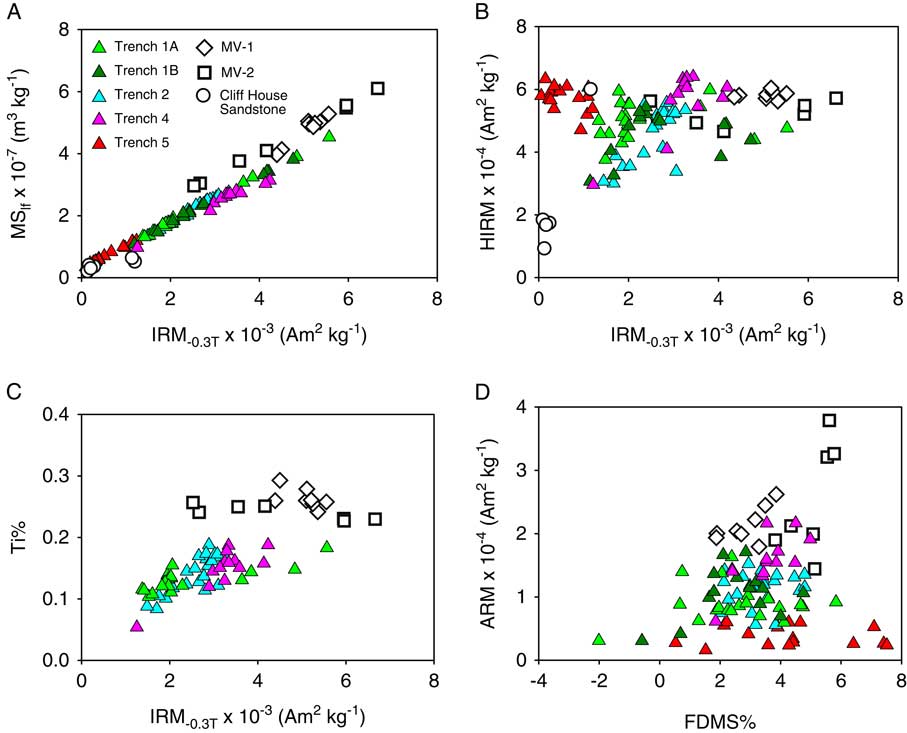
Magnetic results reveal a component of far-traveled dust. Evidence for such dust is the ubiquitous presence of magnetite in each loess unit, mainly on the basis of IRM−0.3T values (Fig. 7A). Sedimentary rocks in this region lack magnetite (Reynolds et al., Reference Reynolds, Belnap, Reheis, Lamothe and Luiszer2001, Reference Reynolds, Reheis, Neff, Goldstein and Yount2006a, Reference Reynolds, Reheis, Yount and Lamothe2006b). The lack of correspondence between magnetite and hematite (HIRM) in Figure 7B is expected in this type of setting where the dominant source of hematite is from local hematite-bearing sedimentary rocks (redbeds) (Reynolds et al., Reference Reynolds, Reheis, Yount and Lamothe2006b). The rough association of Ti with IRM−0.3T values (Fig. 7C) implies some commonality of sources for both magnetite and Ti and the presence of titaniferous magnetite, a common mineral that forms originally in igneous rock. The ubiquitous presence of magnetite has been measured in magnetic properties, and Ti-magnetite has been observed petrographically in regional eolian-influenced surficial deposits (Reynolds et al., Reference Reynolds, Reheis, Neff, Goldstein and Yount2006a, Reference Reynolds, Goldstein and Miller2010).
(color online) Magnetic properties of all samples from Mesa Verde (MV) and Hatch Point study sites (trenches) compared with properties of Cliff House Sandstone (only shown in A and B). (A) IRM−03.T versus MSlf. (B) HIRM versus IRM−03.T. (C) Ti versus IRM−03.T. (D) ARM versus FDMS. Note that MV samples have higher values of magnetic susceptibility (MSlf) and IRM−03.T, indicating higher contents of magnetite and other magnetic minerals. Panel C suggests that the higher IRM values of MV soils are related to higher contents of titanium-bearing magnetite. ARM, anhysteretic remanent magnetization; FDMS, frequency-dependent magnetic susceptibility; HIRM, hard isothermal remanent magnetization; IRM, isothermal remanent magnetization; MShf, high-frequency magnetic susceptibility; MSlf, low-frequency magnetic susceptibility.

Correlation and dating
The loessial units were physically traced between the two profiles described in each trench and were provisionally correlated between trenches on the basis of surface and buried soil properties (Fig. 4). We selected key units in each trench for OSL sampling and analysis. In addition, a 1 cm piece of charcoal was found at the base of the middle loess unit in trench 1A (Fig. 2; Table 2). Here the loess overlies a crack fill, presumably first created by a root and then filled with a mixture of sediment and reworked soil-carbonate rubble; the crack bisects the oldest loess unit. Except for trench 5, all the dated horizons in trenches with multiple ages are in stratigraphic order (Fig. 4), although there is overlap between the single age of 1740±135 yr obtained on the youngest loess in trench 2, profile 06U-6, and the youngest age obtained on the middle loess in several trenches (age range 6220±510 to 1385±125 yr). These OSL ages (Table 1) are consistent with a calibrated age of 5455±75 yr on charcoal at the base of the middle loess.
14C age from trench 1A, Hatch Point mesa.

a Samples processed and lab number assigned at 14C laboratory of the U.S. Geological Survey in Reston, Virginia.
b Ages expressed as years before present (AD 1950) with 1-sigma uncertainty.
c Calibration performed using CALIB program (http://radiocarbon.pa.qub.ac.uk/calib); expressed as cal yr BP with 2-sigma uncertainty.
The oldest loess unit yielded two ages of 10,370±925 yr near the base of the unit in trench 1A and 7555±520 yr in the middle of the unit in trench 2 (Fig. 4, Table 1). These two ages, plus the 4550 yr age from trench 1A, have larger measurement errors than the other OSL ages. These larger errors probably result from the excavation method used to obtain these three samples, which yielded blocks that spanned 20–25 cm of the sampled unit and therefore likely amalgamated loess that accreted over a longer span of time. We note that the Holocene ages of the HP loess units were surprising to us in view of the presence of argillic horizons, which usually indicate an older age.
Mesa Verde sites
The two exposures available for sampling on MV are located on thin remnants of loess (site MV-2 was on a remnant so small that it was not included on the surficial map of Carrara [Reference Carrara2012]). As such, they likely do not represent the entire time range of loess deposited on the mesa. The two exposures revealed at least two and possibly three loess units. Unlike the HP study site, the deposits on MV have >50% silt (Fig. 8) and are here considered “true” loess rather than sandy loess. The particle-size distribution is distinctly bimodal in both profiles, and more strongly so in MV-1, having broad peaks centered on about 20 µm and narrower peaks at about 60–70 µm (Fig. 3). Both peaks are also present in MV-2, but the coarse mode peak, centered at about 90 µm, is dominant in the upper meter of loess, whereas the basal two horizons (from 107 to 164 cm depth) have a subequal to dominant peak at 20 µm. These changes in particle-size distribution with depth suggest at least two primary sources of loess, a nearby source and one more distant (Vandenberghe, Reference Wells, McFadden and Schultz2013), and that the contribution from these sources may have changed through time. It is possible that the loess was transported as aggregates and was later broken into two size classes by weathering or by laboratory pretreatments. There is strong correspondence between the coarse mode of the loess and the particle size of the Cliff House Sandstone, which is the local eolian source (Fig. 3). However, magnetic properties discussed subsequently suggest that some loess may have been derived from marine shales surrounding MV, and such sediment could have been transported as aggregates of clay particles. At 2080 m in altitude, profile MV-1 lies about 170 m higher than the HP sites, whereas MV-2 at 2455 m is about 450 m higher.
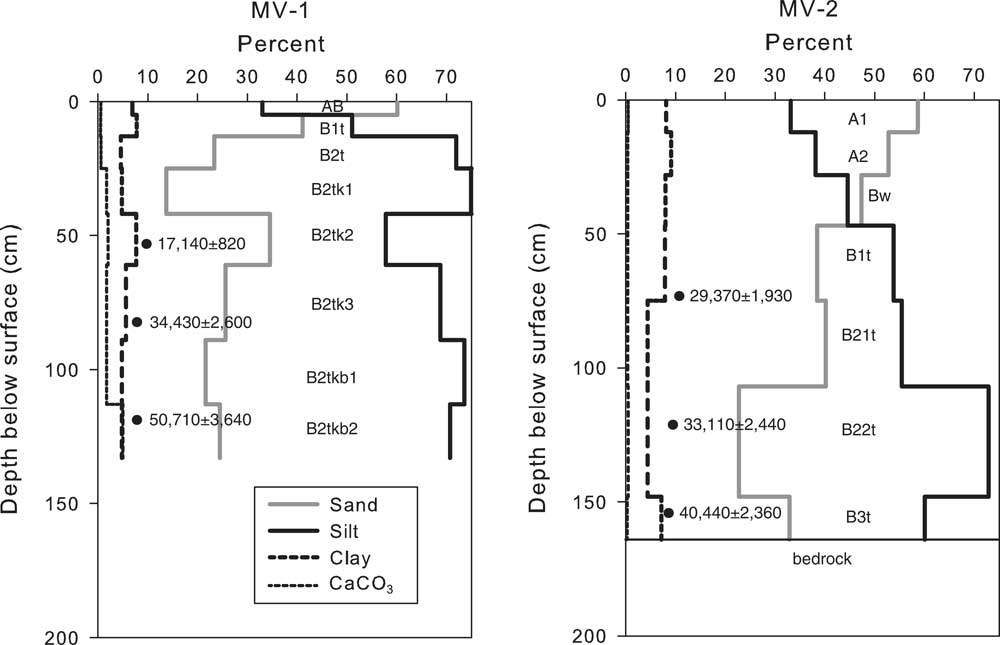
CaCO3, sand, silt, and clay percentages for MV-1 and MV-2 soil profiles. Dots are optically stimulated luminescence tube samples with dates (1 standard deviation).

Soil descriptions
MV-1 contains less carbonate than do the HP soils, and the higher MV-2 contains almost none. MV-1 has ochric, argillic, and calcic horizons and classifies as an Aridic Paleustalf (Morefield series as mapped by USDA), whereas MV-2, with mollic and argillic horizons, is a Typic Argiustoll (Tragmon series). The argillic horizons in both profiles are characterized by common to abundant, thick or very thick clay films (see Supplementary Data), in contrast to soils at HP that have generally only thin clay films. However, clay percentages are quite similar in soils at the two study sites (Figs. 5 and 8).
One buried soil below a depth of 89 cm was tentatively identified in profile MV-1, and none appeared to be present in MV-2. Nevertheless, particle-size distributions suggest the presence of buried soils that were not detected in the field (Fig. 8). In MV-1, clay content is 7–8% near the surface, decreases below 13 cm, and then increases again at a depth of about 40 cm. Sand contents exhibit a similar pattern. This distribution suggests either the presence of a buried unit below 40 cm that was not identified in the field or a shift in wind strength or sediment source. In profile MV-2, no buried soil was observed in the field. However, there is a slight increase in clay content and the soil is darker (color value decreases) below about 150 cm, suggesting clay translocation and a higher content of organic matter that may reflect a buried soil.
Chemical and magnetic properties
Chemical data indicate strong compositional similarity between MV-1 and MV-2 samples (Fig. 6A, C, E, and G). Ratios of K/Ba and K/Rb (as well as K/Cs, not shown) show that much of the MV loess at these two sites was derived from the same sources (Fig. 6G). MV sample ratios are similar to those of 6 samples of weathered Cliff House Sandstone analyzed from MV (Fig. 6H; Supplementary Table 5). The loess sample ratios also overlap with fields defined by analyses of Navajo Sandstone (Goldstein et al., 2007; Reynolds et al., Reference Reynolds, Goldstein and Miller2010; Phillips et al., Reference Phillips, Morris, Tingey and Eggett2015) and western San Juan volcanic rocks (Lipman, Reference Lipman2004) but are distinct from samples of Ute Mountain rocks that lie just west of MV (UM, Fig. 1B; data accessed from the National Geochemistry Database, https://mrdata.usgs.gov/ngdb/rock/ [accessed April 25, 2017]). Comparisons of trace element data show that the Cliff House Sandstone was not the source of Mo, Cu, V, Pb, Ti (Fig. 6B, D, and F), and many other elements that tend to concentrate in the finer grain sizes (see Supplemental Data for analyses of sandstone samples). However, MV samples do overlap with contents of Pb, V, and Ti in Ute Mountain and western San Juan samples (Fig. 6D and F). Considered separately, MV-1 samples from the southern site tend to have larger amounts of Ti, U (not shown), and Mo compared with the MV-2 samples from the northern site.
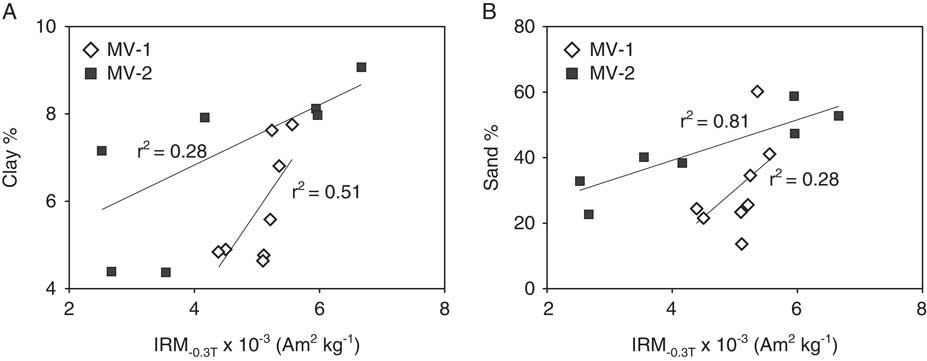
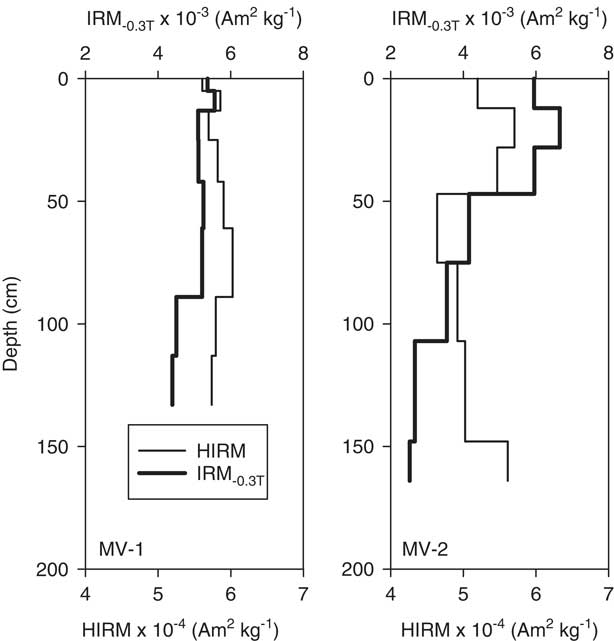
Magnetic properties indicate the presence of magnetite and hematite in the MV loess (Fig. 7A and B). Relatively low FDMS values (Fig. 7D) suggest that the magnetite (or possibly maghemite) is not derived from pedogenesis. Patterns of magnetite concentration (as IRM−0.3T) relative to particle size show that magnetite is associated with different grain sizes (Fig. 9). The MV-1 profile consists of magnetite and clay contents that generally follow the same depth trend and are moderately correlated (r 2=0.51), implying that magnetite is relatively concentrated in the fine-grained fractions throughout the profile (Fig. 9A). In contrast, magnetite in the MV-2 profile corresponds to sand content (r 2=0.81; Fig. 9B). However, the fine fraction in the upper portion of the MV-2 profile appears to be contributing some magnetite as well. Depth trends of magnetite correspond to those of hematite throughout the MV-1 profile, whereas magnetite and hematite in MV-2 only correspond in the upper half of the profile (Fig. 10). Petrographic examination of magnetic separates made of three samples from each profile (MV-1: 5–13 cm, 61–89 cm, 89–113 cm; MV-2: 12–28 cm, 47–75 cm, 75–107 cm) gives further information on the potential sources of magnetic minerals. All samples are dominated by optically homogeneous magnetite, typically 10–30 µm in diameter and slightly coarser (up to 50 µm) in upper samples at both sites. In addition, MV-2 contains fine (mostly <10 µm) magnetic sulfide particles that decreased with depth in the profile, whereas minor amounts of sulfides are seen only in the lowest sample of MV-1. We interpret these sulfides to reflect dust inputs from the Cretaceous marine shales surrounding MV (Haynes et al., Reference Haynes, Vogel and Wyant1972; Carrara, Reference Carrara2012). The medium-silt-sized magnetite is clearly not derived from the Cretaceous Cliff House Sandstone underlying the MV sites (Fig. 7A and B).
Scatter plots of clay (A) and sand (B) contents versus IRM-03.T for MV-1 and MV-2 samples. Note that IRM values of MV-1 samples are better correlated with clay content, whereas IRM values of MV-2 samples are closely correlated with sand content. IRM, isothermal remanent magnetization.

Depth plots of HIRM and IRM-03.T for MV-1 and MV-2. HIRM, hard isothermal magnetization; IRM, isothermal remanent magnetization.

OSL dating
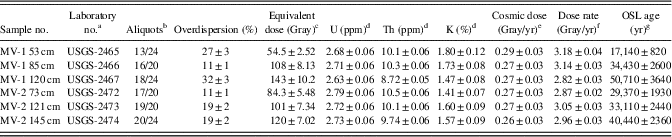
OSL analyses on sediment taken from profile MV-1 are in chronological order with depth (Fig. 8, Table 3) and yielded ages of 17,100 (error range 16,280–17,920) yr at 53 cm, 34,400 (31,830–37,030) yr at 85 cm, and 50,750 (47,110–54,390) yr at 120 cm. The two younger ages are in adjacent soil horizons with no discernible discontinuity in field properties or particle size. The oldest age lies within a buried soil suggested by field properties (consistence and clay films), but the laboratory data show only a small increase in sand and carbonate content. These relations suggest that there may have been gradual deposition of loess from about 50,000 yr ago to 17,000 yr ago, likely accompanied by pedogenesis, with no hiatus long enough to form distinct soils that were later buried by younger loess. However, clay and sand contents suggest that a younger loess unit may be present, but undated by us, above a depth of about 40 cm (Fig. 8).
Optical ages and data for quartz for sediment samples from Mesa Verde National Park, Colorado.

a Samples run as quartz separates 250–180 μm sized; U.S. Geological Survey (USGS) Laboratory in Denver, Colorado.
b Aliquots used in equivalent dose calculation versus number of aliquots measured.
c Equivalent dose calculated using the central age model of Galbraith et al. (Reference Galbraith, Roberts, Laslett, Yoshida and Olley1999), in reference to overdispersion values <25%, or, where appropriate,
the minimum age model (i.e., MV-1 53 cm and MV-1 120 cm).
d U, Th, and K2O content analyzed by neutron activation analyses; errors are obtained from coefficients of variation on USGS rock standard reference material.
e From Prescott and Hutton (1994).
f Includes a moisture content of 25±5%.
g All errors are at 1-sigma and calculated in a quadrature. Ages from the reference year AD 2010 and rounded to nearest half decade.
Eolian sand or loess should be uniformly exposed, with little or no partial bleach component left after transport, and thus little to no scatter in equivalent dose unless postdepositional processes have caused mixing either by biological agents or soil-forming processes (Bateman et al., Reference Bateman, Frederick, Jaiswal and Singhvi2003; Duller, Reference Duller2008; Preusser et al., Reference Preusser, Degering, Fuchs, Hilgers, Kadereit, Klasen, Krbetschek, Richter and Spencer2008). Bateman et al. (Reference Bateman, Frederick, Jaiswal and Singhvi2003) propose that mixing can be distinguished from partial bleaching by the shape of the skew in the equivalent dose data, but in practice, this is extremely difficult to interpret. The 34,000-yr-old sample shows little scatter, whereas the 17,000- and 50,000-yr-old samples show twice as much scatter (Table 3). This scatter, combined with profile depth of the samples, suggests that the 50,000-yr-old sample may have been mixed by pedogenic processes with an older loess or weathered sandstone bedrock, and that the 17,000-yr-old sample may have been biologically mixed with younger surficial sediment, perhaps even with Holocene-aged dust.
The three OSL ages from profile MV-2 are in good agreement with age order to depth. Moreover, the two youngest ages of 29,400 yr (31,300–27,500 yr) and 33,110 yr (35,550–30,670 yr) overlap within error limits although they are separated by about 50 cm of loess. However, there is an abrupt increase to 40,400±2400 yr near the base of the loess in less than 20 cm. We did not detect a buried soil between these two intervals. Although the sand and clay contents increase just above the oldest OSL age, which might be interpreted to suggest a buried unit, the lowest soil horizon directly overlies weathered sandstone. Sand from this sandstone was likely admixed with loess during deposition, and downward movement of translocated clay may have been impeded by the sandstone bedrock. The equivalent dose scatter does not suggest an increase because of partial bleaching, mixing or bioturbation. Instead, the conformity of the ages with the 34,430 yr date in MV-1 suggests that the bulk of the loess at the two sites was deposited sometime between 28,000 and 42,000 yr with an earlier onset around 50,000 yr at MV-1 (Fig. 8).
In summary, particle size and OSL ages from the two MV profiles suggest that loess accumulated relatively slowly from about 40 ka to 28 ka with later sporadic intervals. Field descriptions also noted a soil-forming hiatus prior to about 40 ka, with older loess deposited at around 50 ka. OSL data suggest possible mixing with even older, ~90 ka loess in this horizon (at 120 cm depth: see radial plot, Supplementary Data for MV OSL, Supplementary Fig. 3c). Textural data at site MV-1 suggest that loess was also deposited after about 17 ka. Judging from the abundance and thickness of clay films and the soil structure in this uppermost loess, it is probably no younger than latest Pleistocene in age.
DISCUSSION
Potential loess sources
Particle-size distribution provides a powerful tool to identify relative distances to potential sources of loess (e.g., Vandenberghe, Reference Wells, McFadden and Schultz2013; Dietze et al., Reference Dietze, Dietze, Lomax, Fuchs, Kleber and Wells2016). Although we did not employ statistical end-member modeling analysis to discriminate varying contributions of different loess sources, the particle-size distributions yield distinct, interpretable peaks for both study sites.
The HP trench soils have a single peak in particle size between 70 and 80 µm (Fig. 3). This peak represents the contribution of a local sediment source with a short transport distance of hundreds of meters to a few kilometers, by analogy to European and Asian loess (Vandenberghe, Reference Wells, McFadden and Schultz2013). The grain size has been little modified from the likely source, which is exposed fine-grained sandstone of the Triassic(?)-Jurassic Navajo Formation along the edge and upper slopes of the escarpment just west of the trench sites (Fig. 1C). This peak shifts to slightly coarser grain sizes in the basal horizons, likely because of mixing with the underlying rock, and the same horizons also tend to have a broad, low mode between 2 and 10 µm. We cannot be sure whether this mode represents very fine-grained loess from a distant source, or derivation from siltstones of the Entrada Sandstone or Kayenta Formation, which also crop out nearby. HP soils also have a low, indistinct minor bulge in the <1 µm clay fraction, which may represent pedogenesis. We note that the units interpreted as reworked loess have particle-size distributions that are essentially identical to those of the primary loess, indicating little or no winnowing or sorting during transport.
Elemental compositions of loess and potential sources support the particle-size interpretation. Ratios of K/Ba and K/Rb (Fig. 6H) confirm that the Navajo Sandstone is the likely source of the coarse sediment in the HP loess. In contrast, it is clear that several trace elements in the HP loess are not derived from the Navajo (Fig. 6B and D). We cannot rule out contributions of fine sediment from the San Juan volcanic field (via the San Juan River) or from Ute Mountain, but the compositions of these potential sources only partially overlap with that of HP loess.
The MV sediments have a more complicated bimodal particle-size distribution (Fig. 3). Horizons of profile MV-1 have broad peaks centered on about 20 µm and narrower peaks ranging from 50 to 80 µm. In MV-2, the coarse mode peak is dominant in the upper meter of loess, whereas the basal two horizons (from 107 to 164 cm depth) have a subequal to dominant broad peak centered on 20 µm. These distributions reflect at least two main sources of loess, whose influence was different at the two sites and may have changed over time. Again, we interpret the coarse mode as sandy loess derived from nearby sandstone bedrock, in this location the Cretaceous Cliff House Sandstone, which underlies the entire area and is well exposed on the mesa top and sides (Carrara, Reference Carrara2012). The broad smooth peaks in both profiles range from about 3 to 30 µm; such a distribution could imply a broad range in transport distance as well, from several tens of kilometers to 1000 km or more (for the finest loess; Vandenberghe, Reference Wells, McFadden and Schultz2013). The variable peak heights in the horizons of each profile, especially of MV-1 (Fig. 3), suggest changes through time in the importance of this more distant source compared with the local sandstone source.
These particle-size interpretations are supported by the elemental contents of the two MV profiles (Fig. 6; Supplementary Data). The two sites have K/Ba and K/Rb ratios that are close to the field of ratios from the six samples of Cliff House Sandstone (Fig. 6H) and also overlap with ratios for the western San Juan volcanic rocks and the Navajo Sandstone (though distinct from HP loess ratios). The similarity to Navajo Sandstone composition is not surprising because the Cretaceous sea advanced over and reworked vast areas of Jurassic eolian sands. MV-1 samples have relatively higher contents of U, Ti, and Mo (Fig. 6) compared with MV-2 samples, suggesting a closer proximity to sediments from a source such as the San Juan River. A notable exception to the overall similarity of these two sample sets is Mo, which is distinctly lower in MV-2 samples (regrettably, Mo values are not available for the San Juan volcanics). We hypothesize that this may be caused by selective dissolution of Mo from the marine sediments (Cliff House Sandstone or possibly Mancos Shale) that are the closest source of the MV-2 loess. In support of this hypothesis, the two MV-1 samples that are more similar in composition to MV-2 samples (e.g., contents of Mo and U) are from the sand-enriched top of the profile (Fig. 6B and C). Compared with the HP samples, MV samples have partly overlapping but mainly higher concentrations for Pb, Cu, and V and distinctly higher concentrations for U and Ti (Fig. 6; Supplementary Data). An igneous rock source for these and other trace elements in the MV loess is supported by overlap with elemental contents of samples from the western San Juan volcanics and from Ute Mountain.
Magnetite, hematite, and particle-size data provide a basis to identify likely sources of the HP and MV loess. The coarse grain size and the lack of correspondence between magnetite and hematite in the HP deposits suggest that this loess is mainly derived from local hematite-bearing sandstones with some contributions from far-traveled dust containing magnetite. In contrast, the depth correspondence of magnetite and hematite in the MV loess (Fig. 10) is consistent with spatially cogenetic sediments derived from a volcanic terrain such as those transported along the San Juan River. Other igneous terrain in the region (e.g., Ute Mountain laccolith, about 15 km west of MVNP; Fig. 1B) could also be contributing sediment to the loess deposits. An igneous origin is further supported by the single domain and fine magnetic grain size (Fig. 7D) characteristic of the magnetic minerals in the MV loess. We interpret the MV-1 profile as consisting of contributions from a source characterized by relatively fine-grained particles of an igneous origin and the MV-2 profile as consisting of contributions from areas with coarse magnetic material. However, there also appears to be some contribution to the upper half of the MV-2 profile from areas with finer magnetic material, including the magnetic sulfides identified by petrography. We interpret these sulfides to reflect dust inputs from the Cretaceous marine shales surrounding MV (Haynes et al., Reference Haynes, Vogel and Wyant1972; Carrara, Reference Carrara2012).
In summary, the particle-size, elemental, and magnetic data support an interpretation of one primary, proximal source (Jurassic eolian sandstone) for the HP loess. In contrast, the MV loess had at least two different sources that varied in dominance with location and time. The primary source for the southern MV-1 site was likely the San Juan River, about 50 km to the southwest, but the youngest loess may have been partly derived from the local Cretaceous marine rocks. The northern MV-2 site had two sources, including local sandstone and a more distant source that was finer grained and higher in trace element contents, such as the San Juan River or the more proximal tributaries that drain the Ute Mountain area.
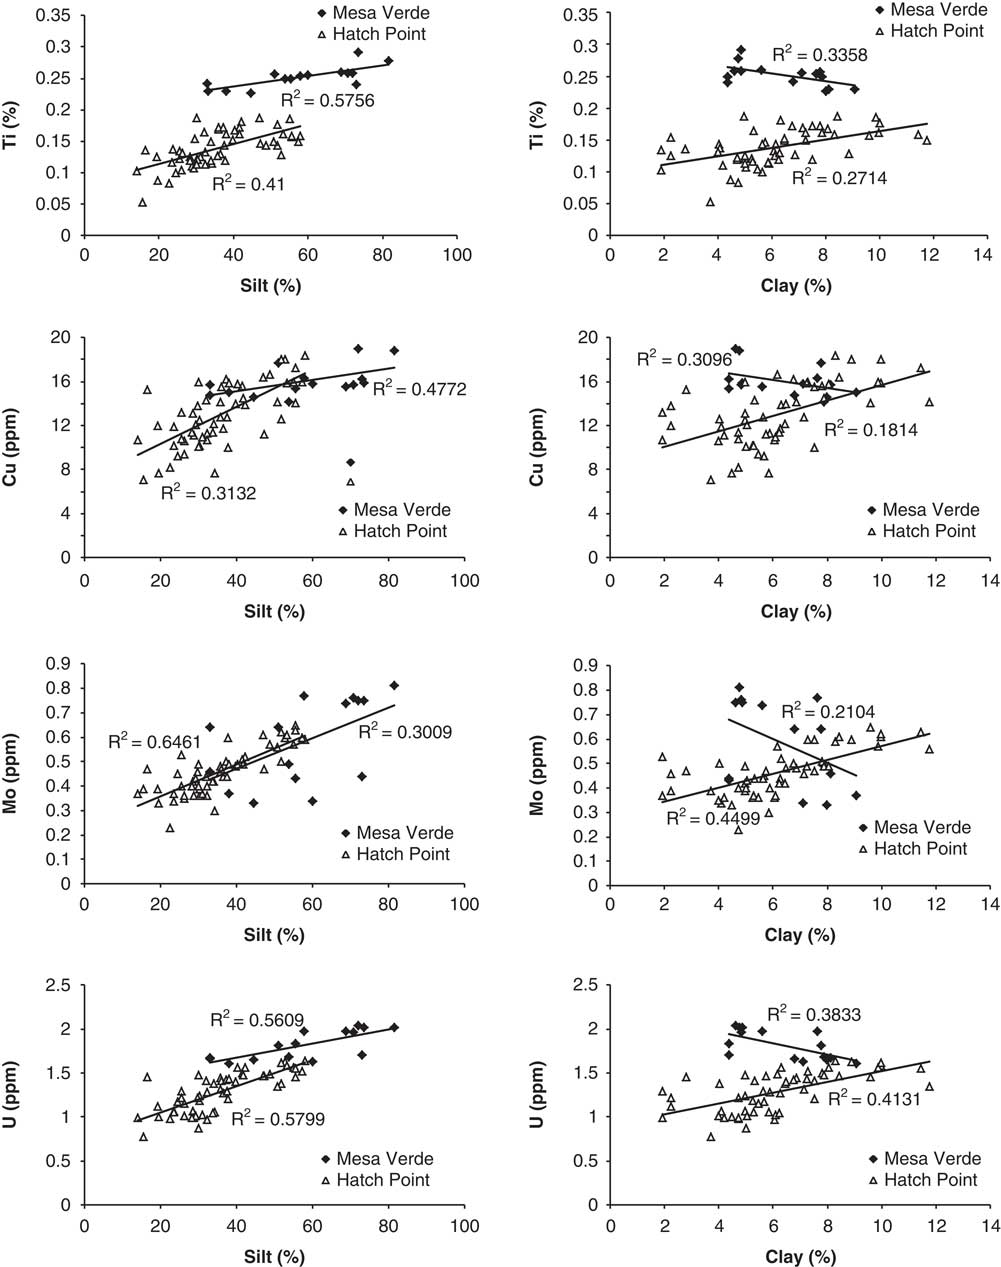
To shed further light on the contributions of loess sources at different distances from the two study sites, we plotted trace element contents against particle size (Fig. 11). Trace elements generally decrease with particle size and are most abundant in clays (e.g., Hardy and Cornu, Reference Hardy and Cornu2006; Castillo et al., Reference Castillo, Moreno, Querol, Alastuey, Cuevas, Herrmann, Mounkaila and Gibbons2008). Note that geochemical analysis was performed on the bulk samples, not on the separate sand, silt, and clay fractions, so these plots should be considered to indicate only general trends. As expected, trace element contents of Ti, Cu, Mo, U, and several other elements not shown increased significantly with both silt and clay content in the HP loess. In contrast, the same elements in the MV loess increased with silt content but decreased with clay content. (When silt plus clay is plotted, the much higher content of silt in the MV samples overrides the negative trend of the clay to yield an overall positive trend.) The positive trends with clay and silt of the HP samples imply that HP loess was derived from a single source or from two or more sources well mixed by eolian transport. The different trends with particle size of the MV samples suggest that the clays may have been derived, at least in part, from a different source than the silts. The magnetic data indicate a dominantly igneous source of silt-sized particles. We speculate that the negative trends in trace element contents in the MV clays may be caused by admixture of clays from another source, such as the Cretaceous marine shales that surround Mesa Verde.
Examples of trace element contents of bulk samples plotted versus silt content (left column) and clay content (right column). R 2 values given for correlations.

Depositional history
Based on the OSL ages, stratigraphy, and buried soils, the two study sites appear to have different depositional records. At the trench sites on HP mesa (Fig. 4), loess was first deposited in the latest Pleistocene (~11–10 ka) to early Holocene (8–7 ka) and stabilized for long enough to develop weak argillic and moderate calcic horizons. This oldest unit was buried by loess and reworked loess during the middle Holocene (~6–2 ka) and again stabilized by soil development. A further episode of localized reworking and loess deposition occurred in the late Holocene. In contrast, loess deposits at the two MV sites record an older history of relatively continuous loess deposition combined with slow pedogenesis from about 50 to 17 ka (Fig. 8), with a possible hiatus and more pronounced soil development between about 50 and 40 ka and between 25 and 20 ka. In addition, younger loess was probably deposited at profile MV-1 after about 17 ka. Viewed together, however, the two study sites present a record of loess deposition over the past 50,000 yr (Fig. 12) in the area of the eastern Colorado Plateau.
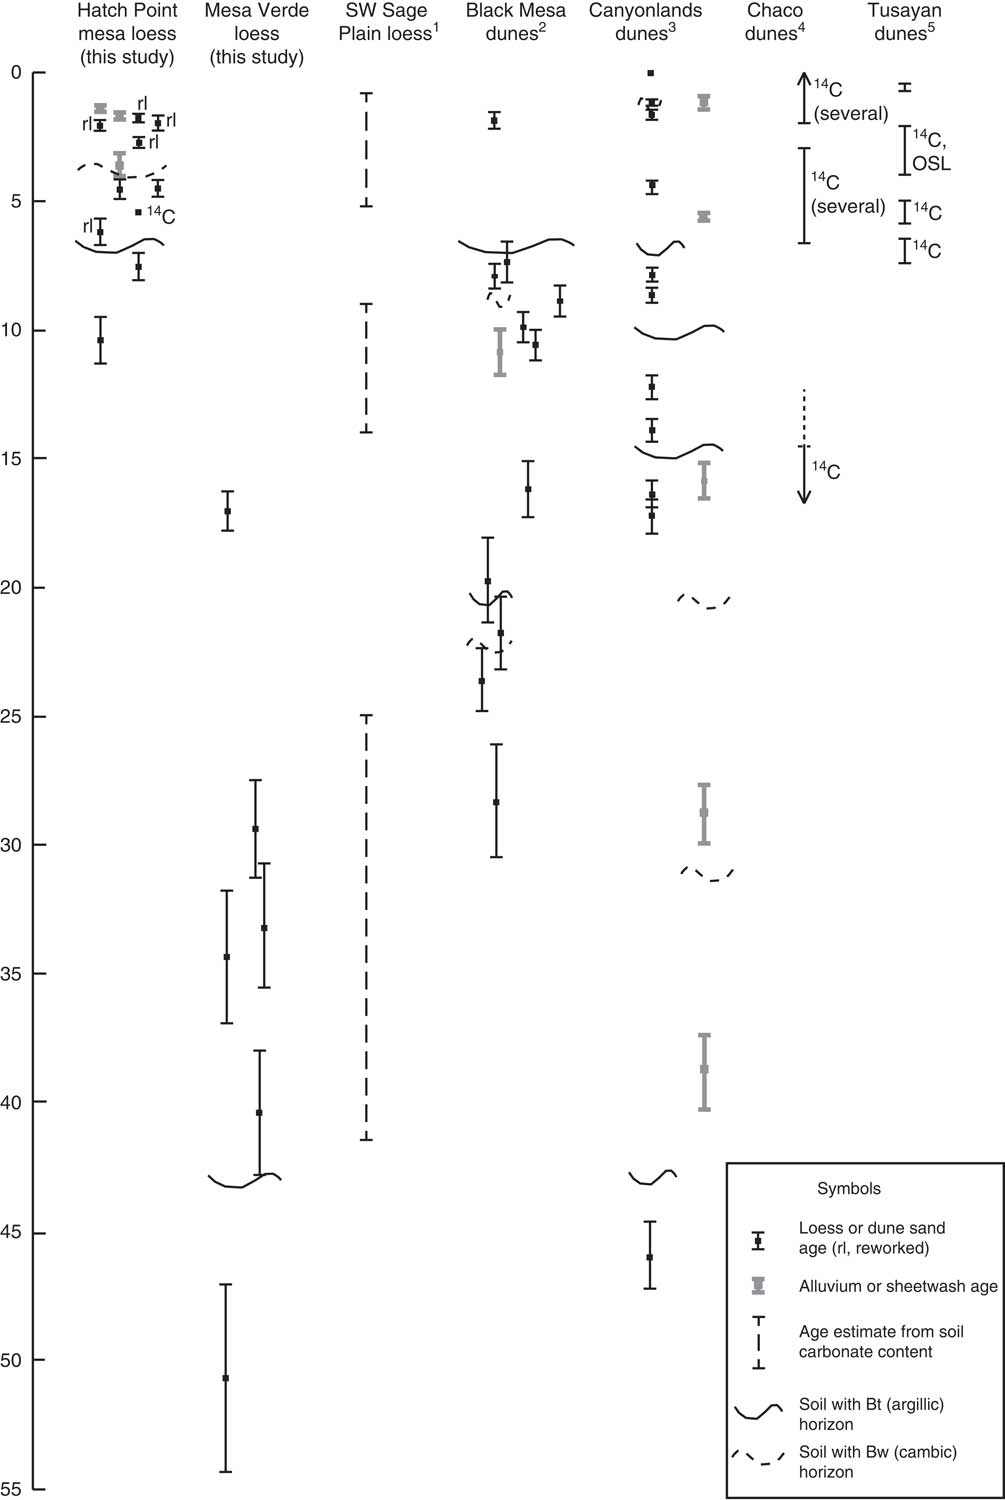
Optically stimulated luminescence (OSL) ages of loess deposits from this study compared with previously published loess and dune records in the southern Colorado Plateau. For Mesa Verde ages, left-side bars are from MV-1, and right-side bars from MV-2. 1Soil carbonate ages of Steensen (Reference Steensen1992). 2OSL ages of dunes and sand sheets on Black Mesa, Arizona (Ellwein et al., Reference Ellwein, Mahan and McFadden2011, Reference Ellwein, Mahan and McFadden2015). 3OSL ages of sand dunes and alluvial deposits in Canyonlands National Park (Reheis et al., Reference Reheis, Reynolds, Goldstein, Roberts, Yount, Axford, Cummings and Shearin2005). 4Radiocarbon ages from Chaco dunes, New Mexico (Wells et al., Reference Williams1990). 5Radiocarbon and OSL ages from Tusayan dunes, Arizona (Stokes and Breed, Reference Stokes and Breed1993).

Comparison with other eolian studies
The record of loess deposition on HP mesa and at MV is generally similar to dune records in the Four Corners region (Wells et al., Reference Williams1990; Stokes and Breed, Reference Stokes and Breed1993; Reheis et al., Reference Reheis, Reynolds, Goldstein, Roberts, Yount, Axford, Cummings and Shearin2005; Ellwein et al., Reference Ellwein, Mahan and McFadden2011, Reference Ellwein, Mahan and McFadden2015), as well as to an interesting but less well-dated loess study on the Sage Plain south of HP (Steensen, Reference Steensen1992) (Fig. 12). Some of the soil-forming hiatuses are similar in timing as well (e.g., ~40–45 ka, ~7 ka). Combined, these records suggest that loess and dunes were deposited across the Colorado Plateau throughout the past 50,000 yr, locally punctuated by episodes of stabilization and soil formation. At MV, however, gradual loess deposition and soil formation were concurrent prior to about 15 ka. On the Sage Plain, Steensen (Reference Steensen1992) used the amount of pedogenic carbonate contained in surface and buried soils to estimate loess ages. He inferred three periods of loess deposition, separated by soil formation, during the middle to late Holocene, the latest Pleistocene to early Holocene, and during the later part of Marine Oxygen Isotope Stage (MIS) 3 from about 42 to 25 ka. These age ranges are similar to OSL ages of loess units in our study.
The closest dated sand dunes are in Canyonlands National Park, to the north and south of HP (Figs. 1B and 12; Reheis et al., Reference Reheis, Reynolds, Goldstein, Roberts, Yount, Axford, Cummings and Shearin2005). In Canyonlands, dune sand was deposited during the late, middle, and early Holocene and during the late Pleistocene in two episodes around 12–14 ka and 16 ka (coeval with the youngest dated loess unit at MV). Each of the Canyonlands eolian episodes is locally separated by buried soils. Like the buried soils that separate the oldest and middle loess units at HP, the dune soils that formed during the late Pleistocene and early Holocene have argillic horizons that were interpreted to indicate rapid infiltration of eolian dust during relatively wet periods when the dunes were stabilized and likely vegetated (Reheis et al., Reference Reheis, Reynolds, Goldstein, Roberts, Yount, Axford, Cummings and Shearin2005). A similar timing of dune deposition and clay translocation was obtained on falling dunes at Black Mesa, Arizona (Ellwein et al., Reference Ellwein, Mahan and McFadden2011, Reference Ellwein, Mahan and McFadden2015), to the southwest of our study sites (Figs. 1A and 12), with the younger ages from the loess coinciding with the oldest dune sand dates.
Our ages suggest that loess deposition at MV occurred over a long period of time between about 55 and 27 ka. Loess at MV is also coeval with alluvial graben-filling deposits in Canyonlands, and with an older episode of dune deposition at Canyonlands at about 45 ka. The principal difference between the loess records of this study and the dune records is an absence of loess at our two MV sites during the Holocene, during which time falling dunes were deposited at Black Mesa (Ellwein et al., Reference Ellwein, Mahan and McFadden2015). Holocene loess may exist elsewhere in the park, perhaps best seen in places where cultivation and disturbance have been minor.
The chemical and magnetic data for the MV loess suggest that the glacially influenced San Juan River was a significant source of loess at times in the past. Cosmogenic dating of moraines, scoured bedrock, and the youngest outwash terrace in the Animas River valley, a significant tributary of the San Juan River (Fig. 1A and B), indicates that the Animas glacier reached its maximum extent ca. 20 ka (Guido et al., Reference Guido, Ward and Anderson2007). Unfortunately, there are no ages on older moraines that could shed light on the lengthy loess deposition at MV between 55 and 27 ka (Fig. 12). We can assume that the river was carrying significant glaciogenic loads for a few thousand years as the glacier advanced downvalley. The ponding of glacial Lake Durango behind the late Pleistocene moraines is interpreted to have shut off sediment supply to the Animas River for some period of time after 20 ka (Gillam, Reference Gillam1998; Guido et al., Reference Guido, Ward and Anderson2007), greatly decreasing the sediment load of the San Juan River. Such fluctuations in sediment load may have contributed to some of the missing record of loess deposition at MV (Fig. 12). However, these gaps and the lack of Holocene loess may well be a result of our limited sampling at MV rather than an absence of deposition. The reason for the lack of older loess on HP mesa could be episodic erosion in a relatively unstable setting on the canyon rim (Fig. 1C).
CONCLUSIONS
Our study of loess on the Colorado Plateau was limited to two areas, neither of which is in the thickest and best-preserved parts of the loess blanket. Pioneering work by Steensen (Reference Steensen1992) and Biggar et al. (Reference Biggar, Harden and Gillam1981) demonstrates that parts of the Sage Plain contain much thicker loess and potentially a much longer Quaternary record of deposition than the areas we sampled, and these thicker deposits should be targeted for future work.
The most important result from the study of loess at the MV outcrops and HP mesa trenches is that the loess is episodically preserved (and perhaps generated) and that these episodes can be correlated with other climatic records at Canyonlands, southwest Sage Plain, Chaco Canyon, NM, and Tusayan and Black Mesa, Arizona. Perhaps the most surprising result is the fact that loess accretion started as early as 50 ka and persisted, with fluctuations, during MIS 3 until at least 27 ka. Loess was also deposited around 17 ka during the last glacial maximum. These late Pleistocene loess deposits are preserved on MV but not on HP mesa.
A second important result is the intermittent deposition, or preservation, of Holocene loess on HP mesa. Some units, such as unit 1A-2 in trench 1A, are thick and continuous and span OSL dates of 2000 to 6000 yr. Other units, such as the older unit 2-1 in trench 2, are clearly eroded and are only partially preserved on the landscape. Although the depositional patterns of Holocene loess in our study area are similar to those of eolian sands at other sites in the region, we can only speculate whether the loess deposition was indeed continuous but not preserved or whether it was turned on and off by sediment supply and effective moisture.
Finally, we have shown that in locations such as HP mesa, which are isolated from river floodplains, loess can be derived solely by wind erosion of local bedrock, with minor inputs of atmospheric dust from distant sources. In contrast, loess on MV was contributed from at least two different sources, including sediment from the San Juan River and its tributaries as well as from local bedrock and probably distant sources.
ACKNOWLEDGMENTS
This research was funded by the Climate Research and Development Program of the USGS. We thank MVNP for permission to sample and analyze two loess outcrops and the Bureau of Land Management for permission to trench deposits at HP mesa. George San Miguel (National Park Service) provided samples of the Cliff House Sandstone and accompanied our sampling at MV. Mark Miller (currently of the Bureau of Land Management), Jayne Belnap (USGS, Moab), and James Yount (USGS, retired) assisted with sampling, describing, and creating trench logs at HP. Gary Skipp and Asha Mahatma (USGS) helped with laboratory analyses. We greatly appreciate very helpful reviews from Dan Muhs (USGS) and two anonymous reviewers.
Supplementary materials
To view supplementary material for this article, please visit https://doi.org/10.1017/qua.2017.63