I. INTRODUCTION
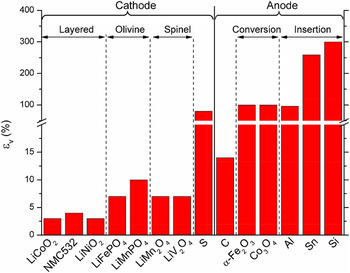
Li-ion batteries are the major power source in portable electronics and electric vehicles. Reference Armand and Tarascon1,Reference Whittingham2 Innovation in the battery technology has been driven by the imperative demand of materials of light weight, high energy density, fast charging, long lifespan, and low cost. Reference Tarascon and Armand3–Reference Nitta, Wu, Lee and Yushin5 Mechanical degradation of batteries caused by the repetitive swelling and shrinking of electrodes in the lithiation cycles is now well recognized. Reference Mukhopadhyay and Sheldon6,Reference McDowell, Xia and Zhu7 The stress induced structural disintegration impedes electron conduction and causes persistent loss of capacity of batteries in the long-term cycles. In particular, the mechanical failure has become the bottleneck in the commercialization of high-capacity electrodes because of the massive volumetric deformation associated with the electrochemical processes. Figure 1 gives a brief survey of the volumetric strain of different types of cathode and anode materials. It is evident that drastic deformation is inherent to the high-capacity electrodes, such as S cathode as well as conversion and insertion type anodes. Reference Christensen and Newman8–Reference Courtney and Dahn12 The repetitive volumetric change in the active materials generates a complex field of stresses in the electrodes and leads to various sources of mechanical degradation including fracture, Reference Zhao, Pharr, Vlassak and Suo13–Reference Lee, Lee, Nix, Gao and Cui17 plasticity, Reference Zhao, Wang, Gregoire, Pharr and Suo18–Reference Brassart and Suo20 and cavitation. Reference Choi, McDonough, Jeong, Yoo, Chan and Cui21,Reference Liu, Huang, Picraux, Li, Zhu and Huang22
A survey of volumetric strain of different types of cathode and anode materials.

While mechanical failure of batteries is frequently observed, less understood is the impact of stresses on the electrochemical processes, that is, how the locally generated stresses modify the energy landscape and kinetics of Li transport, interfacial reactions, and hence the capacity and potential of batteries. Reference Zhao, Pharr, Wan, Wang, Kaxiras, Vlassak and Suo23–Reference Sandu, Brassart, Gohy, Pardoen, Melinte and Vlad26 Developing continuum models and numerical methods for the coupled Li diffusion and large deformation has been a topic of intense interests in the past few years, especially for the application of Si anode. Reference Verbrugge and Koch27–Reference Jia and Li40 Nevertheless, most of prior research has been focused on idealized structures of single, isolated particles or two-dimensional structures. In commercial batteries, both the cathode and anode are composites of high heterogeneity at the nano-to microscale. A composite electrode is usually consisted of active particles of different sizes and irregular shapes, a matrix composed of polymer binders and additives, and pores filled with the electrolyte. Reference Tarascon and Armand3,Reference de Vasconcelos, Xu, Li and Zhao41 The components intimately interact with each other during the lithiation cycles and raise a complex field of stresses within the electrodes. Although the simplified models of single particles are useful to capture the first-order coupling effect between diffusion and stresses, the predictions on Li concentrations, stress field, and mechanical failure from the idealized models can be substantially different from that of the composite configurations. Relying on the techniques of x-ray tomographic microscopy and focused ion beam scanning electron microscope (FIB/SEM), the microstructure of composite electrodes in commercial batteries can be reconstructed with sufficient details and imported into the computational programs such as finite element methods (FEM) and finite volume methods (FVM). Reference Hutzenlaub, Thiele, Zengerle and Ziegler42–Reference Ebner and Wood44 Several groups have recently utilized the reconstructed 3D models to simulate the stress generation and electrochemical behaviors in more realistic configurations. The major findings, in comparison with the single-particle models, are as follows. (i) The stress field, Li concentration, and mechanical failure are strongly affected by the local details of the microstructure. (ii) The percolated bicontinuous network of reconstructed particles show significantly higher stresses than that in single isolated particles. (iii) The mechanical properties of binders, particularly the yield stress and elastic modulus, play an important role in determining the average stresses developed in the electrodes. Reference Lim, Yan, Yin and Zhu45–Reference Mendoza, Roberts, Brunini and Grillet49
In this paper, we reconstruct 3D composite models of LiNi1/3Mn1/3Co1/3O2 (NMC333, simplified as NMC in the following text) cathode and SnO anode based on extensive x-ray tomographic microscopy data. We implement the models into a developed finite element program that computes the coupled Li diffusion and stresses. We investigate the evolution of the stress field and the mechanical interactions regulated Li distribution and capacity of the electrodes. The state of charge in the active particles is highly inhomogeneous depending on the distribution of the percolated active particles and properties of the matrix. The effective capacity is limited by the inhomogeneous storage of Li and significant capacity loss is possible due to the particles contact and mechanical confinement of the surrounding medium. A map of the specific capacity of the composite electrodes in terms of the volume fraction and volumetric strain of the active particles is constructed. We anticipate an ample space of optimization on the capacity and mechanical performance of electrodes through tuning the size, shape, and pattern of the active particles, as well as the stiffness, geometry, and porosity of the matrix.
II. THEORY AND FINITE ELEMENT MODELING
We consider the composite electrodes composed of two general components, active particles which store Li and inactive matrix which provides mechanical confinement to the deformation of the active materials. The inactive matrix is a representation of the effective medium including the polymer binders, conductive agents, and porosity in commercial batteries. The kinetics in batteries is often limited by Li diffusion in the active materials while Li transport through the porous matrix is usually a faster process. Here we consider that Li diffusion only occurs in the active material.
The continuum theory of coupled diffusion and large elasto-plasticity is described in a previous work
Reference Zhao, Pharr, Cai, Vlassak and Suo50
and its implementation into the finite element program is introduced in a recent publication.
Reference Xu and Zhao51
In brevity, the displacement field in the active material is governed by the equation of mechanical equilibrium,
 $\nabla S + {F_{\rm{b}}} = 0$
, where S is the nominal stress calculated as
 $S = K:{\varepsilon _{\rm{e}}}$
, K the stiffness matrix, εe the elastic strain, and F
b the body force. The total deformation of a representative material element follows the kinematic multiplicative decomposition
 $F = {F_{\rm{e}}}{F_{\rm{l}}}{F_{\rm{p}}}$
, where F represents the deformation gradient, F
e the reversible elastic distortion of the material, F
l lithiation-induced volumetric deformation, and F
p the irreversible plastic deformation that dictates the shape change of the body. The elastic strain is computed as
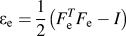 ${\varepsilon _{\rm{e}}} = {1 \over 2}\left( {F_{\rm{e}}^T{F_{\rm{e}}} - I} \right)$
. The volumetric change due to Li insertion is
 $1 + \Omega C$
, where
 $\Omega$
and C are the partial molar volume and concentration of Li, respectively. The material element yields under the von Mises conditions and the plastic deformation follows the J
2 flow theory. For the inactive material, the deformation and stresses are caused by the mechanical interactions with the active material. Its constitutive behavior is described by a Neo–Hookean model.
Reference Attard52
Traction-free and fixed boundary conditions are prescribed in the out-of-plane and in-plane directions, respectively, to model the film geometry of electrodes in commercial batteries. Li concentration is calculated by
 ${{\partial C} \over {\partial t}} + \nabla J = 0$
, where J is the nominal flux of Li, and
 $\nabla$
represents the gradient with respect to the Lagrangian coordinate. Li flux is driven by the chemical potential μ, and can be written as
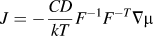 $J = - {{CD} \over {kT}}{F^{ - 1}}{F^{ - T}}\nabla \mu$
following the standard transformation rules of continuum mechanics. The coupling of diffusion and stresses is represented in the form of the chemical potential of Li,
 $\mu = {\mu _0} + kT\log \left( {{{\gamma \Omega C} \over {\det \left( F \right)}}} \right) - \Omega {\sigma _{\rm{m}}}$
, where μ0 is a reference value and γ the activity coefficients. The first two terms are the familiar expressions of the chemical potential for a species in nonideal solution, and the third term represents the elastic energy change in isotropic materials upon insertion of guest species under stress, where
 ${\sigma _{\rm{m}}} = {{{\sigma _{{\rm{kk}}}}} \mathord{\left/ {\vphantom {{{\sigma _{{\rm{kk}}}}} 3}} \right. \kern-\nulldelimiterspace} 3}$
is the mean stress. A general formula accounting for the stress-dependent chemical potential in anisotropic solid solutions can be found in the work of Larché and Cahn.
Reference Larché and Cahn53
For the diffusion boundary condition, we assume good ionic and electronic conductivities of the inactive materials such that each active particle experiences the same current or potential on the outer surface. In the reference state, the electrode is free of Li and stress. Lithiation is induced by imposing a galvanostatic or potentiostatic condition to the active particles. For galvanostatic lithiation, a constant nominal flux J
0 is prescribed. For potentiostatic lithiation, a constant chemical potential of Li μS is specified on outer surface of active particles. The idealized boundary conditions do not account for the kinetics of surface charge transfer at the interface of the electrode and electrolyte and exclude the nonuniform current density that a composite electrode may experience at various locations.
Reference Cheng and Verbrugge30,Reference Bower, Guduru and Sethuraman34,Reference Christensen54,Reference Kim, Smith, Lee, Santhanagopalan and Pesaran55
The governing equations for the kinematics of deformation and the kinetics of diffusion are both strongly nonlinear. We integrate their weak formulations into the finite element program within a Lagrangian setting. The coupled equations for stress equilibrium and Li diffusion are solved simultaneously at every time step. The weak formulation for the force balance is obtained by following a standard procedure in continuum mechanics Reference Xu and Zhao51,Reference Salvadori, Grazioli and Geers56 :
 $$\int_\Omega {S\nabla v\,{\rm{d}}\Omega } - \int_\Omega {{F_{\rm{b}}}v\,{\rm{d}}\Omega } - \int_{\partial \Omega } {Pv\,{\rm{d}}S} = 0\quad ,$$
where v(X i , t) is a test function that vanishes on the boundary, and P represents the surface traction. For Li diffusion, the weak formulation is obtained by following the diffusion kinetics and by including the stress contribution to the Li chemical potential:
 $$\int_\Omega {\left( {{{\partial C} \over {\partial t}}\hat \mu - J\nabla \hat \mu } \right){\rm{d}}V} + \int_{\partial \Omega } {\left( {NJ} \right)\hat \mu {\rm{d}}S} = 0\quad .$$
The weak form Eq. (2) suggests that the chemical potential μ(X
i
, t) is used as the field variable for Li transport, instead of the use of the nominal concentration C(X
i
, t). The true Li concentration c can be computed from the chemical potential and the mean stress
 ${\sigma _{\rm{m}}}$
by
 $c = \exp {{\left\{ {{{\left( {\mu - {\mu _0} + \Omega {\sigma _{\rm{m}}}} \right)} \mathord{\left/ {\vphantom {{\left( {\mu - {\mu _0} + \Omega {\sigma _{\rm{m}}}} \right)} {kT}}} \right. \kern-\nulldelimiterspace} {kT}}} \right\}} \mathord{\left/ {\vphantom {{\left\{ {{{\left( {\mu - {\mu _0} + \Omega {\sigma _{\rm{m}}}} \right)} \mathord{\left/ {\vphantom {{\left( {\mu - {\mu _0} + \Omega {\sigma _{\rm{m}}}} \right)} {kT}}} \right. \kern-\nulldelimiterspace} {kT}}} \right\}} \Omega }} \right. \kern-\nulldelimiterspace} \Omega }$
and the nominal concentration is calculated by
 $C = c\det \left( F \right)$
. Such a choice is beneficial for the numerical convergence. The weak formulations are implemented into the commercial software COMSOL Multiphysics™ (COMSOL 4.4, Sweden). The built-in time-dependent solver MUMPS (MUltifrontal Massively Parallel sparse direct Solver) is used to solve the co-evolution of Li concentration and stresses.
57
To improve the convergence, the segregated approach is adopted.
III. RECONSTRUCTION OF 3D COMPOSITE ELECTRODES AND STATISTICAL ANALYSIS
We reconstruct the microstructure of NMC cathode and SnO anode from experimentally segmented images and implement the reconstructed geometries into the finite element computational program. The 2D binarized images for the NMC and SnO electrodes are generously provided by Dr. Martin Ebner from the Wood group at ETH Zurich, who obtained these images using the synchrotron radiation x-ray tomographic microscopy technique. Interested readers may be referred to the open-source database hosted by ETH Zurich which provides the microstructural data for 16 different NMC-based electrodes with various degrees of compositions and morphologies. Reference Ebner, Geldmacher, Marone, Stampanoni and Wood58,Reference Ebner, Marone, Stampanoni and Wood59 We compile the 2D binarized images into Avizo 8.1 (FEI; Hillsboro, OR) to generate the 3D voxel data set in which the active particles and the inactive matrix are separately defined. Replying on the 3D voxel representation, a surface description (surface mesh with triangular grid) for both active particles and inactive matrix can be created in Avizo. Default surface meshes are often far too fine for the subsequent operations; we simplify the surface mesh and correct the major blemishes, such as triangles with poor aspect ratios, intersections, or acute dihedral angles of the surface mesh, using Avizo's surface editor. Then we generate a volumetric tetrahedral grid based on the previously created triangular surfaces. The tetrahedral grid mesh is the basis for producing different geometries of the electrode microstructure including the boundary, edges, and points, etc. Finally we employ the open-source tool MeshLab to smooth the volumetric tetrahedral grid using the Laplacian Smoothing Filter, and export the smoothed tetrahedral grid mesh in a Standard Tessellation Language (STL) file format that can be imported into the geometry module of COMSOL. The build-in mathematical models in COMSOL are applied to the reconstructed domains.
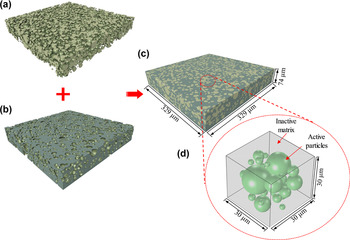
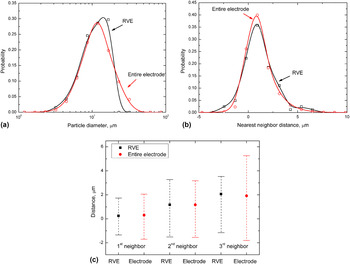
Figures 2(a)–2(c) show the active spheroidal NMC particles, the inactive matrix, and the reconstructed NMC electrode, respectively. The NMC electrode is reconstructed by a stack of 8-bit black and white binarized images of 889 × 889 pixels in which each of pixel size is 0.37 μm. The total volume of the reconstructed electrode is 329 × 329 × 74 μm3. Statistics analysis on the particle size distribution and particle distances is performed for the entire NMC electrode and is used to create the representative volume element (RVE). The RVE is a volume of heterogeneous objects representative to the geometric features of the entire electrode and affords the balance between the computational cost and statistical accuracy. Reference Joos, Carraro, Weber and Ivers-Tiffée60,Reference Shearing, Howard, Jørgensen, Brandon and Harris61 For NMC, we choose a RVE with the size of 30 × 30 × 30 μm3 that contains 27 particles, Fig. 2(d). The particles are spherical in nature as is observed in the majority of the particles of the reconstructed electrode (7752 particles). As stated earlier, the details of the microstructure determine the stress field and the electrochemical behaviors of the composite electrodes. We carefully compare the statistical features of the RVE versus the entire reconstructed volume. Figure 3(a) shows the particle size distribution. The probability is calculated by the sum of the volumes of the particles within a given size interval divided by the total volume of all the particles. Figures 3(b) and 3(c) show the distance (surface to surface) of the nearest neighbors and the average and standard deviation of the distance from the 1st, 2nd, and 3rd neighbors for individual particles, respectively. The statistical analysis of the RVE for the NMC electrode compressed by 2000 bar after fabrication is shown in Fig. S1 in the Supplementary Material. In addition, Table I provides further information on the volume fraction of the active particles V f, the average diameter of the particles A, as well as the number of particles in the RVEs of uncompressed/compressed samples. The selected RVEs indeed show the same statistical features of the entire NMC electrodes and thus are representative to microstructure of the composite electrodes.
Reconstruction of NMC composite electrodes. The electrodes are serial-sectioned and 2D images from each layer are aligned, segmented, and stacked into 3D configurations. (a) Active spheroidal NMC particles. (b) Inactive matrix. (c) Reconstructed NMC electrodes composed of active particles and inactive matrix (329 × 329 × 74 μm3). (d) RVE of the reconstructed NMC electrode (30 × 30 × 30 μm3), where the green spheres represent the active materials and the grey medium represents the inactive components. Li diffuse in the active particles and the surrounding matrix provides mechanical confinement to the deformation of the active materials.

Statistical analysis of RVE in comparison with the reconstructed entire NMC electrode. (a) Particle size distribution. (b) Probability distribution of the distance from the nearest neighbor for individual particles. (c) The average and standard deviation of the distance from the 1st, 2nd, and 3rd neighbors for individual particles in the reconstructed NMC electrodes (red) and in the RVE (black).

Statistic data for the NMC electrodes and RVEs.

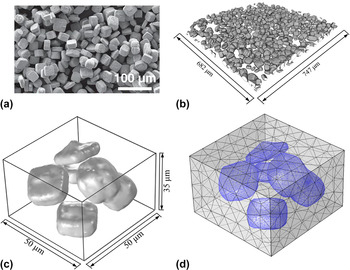
In another sample, we choose the SnO electrode as a representative of high-capacity electrodes that undergoes large elasto-plastic deformation upon lithiation. Figure 4(a) shows the scanning electron microscopy (SEM) image of the SnO particles with an estimated average diameter of 30 μm. The reconstructed model [682 × 747 × 84 μm3, Fig. 4(b)] shows that a large portion of the particles have irregular shapes and particles in local regions are aggregated. The complexity of particle geometries places a challenge in the selection of the RVE. We choose a local collection of the SnO particles and adjust the size the RVE to ensure that the volume fraction of the active particles is close to that in the entire electrode. Figure 4(c) shows the RVE which has rough particle surfaces, aggregated particles, and initial defects of voids and cracks. To avoid the computational singularity, we utilize the Laplacian smoothing method to smooth the particle surface and delete those structural defects. The RVE after surface smoothing has a size of 50 × 50 × 35 μm3 and the mesh is shown in Fig. 4(d). Albeit relatively small size, the RVE is a reasonable representation of the microstructural feature of the SnO electrodes.
Reconstruction of SnO composite electrodes. (a) SEM image of SnO particles. Reproduced with permission from Ebner el al. Science, 342, 716, 2013, by the American Association for the Advancement of Science. (b) 3D visualization of reconstructed SnO particles (682 × 747 × 85 μm3). (c) RVE of the reconstructed SnO electrode (50 × 50 × 35 μm3). (d) Mesh of the SnO RVE after surface smoothing.

IV. RESULTS AND DISCUSSION
NMC is a class of cathode materials attractive for the application of electric vehicles. We take the NMC as an example to examine the mechanical behaviors of intercalation-type electrodes which usually undergo relatively small volumetric strain upon lithiation (<10%). In the numerical modeling, we have assumed a perfect bonding between the active particles and the inactive matrix. The stress field in the composite electrode is induced by the coexistence of inhomogeneous distribution of Li and thus mismatch strains in the active particles, the mechanical confinement of the matrix against the volumetric change of the particles, and the contact of neighboring particles. Li distribution and the stress field dynamically co-evolve because of the coupling effect of diffusion and stresses. The radii of the NMC particles vary from 1.49 μm to 7.67 μm with an average value of A = 3.08 μm. The size of the matrix for the uncompressed sample is 30 × 30 × 30 μm3, and its size in the compressed sample decreases to 30 × 30 × 21 μm3 while the volume of the active particles remains the same. The material properties are adopted as follows. For NMC, elastic constitutive behavior is adopted and the mechanical properties are considered to be independent of the Li composition. We set the Young's modulus E
NMC = 120 GPa,
Reference de Vasconcelos, Xu, Li and Zhao41
Poisson's ratio v
NMC = 0.3, Li diffusivity D = 10−15 m2/s,
Reference Wei, Zheng, Cui, Song, Su, Deng, Wu, Wang, Wang, Rao, Lin, Wang, Amine and Pan62
partial molar volume of Li in NMC Ω = 1.3 × 10⁻³⁰ m3,
Reference Koyama, Tanaka, Adachi, Makimura and Ohzuku63
the activity coefficient γ = 1, and the temperature T = 300 K. The constitutive behavior of inactive matrix is described by a Neo-Hookean material model with the Young's modulus E = 4.2 GPa and Poisson's ratio v = 0.3.
Reference de Vasconcelos, Xu, Li and Zhao41
The volumetric strains of NMC materials upon full lithiation are in the range of 4–10%.
Reference Koyama, Tanaka, Adachi, Makimura and Ohzuku63
We set the volumetric strain 9% at the fully lithiated state in the numerical calculations and assume the deformation is linearly proportional to the Li concentration. Therefore, the maximum Li concentration can be calculated as C
max = 0.09/Ω. We also systematically vary the volumetric strain to study its influence on the mechanical and electrochemical performance of the electrodes. To model the potentiostatic lithiation process, we set a constant chemical potential μS on the surface of active particles which equals to the chemical potential of Li at the fully lithiated state of NMC without the influence of mechanical stresses,
 ${\mu _{\rm{S}}} = {\mu _0} + kT\,\log \left( {{{\Omega {C_{\max }}} \mathord{\left/ {\vphantom {{\Omega {C_{\max }}} {\det (F)}}} \right. \kern-\nulldelimiterspace} {\det (F)}}} \right)$
. For the galvanostatic lithiation, the time φ to reach the theoretical capacity of NMC is used to represent the charging rate. The nominal flux J
0 is then determined through the relationship
 ${V_{{\rm{NMC}}}}{C_{\max }} = {S_{{\rm{NMC}}}}{J_0}\varphi$
. At the charging rate φ = 1 h, J
0 = 5.54 × 10⁻⁵ mol/m2.
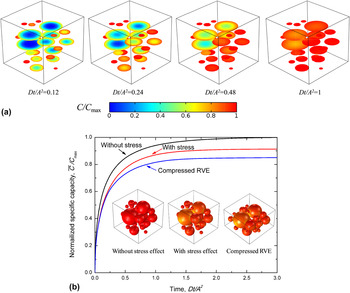
The stress field and Li concentration within the composite electrode are solved simultaneously. We demonstrate the evolution of stresses and the mechanical interactions regulated Li transport under the potentiostatic lithiation condition. Figure 5(a) shows the sectional view of Li profiles in the uncompressed RVE at different dimensionless time steps
 $\bar t = {{Dt} \mathord{\left/ {\vphantom {{Dt} {{A^2}}}} \right. \kern-\nulldelimiterspace} {{A^2}}}$
. As expected, lithiation proceeds at different degrees in the particles of different sizes. Particles of small size are lithiated much faster than those large particles. Within individual particles, Li distribution is highly inhomogeneous where the outer shell region is Li rich and the inner core is Li poor. The gradient of Li concentration induces mismatch strains and generates compressive stresses in the outer shell regions and tension around the inner core. Meanwhile, the expansion of particles is constrained by the inactive matrix as well as neighboring particles, inducing an extra compressive stress field in the particles. The magnitude of this additional compressive stress depends on the Li concentration in the active particles, the size and pattern of the active particles, as well as the mechanical properties of the active and inactive materials. The stresses influence the Li transport in the way that the stress gradient within a particle tends to homogenize the distribution of Li and drives Li diffusion from the compressed region (Li rich) to the tensed side (Li poor).
The effect of mechanical interactions on Li distribution and capacity of the RVE. (a) The sectional view of Li profiles at different time steps during potentiostatic lithiation of the RVE. Li diffusion is driven by both the Li concentration gradient and the stress field. (b) Normalized specific capacity as a function of the lithiation time for the uncompressed RVE with (red line) and without (black line) including the stress effect on diffusion and for the compressed RVE including the stress effect (blue line), respectively. Inset figures show the Li distribution at the fully lithiated state for the three cases.

The inhomogeneity of Li distribution reduces the effective capacity of the composite electrodes. With regard to the stress effect on the capacity, the local compressive stresses increase the chemical potential of Li, impeding the Li insertion and thus reducing the deliverable capacity. To demonstrate the extent of the stress modulated capacity, we simulate lithiation in three sets of samples: uncompressed RVE with and without including the stress effect on Li diffusion, and compressed RVE with the stress effect. Figure 5(b) plots the normalized specific capacity
 ${{\bar C} \mathord{\left/ {\vphantom {{\bar C} {{C_{\max }}}}} \right. \kern-\nulldelimiterspace} {{C_{\max }}}}$
as a function of the lithiation time in the three cases where
 $\bar C$
represents the average Li concentration over all the NMC particles. The specific capacity increases quickly at the initial stage of lithiation because of the large driving force of chemical potential, and then gradually approach to the steady state. Without considering the stress effect on Li diffusion (black line), the normalized capacity reaches the unit at the fully lithiated state and Li insertion in each single particle is saturated. In comparison, the uncompressed RVE shows a significant loss of capacity (∼10%) at the fully lithiated state if the stress effect on Li diffusion is accounted (red line). For compressed RVE (blue line), the capacity is reduced to an even larger extent. This is due to the fact that the smaller particle spacing in the compressed samples induces a higher compressive stress filed in both the active particles and the inactive matrix. More discussions about the stress evolution within the particles upon lithiation can be found in our previous work.
Reference Xu and Zhao51
The inset snapshots in Fig. 5(b) show the Li profiles in the three configurations upon full lithiation. It is evident that Li insertion is blocked in the regions where large compressive stresses develop. Fig. S2 in the Supplementary Material shows the local microstructural details and the correspondence between the Li distribution and mean stresses in the uncompressed RVE without and with the stress effect in comparison with the results of the compressed RVE.
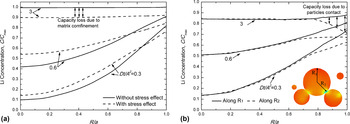
To further examine the compressive stress induced capacity loss, we look into the individual contributions due to the matrix confinement and particles contact. Figure 6(a) plots the distribution of Li concentration along the radius of a particle which is free of contact with its neighbors. The solid and dashed lines represent the Li profile at different lithiation steps without and with including the stress effect on Li diffusion, respectively. The compressive stresses developed by the mechanical constraint of the inactive matrix smooth the Li concentration gradient in the particle. At the fully lithiated state, the compressive stress exerted on the outer surface of the particle counterbalances the driving force of concentration gradient for Li diffusion and blocks further insertion of Li. The ∼10% capacity loss at the terminal state of lithiation is attributed to the mechanical confinement of the matrix. In another particle, Fig. 6(b) plots the Li distribution along two radii, where R 1 represents the direction along which the particle is free of contact with others (solid line), and R 2 represents the direction along which the particle is in contact with its neighbor (dashed line). The difference of Li concentrations along the two orientations represents the capacity loss due to the particles contact. The local contact generates a large magnitude of compressive stresses that cause deficiency of Li storage around the outer regime of the particle. The inhomogeneity of Li profiles also induces anisotropic deformation of the particle that the spherical particle may evolve into nonspherical shapes.
Capacity loss due to the mechanical confinement of the matrix and particles contact. (a) Radial distribution of Li in a particle which is free of contact with its neighbors. The mechanical confinement is provided only by the matrix. The solid and dashed lines represent the results calculated with and without accounting for the stress effect on Li diffusion, respectively. The compressive stresses developed by the matrix confinement tend to homogenize the Li distribution within the active particles and decrease the effective capacity. (b) Li profiles along two radii of different orientations. R 1 represents the direction along which the particle is free of contact with others, and R 2 represents the direction along which the particle is in contact with its neighbor.

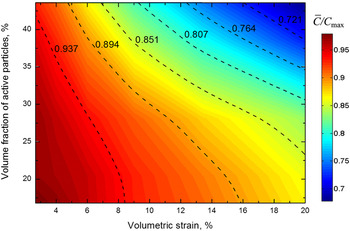
The accessible capacity of the composite electrodes depends on the internal stresses. The stress field in the active particles dynamically evolves in the electrochemical processes of Li insertion and extraction, and is further determined by the geometric features of the particles, the volume fraction of the active materials, the volumetric expansion during lithiation, and the effective properties of the matrix. We screen the specific capacity of the electrodes in terms of the variation of the volume fraction of the active particles V
f and the volumetric strain upon full lithiation εV. Figure 7 shows the contour plot of the normalized specific capacity
 ${{\bar C} \mathord{\left/ {\vphantom {{\bar C} {{C_{\max }}}}} \right. \kern-\nulldelimiterspace} {{C_{\max }}}}$
. The capacity decrease as V
f and εV increase (upper right regime in Fig. 7) because both the higher occupancy and larger deformation of the active material result in severe mechanical interactions among the constituted components which in turn reduce the effective capacity. The dependence on V
f indicates that the effective capacity of the composite electrode is not linearly scaled with the mass of the active material, but is limited by the inhomogeneous storage of Li that is modulated by the mechanical stresses. In terms of the volumetric strain εV, albeit smaller values compared to that in high-capacity electrodes, the stress can still be significant because the active particles are usually ceramic-like materials with high stiffness. In addition to the two studied parameters, the contour plot of capacity can be extended to multi-dimensions by including, for instance, the stiffness ratio of the active and inactive materials, the sphericity of the particles, the distance of neighboring particles, among others. There is a wide spectrum in the design of composite electrodes to reach the optimum electrochemical behaviors and mechanical performance. The computational program provides a viable tool in the selection of materials and design of the geometries of the constituted components. For the interest of different boundary conditions, Fig. S3 in the Supplementary Material shows the results of galvanostatic lithiation including the specific capacity of the electrodes at different charging rates and the influence of the stress field on the capacity retention. Same conclusion is drawn that the stress field regulates Li transport and large compressive stresses may significantly reduce the capacity of the composite electrodes.
Contour plot of specific capacity of the composite electrode in terms of the volumetric strain and volume fraction of the active particles. Higher values of the volume fraction and the volumetric strain (upper right region) significantly reduce the effective specific capacity because of the mechanical interactions of the constituent components.

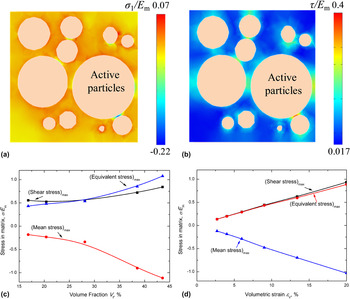
Another important aspect in the design of composite electrodes is to avoid the structural disintegration due to the fracture of the conductive matrix or interfacial debonding between the active material and the matrix. The potential failure can be dictated by the stresses in the matrix. Figures 8(a) and 8(b) show the distribution of the first principal stress and shear stress in a cross section of the inactive matrix at fully lithiated state. The maximum stresses in the matrix are located at the regimes in between the close particles. The normal stress may cause the tear of the polymer matrix or irreversible morphology changes. On the other hand, the shear stress is the major cause of the interfacial debonding between the particles and the matrix. The disconnection of the particle network ultimately isolates the active particles and increases the ohmic and thermal resistance of the electrodes—another known factor that causes persistent capacity loss of the electrodes over cycles. Figures 8(c) and 8(d) plot the quantitative characterization of the stresses (maximum shear stress, equivalent stress, and mean stress) in the matrix as a function of the volume fraction V f and the volumetric strain εV, respectively. The magnitude of the three stress components increases with an almost proportional relationship with the two variables. In the limiting cases of V f = 40% and εV = 20%, the stresses reach the value of the stiffness of the matrix. Such large stresses are hardly sustainable for the polymer matrix. The damage evolution in the matrix will be a topic of interest to be explored in future studies.
Plots of (a) the first principal stress and (b) shear stress in the matrix. The regions in between two particles are subject to large stresses that might lead to fracture or debonding of inactive matrix during lithiation. The maximum shear stress, equivalent stress, and mean stress in the matrix as a function of (c) the volume fraction and (d) the volumetric strain of the active particles.

Large deformation and geometric nonlinearly are challenging topics in continuum mechanics. To demonstrate the capability of the computational program for the materials experiencing large elasto-plasticity during Li insertion, we investigate mechanical behaviors and stress modulated Li transport in SnO composite electrodes. Metal oxides hold the great promise of high-capacity anodes to replace the conventional graphite materials. Most studies on metal oxides have been focused on their electrochemical performance and the reaction mechanisms. On the mechanical aspect, a large volumetric strain (∼100%) is often associated with the lithiation process in metal oxides that challenges the structural stability in the long-term cycles. However, the mechanical behaviors of oxide electrodes have been rarely explored. We reconstruct the 3D model of SnO composites and import the RVE into the finite element program. Details are described in Sec. III. The material properties for SnO particles are assumed to be constant. We set Young's modulus E
SnO = 50 GPa,
Reference Qaiser, Kim, Hong and Han64
Poisson's ratio v
SnO = 0.3, yield strength σY = 200 MPa,
Reference Qaiser, Kim, Hong and Han64
Li diffusivity D = 10−13 m2/s,
Reference Winter and Besenhard65
partial molar volume of Li in SnO Ω = 1.35 × 10⁻²⁹ m3,
Reference Ebner, Marone, Stampanoni and Wood59
the activity coefficient γ = 1, and the temperature T = 300 K. Experimental results show that the volume strain of SnO is proportional to the lithiation state and reaches 258% upon fully lithiated.
Reference Ebner, Marone, Stampanoni and Wood59,Reference Courtney and Dahn66
Therefore, we assume the volume expansion of SnO as a linear function of Li concentration and set the maximum Li concentration C
max = 2.6/ΩSnO. We adopt an elastic and perfect plastic constitutive model that SnO particles yield when the equivalent stress reaches the yield strength σY. We simulate the galvanostatic lithiation. The time to reach the theoretical capacity of SnO is set to be φ, and the nominal flux J
0 is determined through the relationship
 ${V_{{\rm{SnO}}}}{C_{\max }} = {S_{{\rm{SnO}}}}{J_0}\varphi$
. For the lithiation rate φ = 2 h, J
0 = 1.32 × 10⁻⁴ mol/m2.
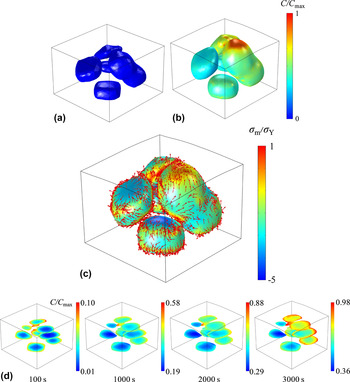
Different from the spherical NMC particles, the fabricated SnO shows irregular shapes and rough surfaces. The geometric features will influence the Li distribution and determine the stress field. Li tends to accumulate at the regions of smaller surface curvature. Meanwhile, stresses are concentrated at the edges and corners which place a strong driving force of Li diffusion. Figures 9(a) and 9(b) show the Li distribution in the SnO particles before lithiation and after Li insertion for 1 h. It is evident that lithiation in different particles proceeds at different stages. Within individual particles, Li distribution is highly inhomogeneous that Li is concentrated in the bulged regimes of smaller surface curvature. The particles are color coded by the magnitude of the mean stress in Fig. 9(c) and the red arrows show the local Li flux. The local tensile stress attracts Li insertion while compressive stresses drive Li away. Figure 9(d) shows the cross-sectional view of Li profiles in the reconstructed RVE at different time steps. The aggregated particles of irregular shapes show higher concentration of Li because of the effects of both the surface curvature and the mechanical stress. The high disparity of Li concentration over the active particles generally compromises the electrochemical performance of the battery packages. Recent studies Reference Ebner, Geldmacher, Marone, Stampanoni and Wood58,Reference Garcıa, Chiang, Carter, Limthongkul and Bishop67 have also pointed out that the mechanical and electrochemical performance of electrodes can be improved if the active particles are synthesized with the control of size, shape, and alignment.
Li distribution in the SnO particles (a) before lithiation and (b) after galvanostatic lithiation for 1 h. (c) The profiles of mean stresses and Li flux within the particles. The particles are color coded by the magnitude of mean stresses where blue color represents the regimes under large compressive stresses and red color shows the regimes under large tensile stresses. Li flux is represented by the red arrows. It is evident that local tensile stresses attract Li while the compressive stresses drive Li away. (d) Cross-sectional visualization of Li profiles in the reconstructed RVE at different time steps during the galvanostatic lithiation.

V. CONCLUSION
The mechanical stresses and electrochemical behaviors of Li-ion batteries are intimately coupled. While the mechanical failure of batteries is well recognized in the research community, the stress regulated Li transport and thus the deliverable capacity of batteries have been overlooked. The dynamic nature of mechanical interactions in the heterogeneous composite electrodes adds a further challenge in characterizing the stress effect. We develop a finite element program that computes coupled Li diffusion and stresses for three-dimensional composite electrodes. We employ the reconstructed models for commercial batteries to study the co-evolution of stresses and Li storage. The NMC cathode represents the intercalation-type electrodes of spherical shape and small deformation, while the SnO anode represents the high-capacity materials of irregular shapes and dramatic volumetric change upon Li insertion. The state of charge in the percolated active particles is highly inhomogeneous regulated by the stress field. Significant capacity loss is possible due to the mechanical confinement of the inactive matrix and particles contact. A multi-dimensional space of design is open for the optimization of the mechanical and electrochemical performance of composite electrodes by the selection of the geometry, network, and properties of the active particles and the surrounding medium.
Supplementary Material
To view supplementary material for this article, please visit http://dx.doi.org/10.1557/jmr.2016.302.
ACKNOWLEDGMENTS
This work is supported by the National Science Foundation through the grant CBET-1603866. L.S. is grateful for the support of CAPES Foundation from the Brazil Ministry of Education. We acknowledge the generous supply of tomography data of NMC and SnO electrodes by Dr. Martin Ebner from the Wood group at ETH Zurich.