Introduction
Germination studies are conducted to answer a wide range of questions in plant ecology and management. Such studies can provide objective criteria to aid decision-making in conservation of endangered or threatened species, and management of invasive aliens and weeds. For example, studies on seed germination and viability provide much needed information on the quality of seed collections in ex situ conservation facilities (Godefroid et al., Reference Godefroid, Van de Vyver and Vanderborght2010). In such studies, the final germination, germination time, rate, homogeneity and synchrony (Ranal and De Santana, Reference Ranal and De Santana2006; Onofri et al., Reference Onofri, Gresta and Tei2010) may be analysed. However, the final germination is commonly presented as a percentage value (or proportion) for a sample of seeds, and this is subjected to statistical tests (Ranal and De Santana, Reference Ranal and De Santana2006). However, analyses are often undertaken without consideration of the appropriateness of particular tests and the associated assumptions. The use of appropriate statistical tests will enable the researcher to judge how well the apparent patterns in samples reflect real patterns in the population being studied.
When analysing data, researchers need to take the necessary precaution to guard against two types of errors: Type I (false positive) and Type II (false negative) errors. Type I error is the error of rejecting a true null hypothesis or declaring differences statistically significant when they occurred only due to chance. For example, a researcher commits Type I error by declaring that treatment A prolongs the viability of seeds in storage more than treatment B, when in fact there is no difference between A and B. On the other hand, Type II error is declaring that treatment A is not different from B, when in fact it is. Type I error must be guarded against at all costs because pursuing false leads can result in the wastage of time and scarce resources. Such errors can also lead to loss of irreplaceable genetic material if ineffective treatments are erroneously declared effective for prolonging seed viability in conservation facilities. Because of the prejudice in reporting only significant results, once made, Type I errors are also very difficult to correct (Keselman et al., Reference Keselman, Cribbie and Holland1999). The result of Type II error is the exclusion of important factors that influence the response because non-significant results appear definitive and tend to discourage further investigation.
The objective of this opinion piece is to present an objective assessment of current trends in statistical analysis and to draw the attention of readers to the limitations of the usual inferential statistics in controlling error rates. The opinions expressed here are based on a survey of studies published in the past 11 years (January 2000 to December 2010). The review is deliberately limited to studies that performed statistical tests on final percentage (or proportional) germination and/or viability using either discrete or continuous explanatory variables. Studies that entirely focused on germination progress and survival analysis were not considered in this review because powerful modelling approaches already exist (Hara, Reference Hara2005; Onofri et al., Reference Onofri, Gresta and Tei2010). Such studies include those that look at the effect of one or more continuous explanatory variables (e.g. time, temperature or concentration) and data other than the final germination are of interest. In total, 429 publications were found through this focused search. The studies were published in 139 peer-reviewed journals dealing with divergent disciplines. In some papers several species were studied. Thus the review covered over 1200 species of seed-producing plants. The diversity of journals and species covered in this survey obviously provides a good representation of the current trends in the statistical analysis of such data.
To demonstrate the various analyses, I will use an example dataset (Table 4 in Piepho, Reference Piepho2003) from a laboratory experiment performed by S. Gruber (Universität Hohenheim, Germany). The main objective of the study was to compare seed dormancy in genetically modified (GM) with that in near isogenic varieties of oil-seed rape (Piepho, Reference Piepho2003). Four of the varieties had GM and corresponding near isogenic counterparts, while the fifth variety was the control. For each variety, seeds were placed on four Petri dishes, which were allocated to containers, and the experiment was replicated three times. After each experiment, the proportion of dormant seeds was determined. There were two datasets for the isogenic line of variety 4 as it was propagated in two locations. For the present analyses, the two datasets were combined. This was chosen as a good example because it had unequal sample sizes, a missing value (e.g. in the control) and a large number of treatments typical of datasets from germination studies. The other advantage of this dataset is that it was statistically analysed elsewhere (Piepho, Reference Piepho2003) and its properties are known. I will use the proportion of germinated seeds (labelled Germ) to demonstrate the various tests using the SAS system (SAS Institute Inc., Cary, North Carolina, USA). Germ was calculated as n/T where n is the number of germinated seeds and T is total number of seeds per container (cont). For the benefit of readers, I have presented the SAS codes in supplementary appendices (see supplementary appendices 1–5, available online only at http://journals.cambridge.org/).
Current trends in statistical analyses
Most of the papers reviewed here have analysed final germination and viability datasets concurrently. There were also cases where germination and viability had been compared. Therefore, any reference to data hereafter strictly means percentage (or proportional) germination and/or viability datasets. To elucidate the trends, I conducted a simple linear regression of the number of publications against year on a log-log scale. I used the coefficient of variation (CV in %) to determine inter-annual variability in the reported use of the various tests. I also conducted a one-sample binomial test of the proportion of researchers who applied ANOVA and tests to evaluate violation of its assumptions. For brevity, I will only report the coefficient of determination (R 2), binomial proportions (BP) and their 95% confidence limits (95% CL) based on exact tests and significance (P value) wherever I have done statistical analyses.
Based on the core issue they addressed, the studies fall under four broad areas: (1) conservation of endangered/threatened species; (2) management of invasive alien species; (3) control of arable weeds; and (4) general ecological studies on species of agricultural, horticultural, forestry and pasture value (Fig. 1a). Across the various disciplines the total number of studies that analysed germination data increased significantly (R 2 = 0.924; P < 0.001) from 2000 to 2011 (Fig. 1a). The methods used in data analysis fall under five broad categories: (1) ANOVA; (2) distribution-free or non-parametric tests (NPARTs); (3) linear mixed models (LMMs); (4) generalized linear models (GLMs); and (5) generalized linear mixed models (GLMM). Figure 1b shows the trends in the use of each of these methods in the past 11 years.
Trends in the number of published studies in different disciplines (a) and the statistical models used (b) for analysis of percentage seed germination and viability data.

For brevity, I will discuss the t- and F-tests under the broad term of ANOVA, since both tests are derived based on the same set of assumptions, and the t-test produces P values identical to the F-test when applied to two-sample tests for equal variance (Kikvidze and Moya-Laraño, Reference Kikvidze and Moya-Laraño2008). Overall, the largest proportion of studies have used ANOVA (0.70) with very small inter-annual variability (CV = 11.5%). The proportion of studies that used GLMs was 0.13 (CV = 50.4%), NPARTs was 0.11 (CV = 30.6%) and GLMMs was 0.04 (CV = 80.2%). The proportion of studies that used LMMs was the smallest (0.02) and had very high inter-annual variability (CV = 118. 3%). While various tests appropriate for binary data are readily available in most statistical packages, ANOVA continues to be the test of choice in the analysis of final germination (Fig. 1b). According to the one-sample binomial test, a small proportion (BP = 0.32; 95% CL = 0.27–0.37) of researchers have used methods other than ANOVA; a significantly (P < 0.0001) larger proportion of researchers have used ANOVA. The popularity of ANOVA is probably an indication of the orthodoxy (adherence to tradition) in the choice of statistical tests rather than its superiority over others. Some researchers used NPARTS when their data failed to meet ANOVA assumptions. These included the Kruskal–Wallis H (28 studies), Mann–Whitney U (12 studies) and chi-square (10 studies) tests. The reasoning was that NPARTs require few, if any, assumptions. This misconception is not surprising because the virtues of NPARTs are overstated while their deficiencies are often overlooked (Johnson, Reference Johnson1995).
Major areas of concern
The review revealed a number of issues that are likely to affect error rates. However, for economy of space the various issues will be discussed under the following broad categories.
Pseudoreplication and use of a few replicates
In 15 out of the 429 studies the number of replicates used was not clear. Therefore, the following analysis is based on the remaining 414 studies. In germination studies it is possible to replicate at different levels, e.g. blocks, experimental units (Petri dish, tray, plot), seed, etc. If significance tests are to be employed, replication is mandatory at the level of the experimental unit. The treatment should be applied to each experimental unit independently to allow estimation of the population response to the treatment. If only a single replication is used, even if the treatment is applied to a number of seeds, any particular of that single application would affect all the seeds, and this could be confused with a treatment effect. A single replication per treatment was used in 4.4% of the studies reviewed (Fig. 2a). This problem was recorded in 17.4% of the studies that conducted logistic regression. In those studies treatments were applied to a single experimental unit (e.g. Petri dishes) and each seed was treated as a replicate. In such cases, the treatment is unreplicated, while the observational units nested within that single application have been replicated, and the Petri dishes/trays are functioning solely as independent replicates of the variability in germination response within the seed batch used (Morrison and Morris, Reference Morrison and Morris2000). This is a form of pseudoreplication (Hurlbert, Reference Hurlbert1984; Morrison and Morris, Reference Morrison and Morris2000). Any observed difference in germination may be due to the germination treatment but, potentially, it could also be due to any chance event affecting the treated sample (Morrison and Morris, Reference Morrison and Morris2000). True replication would require that each replicate experimental unit be treated on separate occasions. Morrison and Morris (Reference Morrison and Morris2000) describe this problem in detail in the context of studies that involve heat, smoke and charcoal.
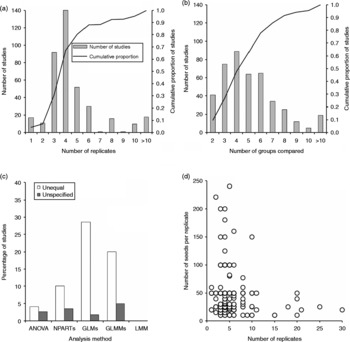
The number of replicates used in all studies (a), the number of groups compared (b), percentage of studies with unequal or unspecified number of replicates (c), and number of seeds per replicate (d). In (a) and (b) solid bars represent the number of studies while smooth lines are the cumulative proportion of studies.
In the course of this review I have come across pseudoreplication in a number of studies involving gut passage. The most common situation is where researchers subdivided seeds from the same faecal samples (e.g. animal dropping, scats, etc.) into several Petri dishes and used these as replicates. This obviously constitutes another example of pseudoreplication because seeds from the same faecal sample do not constitute independent samples (Figuerola et al., Reference Figuerola, Green and Santamaría2002). For clarity, pseudoreplication (sensu Hurlbert, Reference Hurlbert1984) is defined here as the use of inferential statistics to test for treatment effects with data from experiments where either treatments are not replicated (though observational units such as seeds may be) or replicates are not statistically independent. In terms of ANOVA, this represents testing for treatment effects with an error term inappropriate to the hypothesis being considered (Hurlbert, Reference Hurlbert1984).
Another critical question in germination studies is the number of replicates required to detect significant differences between the groups compared. If too few replicates are used, there may be little chance to detect a meaningful effect even when it exists. By contrast, if the sample size is very large, even trivial differences between independent proportions may become statistically significant (Tryon and Lewis, Reference Tryon and Lewis2009). There is no particular number of replicates that fits all studies because this usually depends on the resources available to the researcher (seeds, labour, time, funding, etc.), the model used for analysis and the variability in the data. More observations are needed if a model has many parameters, or if a maximum likelihood estimation method is used than otherwise. The number of replicates needed will also be higher if variability in germination is high. Nevertheless, in the majority of the studies reviewed there was a tendency to use 3–5 replicates (Fig. 2a). There were also cases where the control was replicated twice and the other treatments replicated three or more times. Depending on variance heterogeneity, ANOVA results can be invalid if the number of replicates is small. The NPARTs are also not appropriate if replicate observations are fewer than five (Khan and Rayner, Reference Khan and Rayner2003). However, over 60% of the studies that performed NPARTs have used fewer than five replicates. Simulation studies show that for normally distributed data, ANOVA is better than the Kruskal–Wallis test for smaller sample sizes (Khan and Rayner, Reference Khan and Rayner2003). The Kruskal–Wallis test performs better than the ANOVA if the sample sizes are large and kurtosis is high. Even if more than five replicates are used, errors could still be large for ANOVA and NPARTs if other assumptions are violated. According to simulation studies by Warton and Hui (Reference Warton and Hui2011), Type I error for logistic regression and GLMMs is higher with small sample sizes (n < 6) than for larger sizes.
The number of replicates in most studies seems to be chosen arbitrarily. It does not seem to be related to the number of groups being compared as there was very weak association between the two variables (Spearman r = − 0.042; P = 0.415; n = 388). The majority (61%) of studies also compared 2–6 groups (Fig. 2b). Although the number of replicates was significantly associated with the number of seeds per replicate (Spearman r = 0.147; P = 0.007; n = 334), shortage of seeds does not adequately explain the tendency to choose 3–4 replicates. Obviously, the availability of seed, especially for some endangered or threatened species, could be a constraint. In the majority of studies, 20–50 seeds were allocated to each replicate (Fig. 2d). A key question in such situations is whether to allocate a small number of seeds in more replicates or more seeds in fewer replicates. For example if one has only 150 seeds available for each treatment, much better power may be obtained by using six replicates of 25 seeds than three replicates of 50 seeds per replicate.
Ignoring test assumptions
There is no doubt that the t- and F-test and their non-parametric counterparts will continue to be the cornerstones of hypothesis testing in germination studies. However, application of these tests is now so widespread that some researchers seem to have forgotten that data should meet certain assumptions. In a recent paper, Valcu and Valcu (Reference Valcu and Valcu2011) show how widespread this problem is in the application of the t-test. ANOVA will provide a powerful test of null hypotheses only if the following assumptions are met in the data being analysed: (1) the errors are normally distributed; (2) the variances are approximately equal (homoscedastic); (3) the error terms are independent or uncorrelated; and (4) the treatment and error terms are additive. Most multiple comparison tests were also derived under the restriction that these assumptions are satisfied and the design is balanced. However, these assumptions can be violated in many more ways than they can be satisfied (Khan and Rayner, Reference Khan and Rayner2003). Therefore, it is crucial to evaluate violation of one or more of these assumptions before conducting ANOVA and post-ANOVA tests. Nevertheless, there was no indication in a significantly (P < 0.0001) large proportion of the studies that normality (BP = 0.80; 95% CL = 0.75–0.85) or homoscedasticity (BP = 0.81; 95% CL = 0.76–0.85) were evaluated at all. Like ANOVA, the Kruskal–Wallis and Mann–Whitney U-test assume that samples are random, variances are homogeneous, observations are mutually independent and the shape of the data distribution is the same in each group. Nevertheless, in most studies these tests appear to have been performed as if they do not make any assumption at all. For example, only a small proportion ( < 0.18) of researchers have reported evaluating the data for normality or homoscedasticity before conducting NPARTs. In almost all studies there was no evidence that violations of additivity and independence of errors have been evaluated. In the following sections, I will describe situations where germination data violate assumptions of ANOVA and NPARTs and highlight the implications of such problems to Type I and Type II error rates.
Non-normality
ANOVA has often been claimed to be robust to violations of the normality assumption based on the Central Limit Theorem. The robustness of t- and F-tests increases with sample size (Miller, Reference Miller1986). There are two different aspects of normality (kurtosis and skewness of the error distribution) that can affect conclusions drawn from ANOVA and its non-parametric counterparts (Khan and Rayner, Reference Khan and Rayner2003; Zimmerman, Reference Zimmerman2004). For both the t- and F-tests to be valid, not the original data but the errors must be independently and identically distributed normal variates. Otherwise, the probabilities provided in the t- and F-distribution tables will not be accurate. Many biologists have presented evidence indicating that non-normality is prevalent in ecological data (Potvin and Roff, Reference Potvin and Roff1993). For example, Ahrens et al. (Reference Ahrens, Cox and Budhwar1990) found non-normality in 50–75% of 82 weed-control datasets and in 29–100% of 62 winter wheat survival datasets. Non-normality is probably the rule rather than the exception in percentage germination and viability datasets. Such data are expected to strictly fit the binomial distribution since the response of each seed can only take one of two possible values, 1 for germination or 0 for failure (Onofri et al., Reference Onofri, Gresta and Tei2010; Thompson and Ooi, Reference Thompson and Ooi2010). Only a small percentage (19.5%) of the studies that performed ANOVA has reported using either graphical diagnostics or formal tests to evaluate the residuals for normality. In the remaining 80% of the cases tests may not have been carried out at all or, if carried out, were not reported. Of the studies evaluating residuals for normality 42.1% did not specify the type of test, while 33.3% mentioned using residual plots. The remaining studies performed either Kolmogorov–Smirnov (14.0%) or Shapiro–Wilk (10.5%) tests. Each of these tests has its own strengths and limitations, and may give widely differing results. For example, for the rape seed germination dataset, the residuals of the untransformed germination percentages were approximately normal according to the Shapiro–Wilk test (P = 0.2135) but non-normal (P < 0.05) according to the other tests (Table 1). The Kolmogorov–Smirnov statistic has poor power to detect non-normality if the sample size is less than 2000. According to a simulation study by Razali and Wah (Reference Razali, M and Wah2011), the power of Kolmogorov–Smirnov, Shapiro–Wilk and Anderson–Darling tests is very low for sample sizes smaller than 50. Only the Shapiro–Wilk test was powerful enough to detect departures from normality in data with sample sizes of 50–100 (Razali and Wah, Reference Razali, M and Wah2011). Judging from the number of replicates used (Fig. 2a) and groups compared (Fig. 2b) typical germination studies have analysed data with sample sizes of less than 50. The various tests also seem to be chosen arbitrarily, and the aim of testing for normality was often not clear. It must be noted that detecting statistically significant departures from normality is not the same as detecting departures from normality that are serious enough to distort results. Even statistically non-significant departures may seriously distort results. Considering the nature of germination data and the small sample size used, it is doubtful that assuming normality is meaningful and testing for normality is worth the trouble.
Tests of normality of errors, homogeneity of variance and additivity of effects in the germination proportion of rape seed, calculated from Table 4 of Piepho (Reference Piepho2003)

Heteroscedasticity
Heteroscedasticity is said to exist when the standard deviation (σ1) of one group is larger than the standard deviations (σ2,…,σ n ) of the other groups. Empirical studies show that violations of this assumption are very common in percentage data (Ahrens et al., Reference Ahrens, Cox and Budhwar1990; Sileshi, Reference Sileshi2007). For example, Ahrens et al. (Reference Ahrens, Cox and Budhwar1990) found violations in 60–90% of 144 percentage datasets. Such data are expected to have unequal variance for a number of reasons. First, the variance of binomial proportions is a quadratic function of the mean, i.e. variances tend to be small at both ends of the range of values (close to 0 and 100%) but larger in the middle (around 50%). This is because the most ineffective treatments typically yield replicate observations with no germination and zero variance, while the most effective treatments yield closer to 100% germination and variances close to 1. Treatments with low to medium efficacy will vary quite widely. In addition, considerable variability and asynchrony is known to exist in seed germination. This is often related to dormancy over multiple delays, which has been the major premise of Cohen's classic model of diversification bet-hedging (Simons and Johnston, Reference Simons and Johnston2006). Viable seeds that have not germinated at the end of an experiment can also result in censored observations if assays are terminated before germination is complete, due to resource constraints (Onofri et al., Reference Onofri, Gresta and Tei2010).
It has long been known that robustness of ANOVA to heteroscedasticity depends critically on the sampling design; the less balanced the design, the less robust is ANOVA (Miller, Reference Miller1986). More recent studies show that under combined violations of normality and homoscedasticity, the true significance level and power of the tests depend on a complex interplay of factors, including the number of replicates used, the number of groups compared and balance in the study design (Fagerland and Sandvik, Reference Fagerland and Sandvik2009). Heteroscedasticity may affect both Type I and II error rates, and when sample sizes are unequal there is an additional effect on the error rate (Day and Quinn, Reference Day and Quinn1989). The t-test can result in severely biased Type I or Type II error rates when variances are unequal (Cribbie and Keselman, Reference Cribbie and Keselman2003). Even the Welch–Satterthwaite modification of the t-test for unequal variance has inflated error rates if the data are skewed and sample sizes are unequal (Kikvidze and Moya-Laraño, Reference Kikvidze and Moya-Laraño2008). Based on simulation studies Rasch et al. (Reference Rasch, Kubinger and Moder2011) recommend that the t-test should not be used if variances are heterogeneous. The standard F-test was originally designed for balanced designs (samples of equal size). For moderate to large heteroscedasticity, the empirical Type I error rate for F-test is far beyond the nominal, even with balanced designs (Moder, Reference Moder2010). The situation gets more complicated when samples of unequal size are combined with unequal variance (Kikvidze and Moya-Laraño, Reference Kikvidze and Moya-Laraño2008; Moder, Reference Moder2010). When sample sizes are unequal or small (e.g. < 5 replicates per group) and/or the number of groups to be compared is large, even small departures from homoscedasticity may increase the error rates in the F-test (McGuinness, Reference McGuinness2002; Moder, Reference Moder2010). For example, when the smaller sample is associated with the smaller of the variances, ANOVA showed very low Type I error but very high Type II error rates (Kikvidze and Moya-Laraño, Reference Kikvidze and Moya-Laraño2008).
Uncritical literature, especially some writings on the Internet, often recommend the use of NPARTs when group variances are heterogeneous. However, a number of critical studies (Day and Quinn, Reference Day and Quinn1989; Wang and Zhou, Reference Wang and Zhou2005; Fagerland and Sandvik, Reference Fagerland and Sandvik2009; Moder, Reference Moder2010; Rasch et al., Reference Rasch, Kubinger and Moder2011; Zimmerman, Reference Zimmerman2011) show that heteroscedasticity can lead to incorrect inference using NPARTs. Recent studies demonstrate that the significance levels of the Kruskal–Wallis and Mann–Whitney tests are substantially biased by heteroscedasticity among treatment groups. According to a simulation study by Rasch et al. (Reference Rasch, Kubinger and Moder2011), for various combinations of non-normal distribution shapes and heteroscedasticity, the Type I error probability of the Mann–Whitney U-test was biased to a far greater extent than that of its parametric counterpart, the Student t-test. Fagerland and Sandvik (Reference Fagerland and Sandvik2009) demonstrated that small differences in variances and moderate degrees of skewness can produce large deviations from the nominal Type I error rate for the U-test. The U-test was also strongly affected by unequal variance in large samples (Kikvidze and Moya-Laraño, Reference Kikvidze and Moya-Laraño2008). Type I error rates for the Kruskal–Wallis test also become severely inflated when variances are unequal (Cribbie and Keselman, Reference Cribbie and Keselman2003). A study by Moder (Reference Moder2010) similarly demonstrated that the Kruskal–Wallis test has high Type II error under moderate to large heteroscedasticity if the sample size is small ( < 5 replicates) or equal to the number of factor levels. The majority of the studies that applied ANOVA and NPARTs had fewer than five replicates (Fig. 2a); some with unequal number of replicates (Fig. 2c) and compared a large number of means (Fig. 2b, Table 1). In such cases, even moderate heteroscedasticity can lead to increased error rates.
In the majority (>80%) of the studies that performed ANOVA or NPARTs, violations of hommoscedasticity were not apparently evaluated; even where evaluation has been claimed to be made, arbitrarily chosen tests of homoscedasticity were used. Among those that performed ANOVA, graphical diagnostics (i.e. residual plots) were used in 41% of the studies. Leven's test was most frequently used (25.6% of studies that performed ANOVA) followed by Cochran's (20.5%), Bartlett's (7.7%) and Brown–Forsythe (5.1%) tests. Leven's test has a lower power when sample size is small, so it is less likely to indicate a problem with unequal variances. Leven's test was subsequently modified by Brown and Forsythe to make it more robust (McGuinness, Reference McGuinness2002). O'Brien's test is another modification of Leven's test. Both Leven's and Brown–Forsythe tests may yield inaccurate results when the design is unbalanced. In contrast to Leven's and Brown–Forsythe tests, Bartlett's test is sensitive to departures from normality resulting in too many significant results, especially with data from skewed distributions. Simulation studies by McGuinness (Reference McGuinness2002) showed that Cochran's test performs better than Bartlett's in many cases.
Obviously, each test has its own limitations. Besides, even non-significant departures from homoscedasticity can result in inflated error rates if the data are non-normal, the design is unbalanced and the sample sizes are small. Therefore, it makes little sense to recommend any of the formal tests for all kinds of data. As emphasized by McGuinness (Reference McGuinness2002), to conduct a formal test of homoscedasticity is rather like putting to sea in a rowing boat to find out whether conditions are sufficiently calm for an ocean liner to sail.
Non-independence
Correlations across levels of analysis are pervasive in natural processes. Likewise, violation of the assumption that error terms are independent is common in germination studies since observations are often clustered or repeated. It must be noted that violations of the independence assumption have a greater impact on results than non-normality and heteroscedasticity in ANOVA. This problem can be serious in studies that analyse germination progress, and this has been discussed in other publications. Since the focus of this research opinion is not on germination progress, I will limit my discussion to a few relevant examples.
Germination tests are generally conducted on replicate experimental units (e.g. Petri dishes, trays, pots, plots, etc.) containing several clustered observational units (e.g. seeds) that may be more or less correlated (Morrison and Morris, Reference Morrison and Morris2000; Onofri et al., Reference Onofri, Gresta and Tei2010). Recent studies have demonstrated that seeds are able to sense each other and influence the germination of a neighbouring seed (Tielbörger and Prasse, Reference Tielbörger and Prasse2009). The numbers of seeds counted on different dates from the same experimental unit will be serially correlated (Onofri et al., Reference Onofri, Gresta and Tei2010). Repeated observations on the same experimental unit at succeeding times may also result in autocorrelation of the errors. Pseudoreplication is another cause of non-independence in germination studies (Morrison and Morris, Reference Morrison and Morris2000).
Non-additivity
ANOVA assumes that the treatment and error terms are additive in randomized and replicated experiments. This implies that the magnitude of differences among treatments remains the same in all replicates, i.e. there is no interaction between treatments and replicates. However, violations of this assumption are common in percentage datasets. For example, Ahrens et al. (Reference Ahrens, Cox and Budhwar1990) found lack of additivity in 23–70% of 82 weed-control datasets and 52–76% of 62 winter wheat survival datasets. In germination studies, additivity can be achieved by allocating seeds to treatments randomly and, after treatment, arranging the replicates (e.g. Petri dishes, trays, etc.) randomly in the incubation area. If violations of this assumption are expected in the data, it is important to check this using Tukey's test (see supplementary appendix 2, available online only at http://journals.cambridge.org/) before interpreting the results. However, in none of the studies have researchers tested for additive effects.
Uncritical data transformation
When researchers suspect that their data do not satisfy ANOVA assumptions, they simply transformed the data and conducted the t- or F-test. A significantly (P < 0.0001) large proportion (BP = 0.67; 95% CL = 0.62–0.73) of the studies have employed some form of data transformation. A small proportion of those who transformed their data have indicated that they tested for normality (0.18) and homoscedasticity (0.17). In the literature, several transformations (i.e. arcsine or arcsine–square root, square root, logarithmic, logit, Box–Cox, Guerrero–Johnson and Aranda–Ordaz) have been suggested for binomial data presented as proportional (or percentage) values (Piepho, Reference Piepho2003). All of the transformations (except arcsine) fail when the value is equal to 0 or 1 (i.e. 100%). Piepho (Reference Piepho2003) proposed the folded exponential transformation which allows 0 and 1 values. Arcsine transformation was performed in the majority (87.6%) followed by the square root (6.2%), logarithmic (4.7%) and rank (1%) transformations.
The studies reviewed give an indication that arcsine transformation is being used carelessly. For example, studies involving several species used the same transformation function disregarding differences between species in their germination response to the same treatment. While data transformation in itself does not guarantee non-violations of ANOVA assumptions, only 9.6% of those who transformed their data have checked to see whether the desired effect has been achieved or not. Data transformation can have undesirable effects. For example, in a study of 144 percentage datasets, arcsine or square-root transformations resulted in non-normality in 9–20% of normal datasets, heteroscedasticity in 33–100% of homoscedastic datasets and non-additivity in 6–22% of additive datasets (Ahrens et al., Reference Ahrens, Cox and Budhwar1990). In addition, a transformation that corrects violation of one assumption may result in violation of another (Sileshi, Reference Sileshi2007). For example, arcsine transformation of the example dataset improved homoscedasticity (Table 1; see also Piepho, Reference Piepho2003). However, the residuals became less normal after transformation, as indicated by the various tests (Table 1). Recent work demonstrates that data transformation can even lead to increased rates of Type I or Type II errors (Jaeger, Reference Jaeger2008; Valcu and Valcu, Reference Valcu and Valcu2011; Warton and Hui, Reference Warton and Hui2011). Indeed, Warton and Hui (Reference Warton and Hui2011) recommended that the arcsine transformation should not be used at all for binomial data.
Arbitrary choice of multiple comparison tests
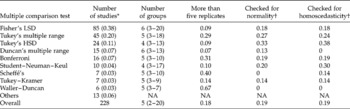
When analysing data, comparison of specific pairs or groups of means is of greater interest than the ANOVA test. Therefore, researchers routinely conduct multiple comparison tests (Shaffer, Reference Shaffer1995). A binomial test indicated that such tests were conducted in a significantly (P = 0.004) large proportion (0.57; 95% CL = 0.52–0.62) of the studies reviewed here. When those studies that performed ANOVA alone were considered, a much larger proportion (0.78; 95% CL = 0.73–0.83) of studies involved multiple comparison tests. In the statistical literature, there are many types of multiple comparison tests, all based on different assumptions and for different purposes. In total 16 different tests were used in those studies that performed ANOVA; those used most frequently are presented in Table 2. The entry labelled ‘Others’ in Table 2 included the Dunnett's test, used in three studies; Ryan–Einot–Gabriel–Welch (REGW) test, used in two studies; and Games–Howell and Scott–Knott tests, each used in one study. In almost all studies there was no explanation for the choice of the particular procedure. While the assumptions of normality and homoscedasticity are preconditions for post-ANOVA multiple comparison tests (Day and Quinn, Reference Day and Quinn1989), a very small proportion of researchers has evaluated data for violations of these assumptions (Table 2).
Multiple comparison test used in the studies that performed ANOVA, the median number of groups compared (range in parenthesies) and the proportion of studies where more than five replicates were used, and normality and homoscedasticity were reported to have been evaluated
LSD, least significant difference; HSD, honestly significant difference; NA = not applicable.
* Figures in parentheses represent the proportion of studies.
† This may be due to either lack of reporting or not carrying out these tests at all.
In the majority of studies, unplanned (post-hoc or a posteriori) multiple comparison tests were applied, while only a small proportion of studies (five out of 228) has applied planned (a priori) comparisons. Two out of the four studies that performed multiple comparisons have used orthogonal contrasts while the remaining three used Dunnett's procedure, which is designed to compare treatment groups with the control group. Unplanned tests may be regarded more as an afterthought. These are relevant when the researcher does not have any clear hypothesis about which means might differ from which others. When performing unplanned comparisons, researchers are faced with the problem of how best to control the probability of committing a Type I error. Selecting the statistically significant mean from a larger pool of means that also contain non-significant findings is problematic (Day and Quinn, Reference Day and Quinn1989; Shaffer, Reference Shaffer1995; Keselman et al., Reference Keselman, Cribbie and Holland1999). This is because when multiple tests of significance are computed, the probability that at least one will be significant by chance alone increases with the number of groups compared. The experiment-wise (family-wise) approach deals directly with the multiplicity problems by setting a level of significance for an entire experiment (family) of related hypotheses, while the comparison-wise approach ignores the multiplicity issue by setting the error rate on each individual contrast (Keselman et al., Reference Keselman, Cribbie and Holland1999).
Some of the tests in Table 2 control comparison-wise error rates while others control experiment-wise error rates. The majority of studies used Fisher's least significant difference (LSD) (Table 2) despite its limitations. LSD controls the Type I comparison-wise error rate but not the experiment-wise error rate. This test is not appropriate where the design is unbalanced and/or variances are unequal. It was also originally developed for orthogonal and planned comparisons. However, it has been used for making all possible pair-wise comparisons that look interesting. This misuse has led to the recommendation that Fisher's LSD be used after the F-test has been shown to be significant. This revised approach is often referred to as Fisher's protected LSD test. Both forms of LSD are more liberal than all other tests. The rest are more conservative and declare fewer significant differences than the LSD (Fig. 3). The more conservative a test is, the less powerful it is, and the lower the risk of making a Type I error. However, reducing the risk of making a Type I error increases the chance of making a Type II error.
Ranking of multiple-comparison procedures in order of decreasing power. DMRT, Duncan's Multiple Range; LSD, least significant difference; REGW, Ryan–Einot–Gabriel–Welch; SNK, Student–Newman–Keul's.
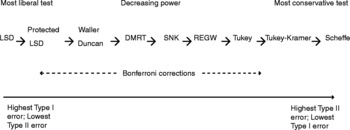
The other popular methods used in the studies reviewed are Tukey's, Duncan's Multiple Range (DMRT), Student–Newman–Keul's (SNK) and Scheffé's tests (Table 2). Tukey's honestly significant difference (HSD) and SNK control the Type I experiment-wise error rate. DMRT was developed as a modification of the SNK and as a compromise between LSD and Tukey's HSD. DMRT controls the comparison-wise error rate, and it is especially protective against Type II error at the expense of having a greater risk of making Type I errors. The SNK provides protection against both Type I and II errors. However, SNK is not appropriate where the design is unbalanced and/or variances are unequal. Scheffé's test was designed for all possible comparisons including pair-wise contrasts (Day and Quinn, Reference Day and Quinn1989). Scheffé's test can be used for either unplanned or planned multiple comparisons. The advantage of Scheffé's test is that it can be used where the design is unbalanced. However, it is the most conservative of the multiple comparison tests, and it is widely criticized for resulting in a higher than desired Type II error rate (Shaffer, Reference Shaffer1995). Among the less frequently used tests, REGW has generally a lower Type II error rate than Tukey's HSD. Games–Howell test does better than the Tukey HSD if variances are unequal or if the number of replicates is fewer than five. From the review above, it is clear that each multiple comparison test has a built-in bias towards the type of error to be controlled. As a result, the different tests may group treatments slightly differently, thus giving rise to ambiguous interpretations. The analysis of the oil seed germination dataset clearly reveals these differences (Table 3). A multiple comparison test that is universally applicable is still not available since factors such as the degrees of variance heterogeneity, extent of sample size imbalance and the shape of the population can influence the error rate (Keselman et al., Reference Keselman, Cribbie and Holland1999).
Comparison of the commonly used unplanned tests applied to the germination proportion of rape seeds, calculated from Table 4 of Piepho (Reference Piepho2003)

Wilcoxon represents Wilcoxon's rank values; Tukey is Tukey HSD; DMRT, Duncan's Multiple Range; LSD, least significant difference; SNK, Student–Newman–Keul's.
Means followed by the same letters in a column are not significantly different.
* Least square means: actual germination proportions and arcsine transformed germination proportions are presented for before transformation and after transformation, respectively.
† Bonferroni–Dunn and Sidak adjustments gave similar results. Therefore, results of the latter are not presented.
In most of the studies that conducted multiple comparisons, there is no indication that the multiplicity problem has been addressed. If several repeated pair-wise tests are made, then the conventional alpha value (0.05) is not acceptable due to the increased risk of Type I error (Bender and Lange, Reference Bender and Lange2001). It is well established that with repeated testing, one will inevitably find something statistically significant (false-positives) due to random variability, even if no real effects exist. This has been called the multiplicity problem in multiple comparison tests (Bender and Lange, Reference Bender and Lange2001; Feise, Reference Feise2002). Standard practice, which is entirely arbitrary, commonly establishes a cutoff point to distinguish statistical significance from non-significance at 0.05 (Feise, Reference Feise2002). A common practice for addressing the multiplicity problem has been that of adjusting the P values. The adjustment could be the very conservative (e.g. Bonferroni–Dunn, Sidak) or less conservative (e.g. Hochberg). Sidak's procedure is a refinement of the Bonferroni–Dunn procedure, but the latter is less conservative. Both Bonferroni and Sidak control the Type I experiment-wise error rate, but they generally have higher Type II error rate than Tukey–Kramer for all pair-wise comparisons. Generally, P value adjustments reduce the chance of making Type I errors, but they increase Type II error rates (Feise, Reference Feise2002). Recently, concerns have been expressed about possible misunderstanding and misuse of Bonferroni correction (García, Reference García2004). Some critics also contend that too many unwary researchers have adopted it in the name of scientific rigour even though it often does more harm than good (Waite and Campbell, Reference Waite and Campbell2006). A more sophisticated method for tackling multiplicity is the Tukey–Kramer adjustment, which considers the statistical distributions associated with systematic repeated testing. With balanced designs, the Tukey–Kramer is now the most acceptable method for all pair-wise comparisons because its adjusted P values are exact (Hsu, Reference Hsu1996).
A better alternative to post-hoc tests is provided by planned comparisons, which are driven by theory or past data. Planned tests require that the choice of the groups to be compared is part of the experimental design. Therefore, one focuses attention on a few theoretically sensible comparisons rather than every possible comparison. For example, planned comparison of treatments with a control group can be conducted. Dunnett's test is designed for this situation. It is possible to adjust P values to overcome the multiplicity problem in such tests. The advantage of planned comparisons is the increase in the statistical power because of the focus on a limited number of comparisons. This kind of comparison is sensible because it can be related to a clear hypothesis about the magnitude and direction of differences or the effect size. In Table 4 the example datasets were used to demonstrate estimation of effect sizes using Dunnett's method, and adjustment of P values using the Bonferroni–Dunn and Sidak procedures.
Pair-wise comparisons of treatment means with the control mean (CM) using simultaneous 95% confidence limits (CL) and P values adjusted for multiplicity using Dunnett's, Sidak's and Bonferroni–Dunn methods in ANOVA and NPART of germination proportion of rape seeds, calculated from Table 4 of Piepho (Reference Piepho2003)
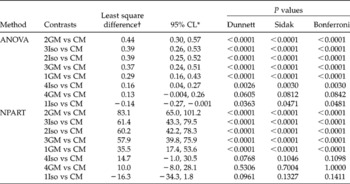
* For economy of space 95% confidence limits are presented only for Dunnett's test. The difference between the treatment and control is not significantly different if it is close to 0 (95% CL includes 0).
† This represents the least square differences between treatment means and the control mean. Negative sign ( − ) indicates a decrease in germination proportion relative to the control.
Lack of emphasis on effect size
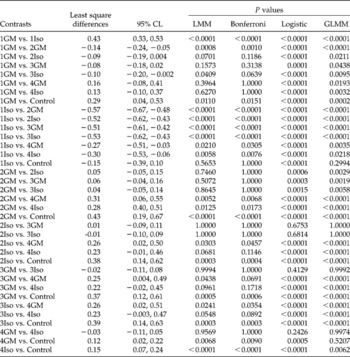
Most of the studies focused on hypothesis testing, and little effort was made to estimate the effect size. The way one interprets treatment results usually depends upon the effect size and sensitivity of the test. With very large sample sizes, it is possible to obtain statistically significant differences that are trivial in reality (Tryon and Lewis, Reference Tryon and Lewis2009). On the other hand, measures of effect size take into consideration both the size of the difference and the variability of sample values. As argued by Johnson (Reference Johnson1995) estimation of the differences between means, along with their confidence interval, is more meaningful than null hypothesis testing and comparing means. Using the example data, I demonstrate this approach in Tables 4 and 5. Information on the magnitude of differences can have an important bearing on decision-making. That is the reason why several authors have argued in favour of supplementing null hypothesis testing with confidence intervals (Tryon and Lewis, Reference Tryon and Lewis2009). Without such information even a well-conducted experiment will be a mere list of statistically significant differences that do not make biological sense. In future more emphasis should be placed on the magnitude of differences and their variability, rather than the mere detection of significance. Researchers also need to ask, for example, what is the acceptable increase due to the treatment over the control or another treatment? Investment in a particular treatment will be justified if only there is an acceptable increase over the control.
Pair-wise comparison of all means using simultaneous 95% confidence limits (CL) and P values from the linear mixed models (LMM), logistic and generalized linear mixed models (GLMM) of the germination proportion of rape seeds, calculated from Table 4 of Piepho (Reference Piepho2003). Least square differences and their Tukey–Kramer adjusted 95% CL were generated using LMM. P values were adjusted for multiplicity using Tukey–Kramer (in LMM and GLMM) and Bonferroni (in LMM) methods, and presented to aid comparison
Alternatives to ANOVA and NPARTs
Among the more powerful and flexible alternatives to ANOVA and NPARTs are LMMs, GLMs and GLMMs. LMMs extend the ANOVA model by allowing for both correlation and heterogeneous variances and inclusion of both fixed and random effects in the model. Thus LMMs are more appropriate for analysis of longitudinal and correlated data than ANOVA or NPARTs. They are also more appropriate than ANOVA for unbalanced design matrices that may result from losses of replicates during the course of an experiment. In addition to more robust estimates of the effect sizes, LMMs also now allow adjustment of P values using various methods. Table 5 presents P values corrected using the Tukey–Kramer and Bonferroni adjustment options. Although LMMs have several advantages over standard ANOVA, they are the least used in germination studies (Fig. 1b). It must be noted that LMMs assume normality of errors and random effects (Littell, Reference Littell2002). Therefore, they should be used where data satisfy these assumptions.
Generalized linear models (GLMs) unify various statistical models, including linear, logistic and Poisson regression. The term ‘generalized’ refers to non-normal distributions for the response variable, and GLMs have now superseded ANOVA for such datasets (Dobson, Reference Dobson2001; McCulloch and Searle, Reference McCulloch and Searle2001; Hardin and Hilbe, Reference Hardin and Hilbe2007). Binary logistic regression is a special case of GLMs that extends the linear model by assuming the data are binomial. Recently, Warton and Hui (Reference Warton and Hui2011) demonstrated that logistic regression provides a significant gain in power over ANOVA. Logistic regression calculates the probability of germination by assuming that each seed in the population is a statistically independent experimental unit. However, this does not mean that a single replication of treatments is adequate. Application of the treatment to replicate batches of seeds is necessary to estimate the average response given the background variability due to other sources in the population. Logistic regression is a large-sample method, and it can result in lower power for small sample sizes (n < 4 seeds per replicate). Logistic regression is also not appropriate when data are overdispersed because this can lead to underestimation of standard errors and overestimation of statistical significance (Warton and Hui, Reference Warton and Hui2011).
In the case of significant overdispersion, the more appropriate method is to add a normally distributed random intercept term to the model. The subsequent model is a mixed effects logistic regression, which is a special case of GLMMs (Bolker et al., Reference Bolker, Brooks, Clark, Geange, Poulsen, Stevens and White2009; Warton and Hui, Reference Warton and Hui2011). GLMMs allow modelling of responses with non-normal distribution or heterogeneous variance and inclusion of both fixed and random effects. This makes them appropriate for modelling hierarchical or correlated data in germination studies (Harrison et al., Reference Harrison, Regnier, Schmoll and Harrison2007). Recent simulation studies reveal that GLMMs have higher power than untransformed or arcsine transformed ANOVA as well as logistic regression (Warton and Hui, Reference Warton and Hui2011). However, GLMMs assume normally distributed random effects. Therefore, it is important to check that the random effects component of the model (e.g. block, Petri dish, etc.) has no evidence of a systematic trend (Warton and Hui, Reference Warton and Hui2011). Although GLMMs are very powerful, and now available in many software packages, they may be challenging to fit. Maximum likelihood estimation of LMMs for small samples is problematic and in certain situations produces inconsistent estimates (Piepho, Reference Piepho2003). For details of application of GLMMs, readers are encouraged to consult Bolker et al. (Reference Bolker, Brooks, Clark, Geange, Poulsen, Stevens and White2009).
Conclusions
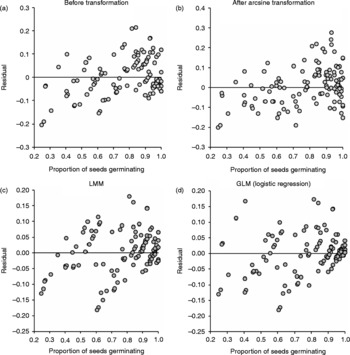
The main conclusion from the discussion above is that ANOVA and NPARTs and unplanned comparison tests are widely performed while test assumptions may be violated. Although unambiguous ways do not exist for assessing violations of more than one assumption in a dataset, checking the residuals using diagnostic plots (or formal tests with expert help) can reveal obvious departures. Plotting the residuals on the vertical axis and the independent variable on the horizontal axis can reveal clear trends indicating that the model being used is inappropriate. Figure 4 presents residual plots from ANOVA, LMM and GLM of the rape seed germination dataset. The GLM appears to perform better than the other models as the points are randomly dispersed around the horizontal line representing Y = 0 (Fig. 4d). A second conclusion is that NPARTs are being applied as if they are assumption-free. NPARTs are not always acceptable substitutes for the t- and F-tests when parametric assumptions are not satisfied. The validity of each test depends on fulfilment of test assumption, which also depends on a combination of factors including sample size, balance in design and the number of groups compared. If sample sizes are unequal, exact multiple comparison procedures may not be available. It must be noted that post-hoc tests also do not apply to every problem. Indeed, they are a very poor substitute for formulating a clear hypothesis to conduct planned comparisons. More flexible and modern methods such as LMMs, GLMs or GLMMs should be preferred over standard ANOVA and NPARTs. For binary data, I strongly recommend the use of GLMs and GLMMs, depending on availability of software and expertise. In any case, researchers should always make an effort to consult a statistician during both the design and analysis stages because the result is more likely to be satisfactory with expert help.
Residual plots from ANOVA (before and after transformation), linear mixed model (LMM) and logistic regression (generalized linear model, GLM) of the proportion of germinated seeds of oil-seed rape, calculated from Table 4 of Piepho (Reference Piepho2003).