1. Introduction
Magnetic field driven micro-convection was discovered in the early 1980s (Maiorov & Cebers Reference Maiorov and Cebers1983), extending the concept of self-magnetic field driven instabilities (Cebers & Maiorov Reference Cebers and Maiorov1980) for miscible fluids. Magnetic micro-convection is caused by the ponderomotive force of the non-homogeneous self-magnetic field of a magnetic fluid which, if the concentration gradient is not collinear to the magnetic field gradient, is non-potential and creates a flow. The phenomenon of magnetic micro-convection has attracted the attention of researchers from different points of view. Magnetic field driven micro-convection for various Hele-Shaw cell thicknesses was observed in Derec et al. (Reference Derec, Boltenhagen, Neveu and Bacri2008). The instability of a circular interface between miscible magnetic and non-magnetic fluids was studied in Chen & Wen (Reference Chen and Wen2002). The role of three-dimensional effects was studied in Wen, Chen & Kuan (Reference Wen, Chen and Kuan2007). Convective motion in the concentration gratings induced by non-homogeneous illumination under the action of a magnetic field was studied in Mezulis & Blums (Reference Mezulis and Blums2005) and Zablotsky (Reference Zablotsky2012). The theoretical models are based on the equation of motion of the magnetic liquid, the diffusion equation for magnetic particles and the Maxwell equations for a magnetostatic field (Cebers Reference Cebers1997). On this basis different characteristics of magnetic micro-convection were found by linear stability analysis (Igonin & Cebers Reference Igonin and Cebers2003). It is interesting to note that more complex models were applied for the description of magnetic micro-convection, including the Korteweg stress (Chen Reference Chen2003), which has long been of interest in the physics of miscible fluids (Truzzolillo et al. Reference Truzzolillo, Mora, Dupas and Cipelletti2014). It should be remarked that fingering phenomena in miscible fluids (Bischofberger, Ramachandran & Nagel Reference Bischofberger, Ramachandran and Nagel2014) are still of general scientific interest.
The magnetic micro-convection studied here has already been explored in Erglis et al. (Reference Erglis, Tatulcenkov, Kitenbergs, Petrichenko, Ergin, Watz and Cebers2013). In particular, velocity fields were experimentally determined using particle image velocimetry. The results obtained were interpreted according to a theoretical model of the flow based on a simple Darcy approximation, which was unable to describe all the features of micro-convection observed experimentally. For example, the formation of mushrooms on the plumes of the micro-convective flow, the width of the fingers, and the enhanced particle diffusion of ionic water-based ferrofluids, were not explained. Further, in the experimental system of Erglis et al. (Reference Erglis, Tatulcenkov, Kitenbergs, Petrichenko, Ergin, Watz and Cebers2013), poor control of interface formation affected the smearing of the diffusion front, which is an important parameter defined below in § 2.2.
Here we substantially improve the experimental set-up for the measurement of the velocities of fingers in micro-convection, where particular attention is paid to the formation of the interface between miscible fluids. Moreover, a much more complete model for magnetic micro-convection, based on the Brinkman equation for the fluid flow instead of the Darcy model, is employed. The main characteristics of micro-convection, such as the characteristic size of the primary fingers or their velocity dynamics, are calculated and compared with experiment. We show that the Brinkman model gives much better quantitative and qualitative agreement with the experimental data than the previous Darcy model.
We organize the paper as follows. In § 2 we formulate the Brinkman model for magnetic micro-convection. Dimensionless quantities are introduced and it is shown that the magnetic micro-convection is determined by the magnetic Rayleigh number. Linear stability analysis is carried out and the wavenumber of the fastest growing mode is calculated as a function of the magnetic Rayleigh number. These results are compared with those of the Darcy model. The numerical algorithm and the numerical results obtained are described in § 3; in particular (unlike the Darcy model), the Brinkman model predicts the formation of mushrooms on the developing fingers. For a further comparison, the primary finger velocity and the Fourier spectrum dynamics are analysed in the framework of both models. In § 4 the experimental set-up is introduced, together with the experimental observations, including determination of the critical field and the subsequent image analysis. It allows us to retrieve comparable data on the Fourier coefficient dynamics of the primary fingers and velocities. Comparison between experiment and simulation, together with extensive discussion, is carried out in § 5.
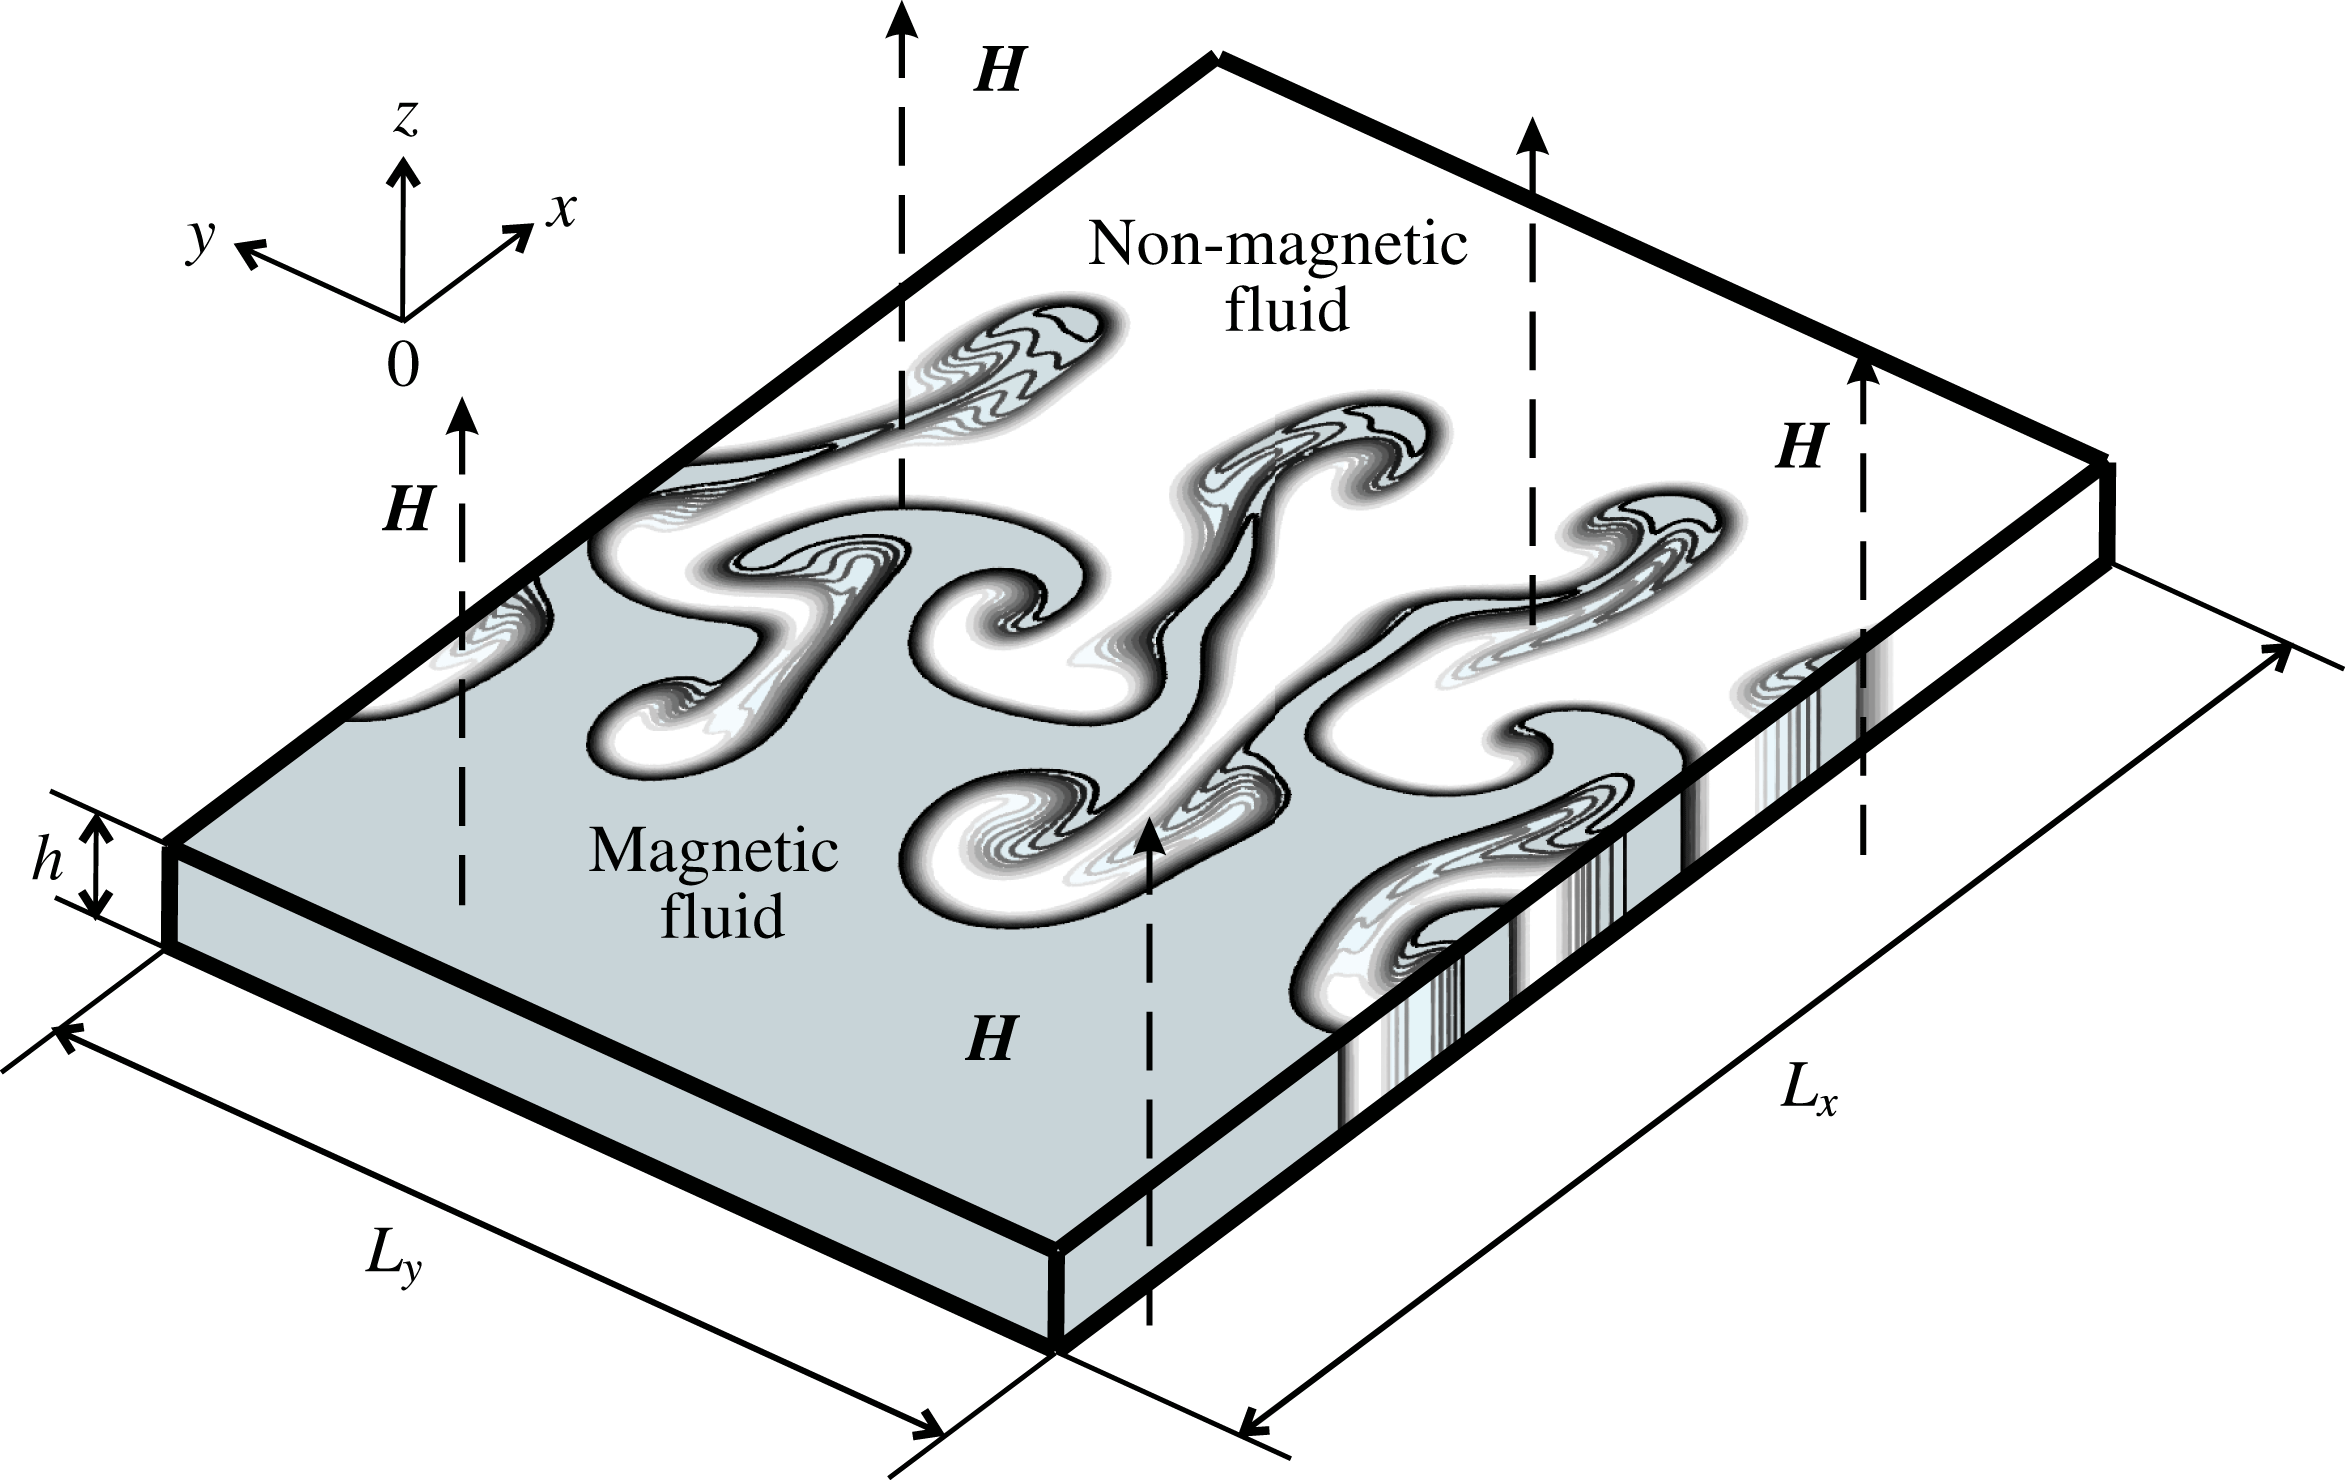
Sketch of the Hele-Shaw cell. The interface is formed between a magnetic fluid (a colloidal solution of magnetic nanoparticles) and a carrier fluid.

2. Mathematical formulation
2.1. The model
We consider two miscible fluids where the first is a magnetic fluid and the second is a simple non-magnetic fluid. Fluids are confined in a horizontal Hele-Shaw cell and a magnetic field is applied perpendicular to the cell; a sketch of the cell is shown in figure 1. The viscosities of the fluids are equal. The ponderomotive forces of the non-homogeneous self-magnetic field near the fluid interface cause a fingering instability. Its growth is described by a set of equations, which includes the Brinkman equation, where the ponderomotive magnetic force is taken into account, the continuity equation, and the convection–diffusion equation (Cebers Reference Cebers1997; Igonin & Cebers Reference Igonin and Cebers2003), and reads as follows:
 $$\begin{eqnarray}-\boldsymbol{{\rm\nabla}}p-\frac{12{\it\eta}}{h^{2}}\boldsymbol{u}-\frac{2M(c)}{h}\boldsymbol{{\rm\nabla}}{\it\psi}_{m}+{\it\eta}{\rm\Delta}\boldsymbol{u}=0,\quad \boldsymbol{{\rm\nabla}}\boldsymbol{\cdot }\boldsymbol{u}=0,\end{eqnarray}$$
 $$\begin{eqnarray}\displaystyle \frac{\partial c}{\partial t}+(\boldsymbol{u}\boldsymbol{\cdot }\boldsymbol{{\rm\nabla}})c=D{\rm\Delta}c,\end{eqnarray}$$
where
 ${\it\Delta}=\partial ^{2}/\partial x^{2}+\partial ^{2}/\partial y^{2}$
,
 $\boldsymbol{{\rm\nabla}}=(\partial /\partial x,\partial /\partial y)$
. Note that a viscous term
 ${\it\eta}{\rm\Delta}\boldsymbol{u}$
is added, with respect to the Darcy model in the equation of motion. It describes the horizontal diffusion of vorticity, absent from the Darcy model, which takes into account only the friction with walls
 $-12{\it\eta}\boldsymbol{u}/h^{2}$
, and allows us to obtain more coarse fingers in agreement with experiment. Here
 $p$
is the pressure,
 $\boldsymbol{u}=(u_{x}(x,y),u_{y}(x,y))$
is the depth-averaged velocity,
 ${\it\eta}$
is the viscosity of the fluid,
 $h$
is the thickness of the Hele-Shaw cell,
 $D$
is the constant isotropic diffusion coefficient, and
 $c$
is the concentration of the magnetic fluid normalized by its value far from the interface. The magnetization
 $M(c)$
is taken to be proportional to the concentration of the magnetic fluid
 $c$
(
 $M=M_{0}c$
) and the value of the magnetostatic potential
 ${\it\psi}_{m}$
on the boundary of the Hele-Shaw cell is given by (Cebers Reference Cebers1981; Jackson, Goldstein & Cebers Reference Jackson, Goldstein and Cebers1994)
 $$\begin{eqnarray}{\it\psi}_{m}(\boldsymbol{r},t)=M_{0}\int c(\boldsymbol{r}^{\prime },t)K(\boldsymbol{r}-\boldsymbol{r}^{\prime },h)\,\text{d}S^{\prime },\end{eqnarray}$$
where the integration is performed over the boundary of the Hele-Shaw cell:
 $K(\boldsymbol{r},h)=1/\mid \boldsymbol{r}\mid -1/\sqrt{\mid \boldsymbol{ r}\mid ^{2}+h^{2}}$
.
Equations (2.1) and (2.2) extend the model that is usually applied for the study of the displacements of miscible, nonmagnetic fluids in the Hele-Shaw cell (Goyal & Meiburg Reference Goyal and Meiburg2006), via the Brinkman approximation.
The boundary conditions for the velocity components and the concentration of the fluid are
 $$\begin{eqnarray}u_{x}(0,y)=u_{y}(0,y)=0,\quad c(0,y)=1,\end{eqnarray}$$
 $$\begin{eqnarray}u_{x}(L_{x},y)=u_{y}(L_{x},y)=0,\quad c(L_{x},y)=0,\end{eqnarray}$$
and the conditions of periodicity across the Hele-Shaw cell are
 $$\begin{eqnarray}\boldsymbol{u}(x,0,t)=\boldsymbol{u}(x,L_{y},t),\quad c(x,0,t)=c(x,L_{y},t).\end{eqnarray}$$
The boundary conditions (2.4) require that the fluid is motionless at both ends of the cell. The motion of the liquid arises from a non-potential magnetic force
 $-2M(c)\boldsymbol{{\rm\nabla}}{\it\psi}_{m}/h$
.
The equations are put into dimensionless form by introducing the following scales: length
 $h$
, time
 $h^{2}/D$
, velocity
 $D/h$
, pressure
 $12{\it\eta}D/h^{2}$
, magnetostatic potential
 $M_{0}h$
. The set of dimensionless equations therefore reads
 $$\begin{eqnarray}-\boldsymbol{{\rm\nabla}}p-\boldsymbol{u}-2\mathit{Ra}_{m}c\boldsymbol{{\rm\nabla}}{\it\psi}_{m}+\frac{{\rm\Delta}\boldsymbol{u}}{12}=0,\quad \boldsymbol{{\rm\nabla}}\boldsymbol{\cdot }\boldsymbol{u}=0,\end{eqnarray}$$
 $$\begin{eqnarray}\frac{\partial c}{\partial t}+(\boldsymbol{u}\boldsymbol{\cdot }\boldsymbol{{\rm\nabla}})c={\rm\Delta}c.\end{eqnarray}$$
Here
 $\mathit{Ra}_{m}=M_{0}^{2}h^{2}/12{\it\eta}D$
is the magnetic Rayleigh number determined by the ratio of the characteristic time of diffusion
 ${\it\tau}_{D}=h^{2}/D$
and the characteristic time
 ${\it\tau}_{M}=12{\it\eta}/M_{0}^{2}$
of the motion due to a non-homogeneous self-magnetic field of the fluid.
2.2. The linear stability analysis
The development of small perturbations of the interface depends on the smearing of the diffusion front between the miscible liquids (Cebers Reference Cebers1997; Igonin & Cebers Reference Igonin and Cebers2003). In the case when the smearing occurs due to the diffusion of the particles their concentration distribution is described by
 $c_{0}=0.5(1-\text{erf}(x/2\sqrt{t_{0}}))$
, where
 $t_{0}$
is the smearing time. An analytical solution may be found in the limit
 $t_{0}=0$
, when the concentration distribution is step-like. Development of small perturbations is considered in the quasi-stationary approximation. It is valid when the characteristic time of the perturbation evolution is smaller than the characteristic time of the evolution of the concentration field.
Growth increments
 ${\it\lambda}$
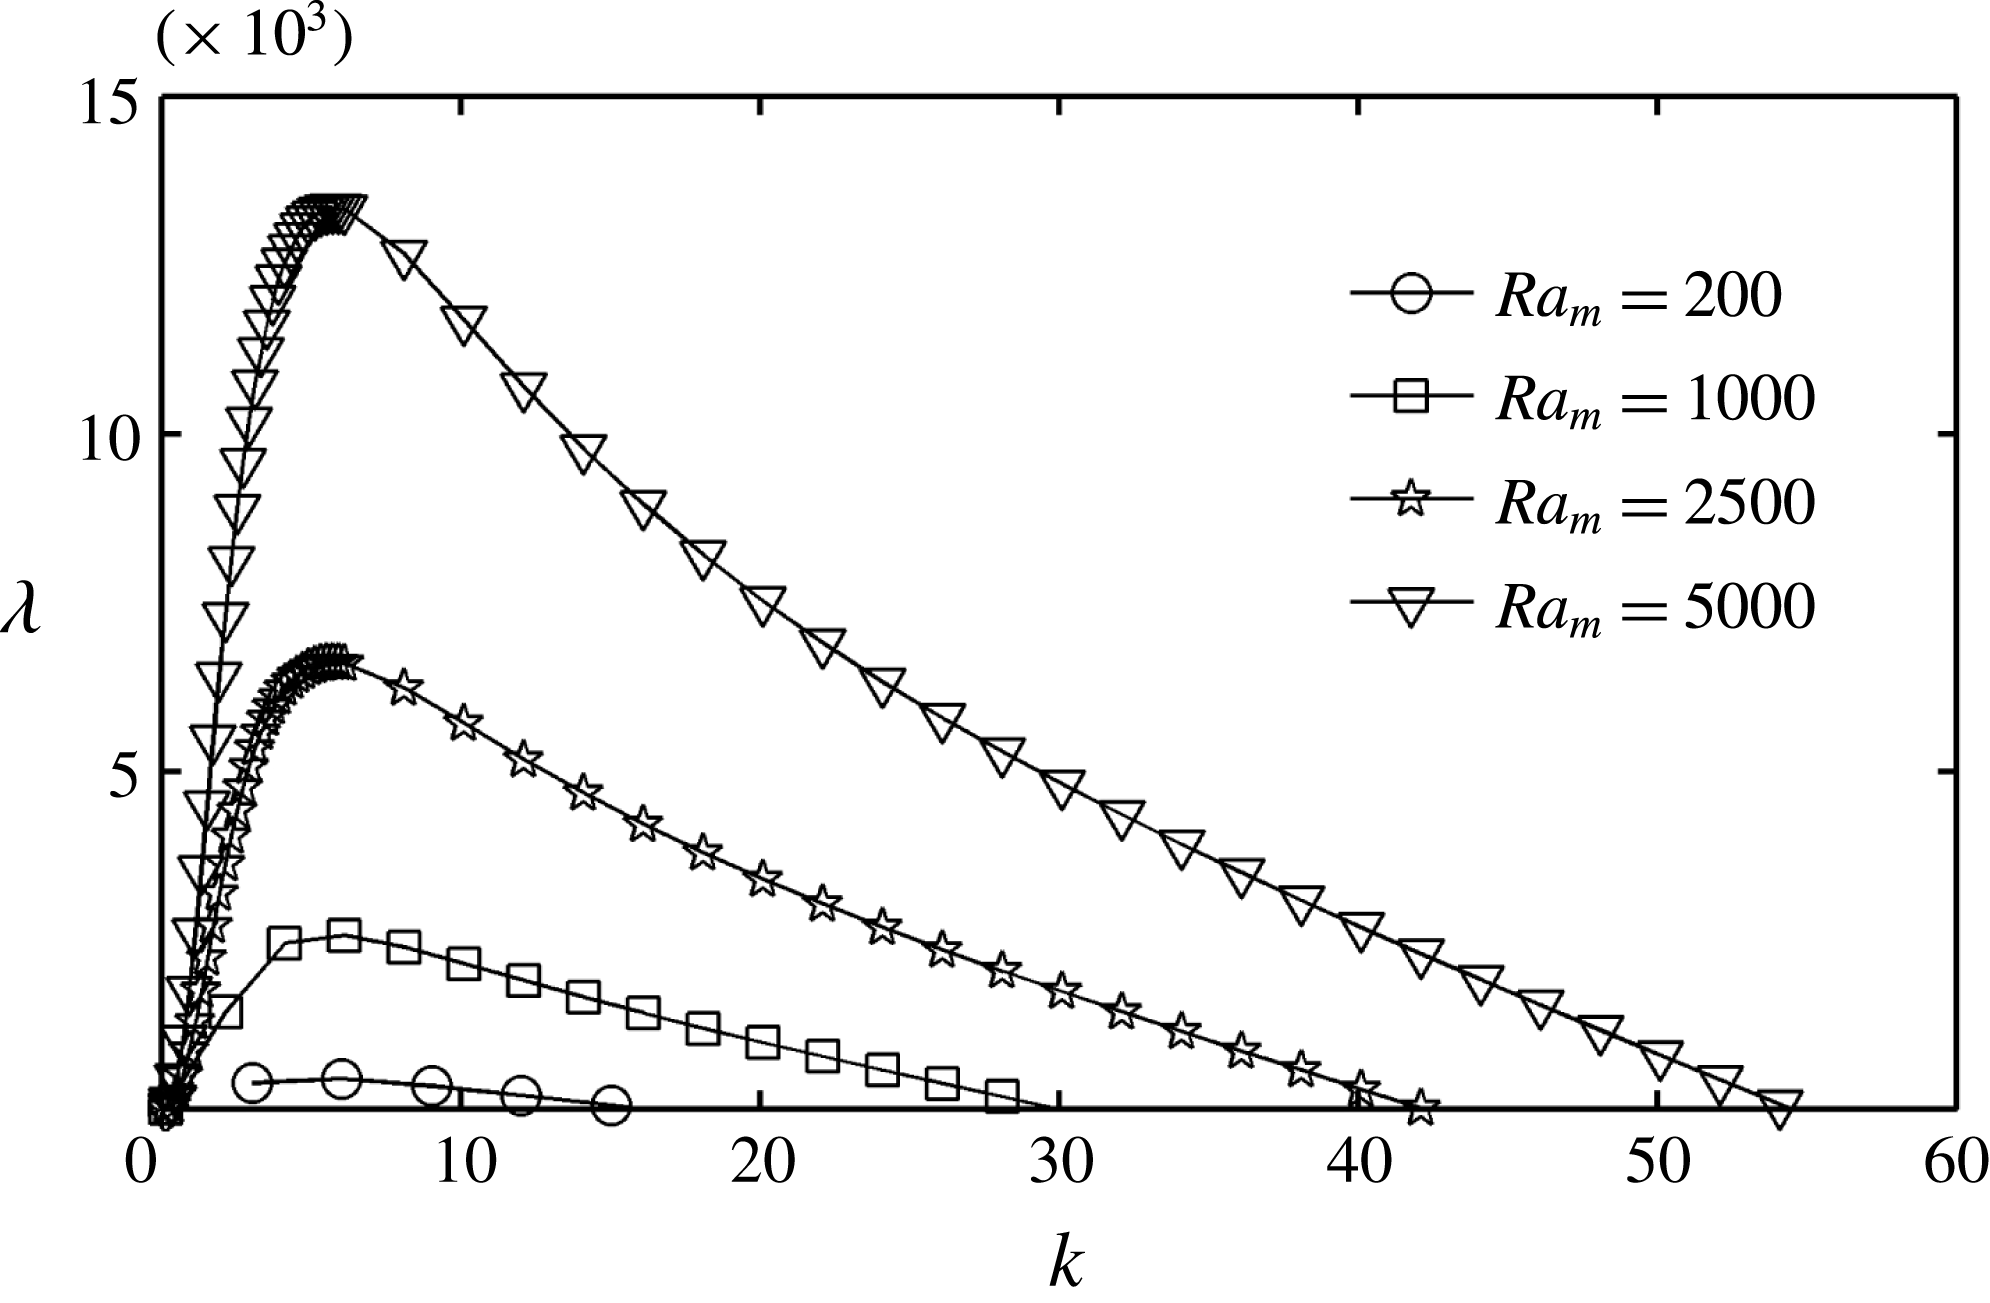
as a function of the wavenumber for different values of the magnetic Rayleigh number,
 $\mathit{Ra}_{m}=200$
, 1000, 2500, 5000.

The linear perturbation of a quiescent base state is represented by
 $\{u_{x},u_{y},c,{\it\psi}_{m}\}$
 $(x,y,t)=\{0,0,c_{0},{\it\psi}_{m0}\}(x)+\{u_{x}^{\prime },u_{y}^{\prime },c^{\prime },{\it\psi}_{m}^{\prime }\}(x)\text{e}^{\text{i}ky+{\it\lambda}t}$
, where
 $k$
is the wavenumber and
 ${\it\lambda}$
is the growth increment of perturbation. In the motionless state the ponderomotive force due to the self-magnetic field is balanced by the pressure gradient
 $$\begin{eqnarray}-\frac{\partial p_{0}}{\partial x}-2\mathit{Ra}_{m}c_{0}\frac{\partial {\it\psi}_{m0}}{\partial x}=0,\end{eqnarray}$$
where
 $$\begin{eqnarray}{\it\psi}_{m0}=\int _{-\infty }^{+\infty }c_{0}(x-{\it\xi},t_{0})\ln (1+{\it\xi}^{-2})\,\text{d}{\it\xi}.\end{eqnarray}$$
Equations (2.7) and (2.8) for small perturbations of the velocity
 $u_{x}^{\prime }$
and the concentration
 $c^{\prime }$
gives
 $$\begin{eqnarray}\displaystyle & \displaystyle \left(\frac{\text{d}^{2}}{\text{d}x^{2}}-k^{2}\right)^{2}u_{x}^{\prime }-12\left(\frac{\text{d}^{2}}{\text{d}x^{2}}-k^{2}\right)u_{x}^{\prime }-24k^{2}\mathit{Ra}_{m}\left(\frac{\text{d}c_{0}}{\text{d}x}{\it\psi}_{m}^{\prime }-c^{\prime }\frac{\text{d}{\it\psi}_{m0}}{\text{d}x}\right)=0, & \displaystyle\end{eqnarray}$$
 $$\begin{eqnarray}\displaystyle & \displaystyle ({\it\lambda}+k^{2})c^{\prime }+u_{x}^{\prime }\frac{\text{d}c_{0}}{\text{d}x}-\frac{\text{d}^{2}c^{\prime }}{\text{d}x^{2}}=0, & \displaystyle\end{eqnarray}$$
 $$\begin{eqnarray}{\it\psi}_{m}^{\prime }=2\int _{-\infty }^{+\infty }c^{\prime }(x-{\it\xi})\left(K_{0}(k|{\it\xi}|)-K_{0}\left(k\sqrt{{\it\xi}^{2}+1}\right)\right)\,\text{d}{\it\xi}\end{eqnarray}$$
and
 $K_{0}$
is the modified Bessel function of the second kind (a Macdonald function). Equations (2.11) and (2.12) and boundary conditions
 $c^{\prime }(\pm \infty ,y)=u_{x}^{\prime }(\pm \infty ,y)=0$
yield the eigenvalue problem for the growth rate of the perturbations
 ${\it\lambda}$
. Its solution in the limit
 $t_{0}\rightarrow 0$
is straightforward and is given in appendix A. The growth increments in this limit are calculated according to (A 27) given in appendix A.
The growth increment as a function of the wavenumber
 $k$
for different values of the magnetic Rayleigh number,
 $\mathit{Ra}_{m}=200$
, 1000, 2500 and 5000 at
 $t_{0}=0$
, is shown in figure 2. We see that the maximal growth increment for all tested values of the magnetic Rayleigh number in figure 2 corresponds to the wavenumber approximately equal to
 $k\simeq 5$
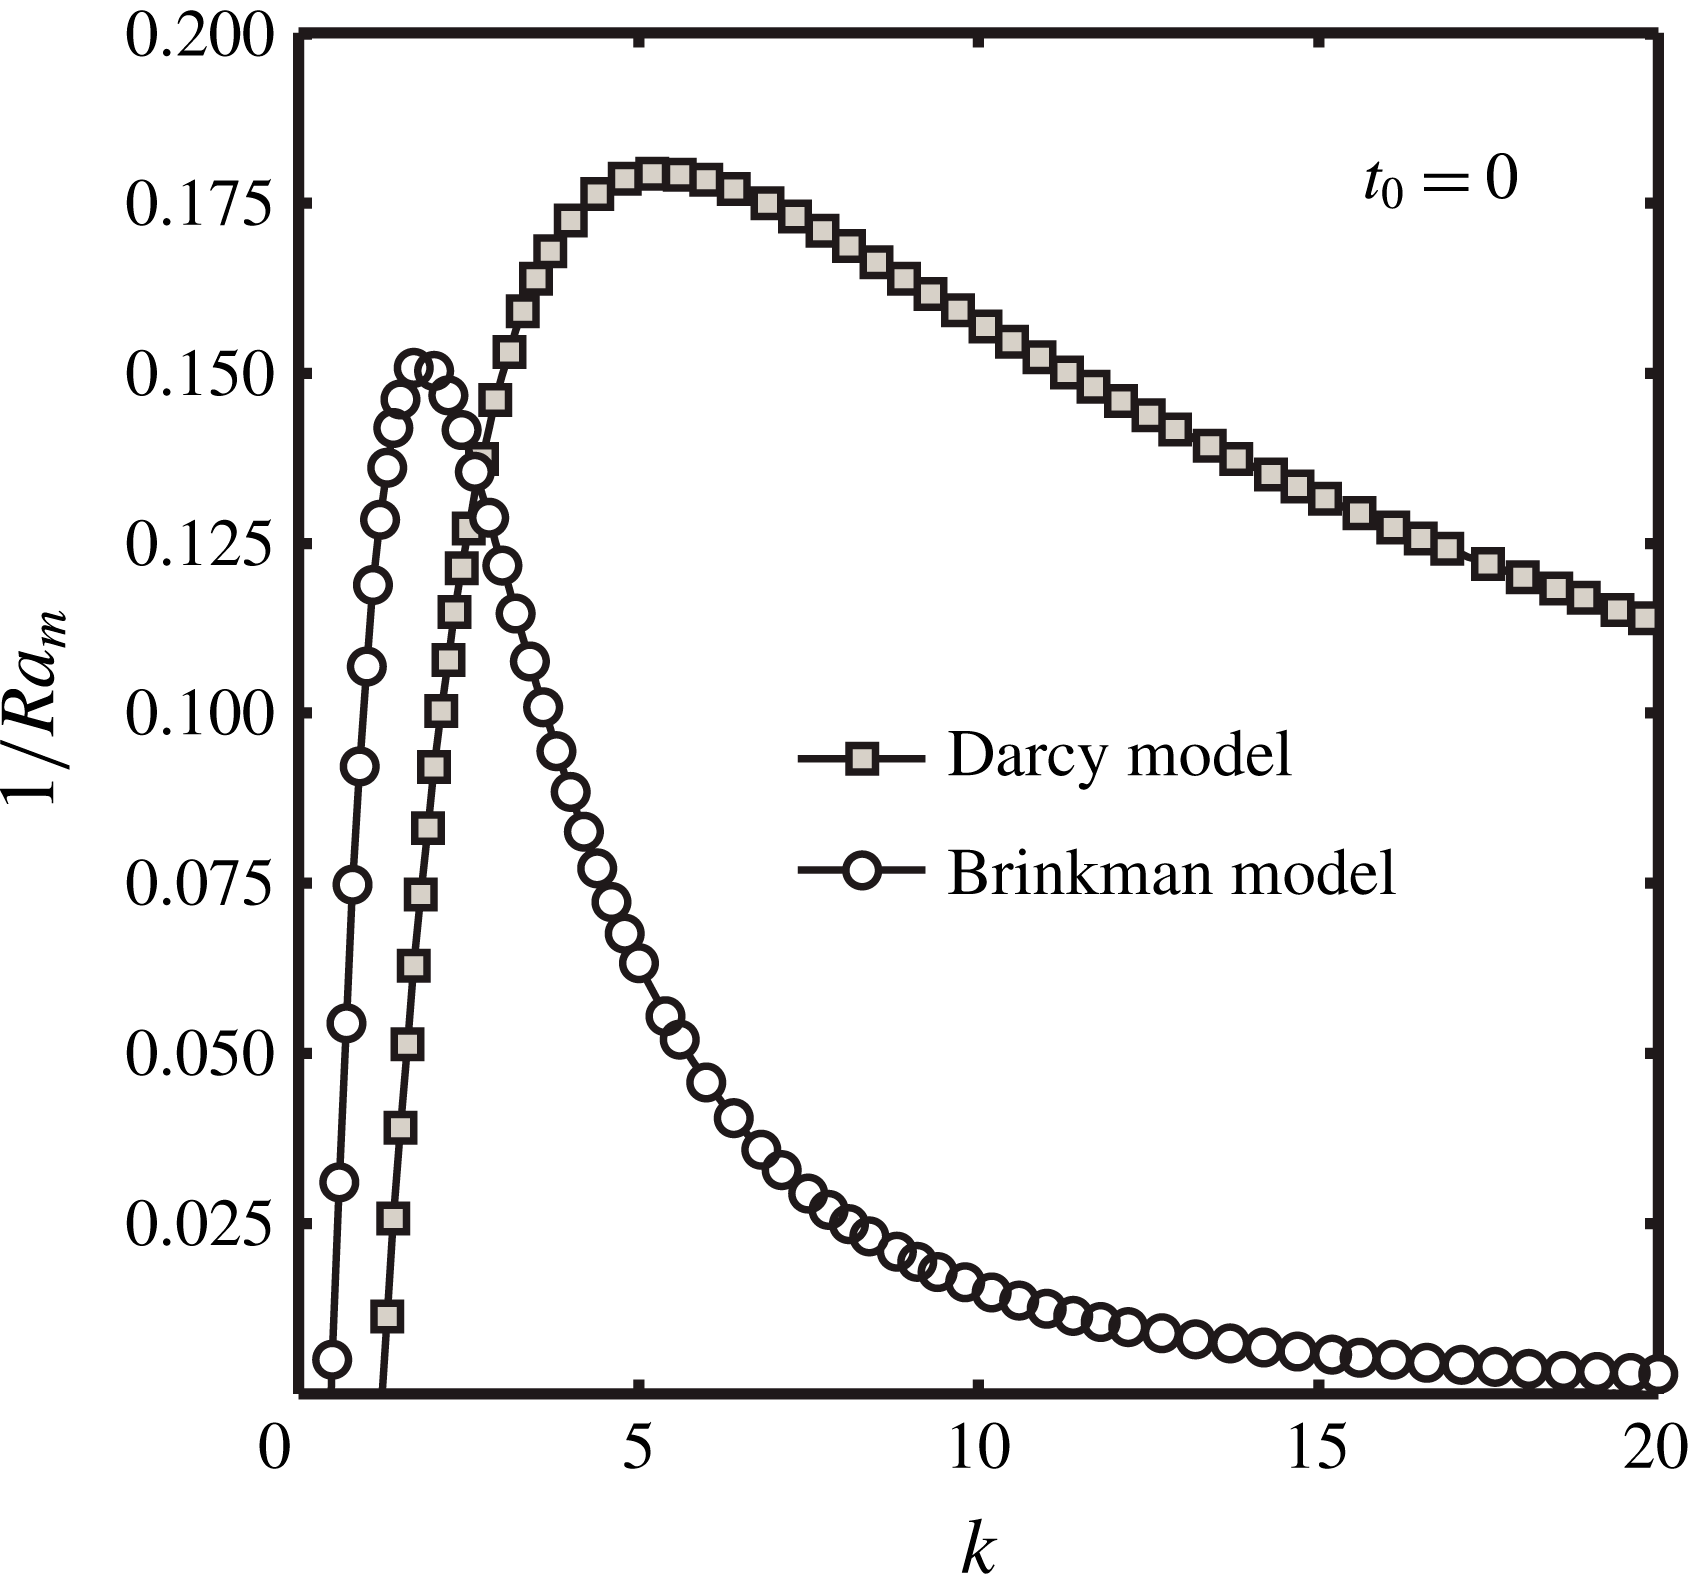
. For comparison, figure 3 shows the neutral curves of the magnetic micro-convection for the Brinkman model and the Darcy model at
 $t_{0}=0$
. With the Brinkman model the onset of the instability corresponds to a critical value of the magnetic Rayleigh number
 $\mathit{Ra}_{m}^{cr}=6.6$
associated with a critical wavenumber
 $k^{cr}=1.8$
. These numbers can be compared with the Darcy model (Erglis et al.
Reference Erglis, Tatulcenkov, Kitenbergs, Petrichenko, Ergin, Watz and Cebers2013):
 $\mathit{Ra}_{m}^{cr}=5.7$
and
 $k^{cr}=5.2$
at
 $t_{0}=0$
. We thus see that while increasing the magnetic Rayleigh number the fingers develop with very different widths in the framework of the two models at the same value of
 $t_{0}$
. The finger width predicted by the Darcy model (Erglis et al.
Reference Erglis, Tatulcenkov, Kitenbergs, Petrichenko, Ergin, Watz and Cebers2013) produces fingers of significantly smaller width (larger
 $k^{cr}$
) than the Brinkman model (smaller
 $k^{cr}$
), the latter model producing fingers with a width close to the experimental observations (see below).
Neutral curves (
 ${\it\lambda}=0$
) of magnetic micro-convection at
 $t_{0}=0$
for the Brinkman model (circles) and Darcy model (squares) as obtained by linear stability analysis.

3. Numerical simulation
3.1. Numerical algorithm
The evolution of magnetic micro-convection is studied numerically in the non-linear stage. Equations (2.7a,b ) and (2.8) are solved by the spectral method in the vorticity–stream function formulation (Tan & Homsy Reference Tan and Homsy1988; Zimmerman & Homsy Reference Zimmerman and Homsy1992). In order to apply the spectral method, the concentration and magnetostatic potential are presented as
 $$\begin{eqnarray}c(x,y,t)=c_{0}(x,t)+c^{\prime }(x,y,t),\end{eqnarray}$$
and
 $$\begin{eqnarray}{\it\psi}_{m}(x,y,t)={\it\psi}_{m0}(x,t)+{\it\psi}_{m}^{\prime }(x,y,t),\end{eqnarray}$$
where
 $$\begin{eqnarray}\displaystyle & \displaystyle {\it\psi}_{m0}(x,t)=\int _{-\infty }^{+\infty }c_{0}(x-{\it\xi},t)\ln (1+{\it\xi}^{-2})\,\text{d}{\it\xi}, & \displaystyle\end{eqnarray}$$
 $$\begin{eqnarray}\displaystyle & \displaystyle {\it\psi}_{m}^{\prime }(\boldsymbol{r})=\int _{S}c^{\prime }(\boldsymbol{r}^{\prime },t)K(\boldsymbol{r}-\boldsymbol{r}^{\prime },1)\,\text{d}S^{\prime }. & \displaystyle\end{eqnarray}$$
The numerical algorithm is checked by the calculation of neutral curves of the magnetic micro-convection for several values of the characteristic smearing time
 $t_{0}$
. To this end, the concentration perturbation is introduced by a small displacement
 ${\it\varsigma}(x,y)$
of isoline
 $c=0.5$
at
 $x_{0}=0$
,
 $$\begin{eqnarray}c(x,y,t=0)=\frac{1}{2}\left(1-\text{erf}\left(\frac{x-x_{0}}{\sqrt{4t_{0}}}\right)\right)+{\it\varsigma}(x,y),\end{eqnarray}$$
where
 $$\begin{eqnarray}{\it\varsigma}(x,y)=\mathop{\sum }_{n=1}^{N}{\it\varepsilon}_{a}\text{e}^{-k_{n}\sqrt{1+{\it\lambda}_{n}/(k_{n}^{2})}|x-x_{0}|}\cos (k_{n}y),\quad k_{n}=2{\rm\pi}n/L_{y},\quad {\it\varepsilon}_{a}=10^{-3},\end{eqnarray}$$
and
 ${\it\lambda}_{n}$
is given by the dispersion relation (A 27) of appendix A for a fixed value of the magnetic Rayleigh number
 $\mathit{Ra}_{m}$
. The concentration perturbation corresponds to the eigenfunction calculated in appendix A (relations (A 9), (A 10) for the zero smearing time). In order to calculate the neutral curves numerically, the Fourier coefficients
 ${\hat{c}}_{mn}$
in (B 4a
) of appendix B are calculated by two-dimensional fast Fourier transform of the concentration field and the growth increments
 ${\it\lambda}$
are found as a function of the wavenumber
 $k$
by matching the time dependence with
 ${\hat{c}}_{0n}(t)={\hat{c}}_{0n}(0)\text{e}^{{\it\lambda}t}$
. The neutral curves for definite values of the smearing parameter
 $t_{0}$
are found by solving the equation
 ${\it\lambda}_{}(\mathit{Ra}_{m}^{c},k)=0$
by spline interpolation.
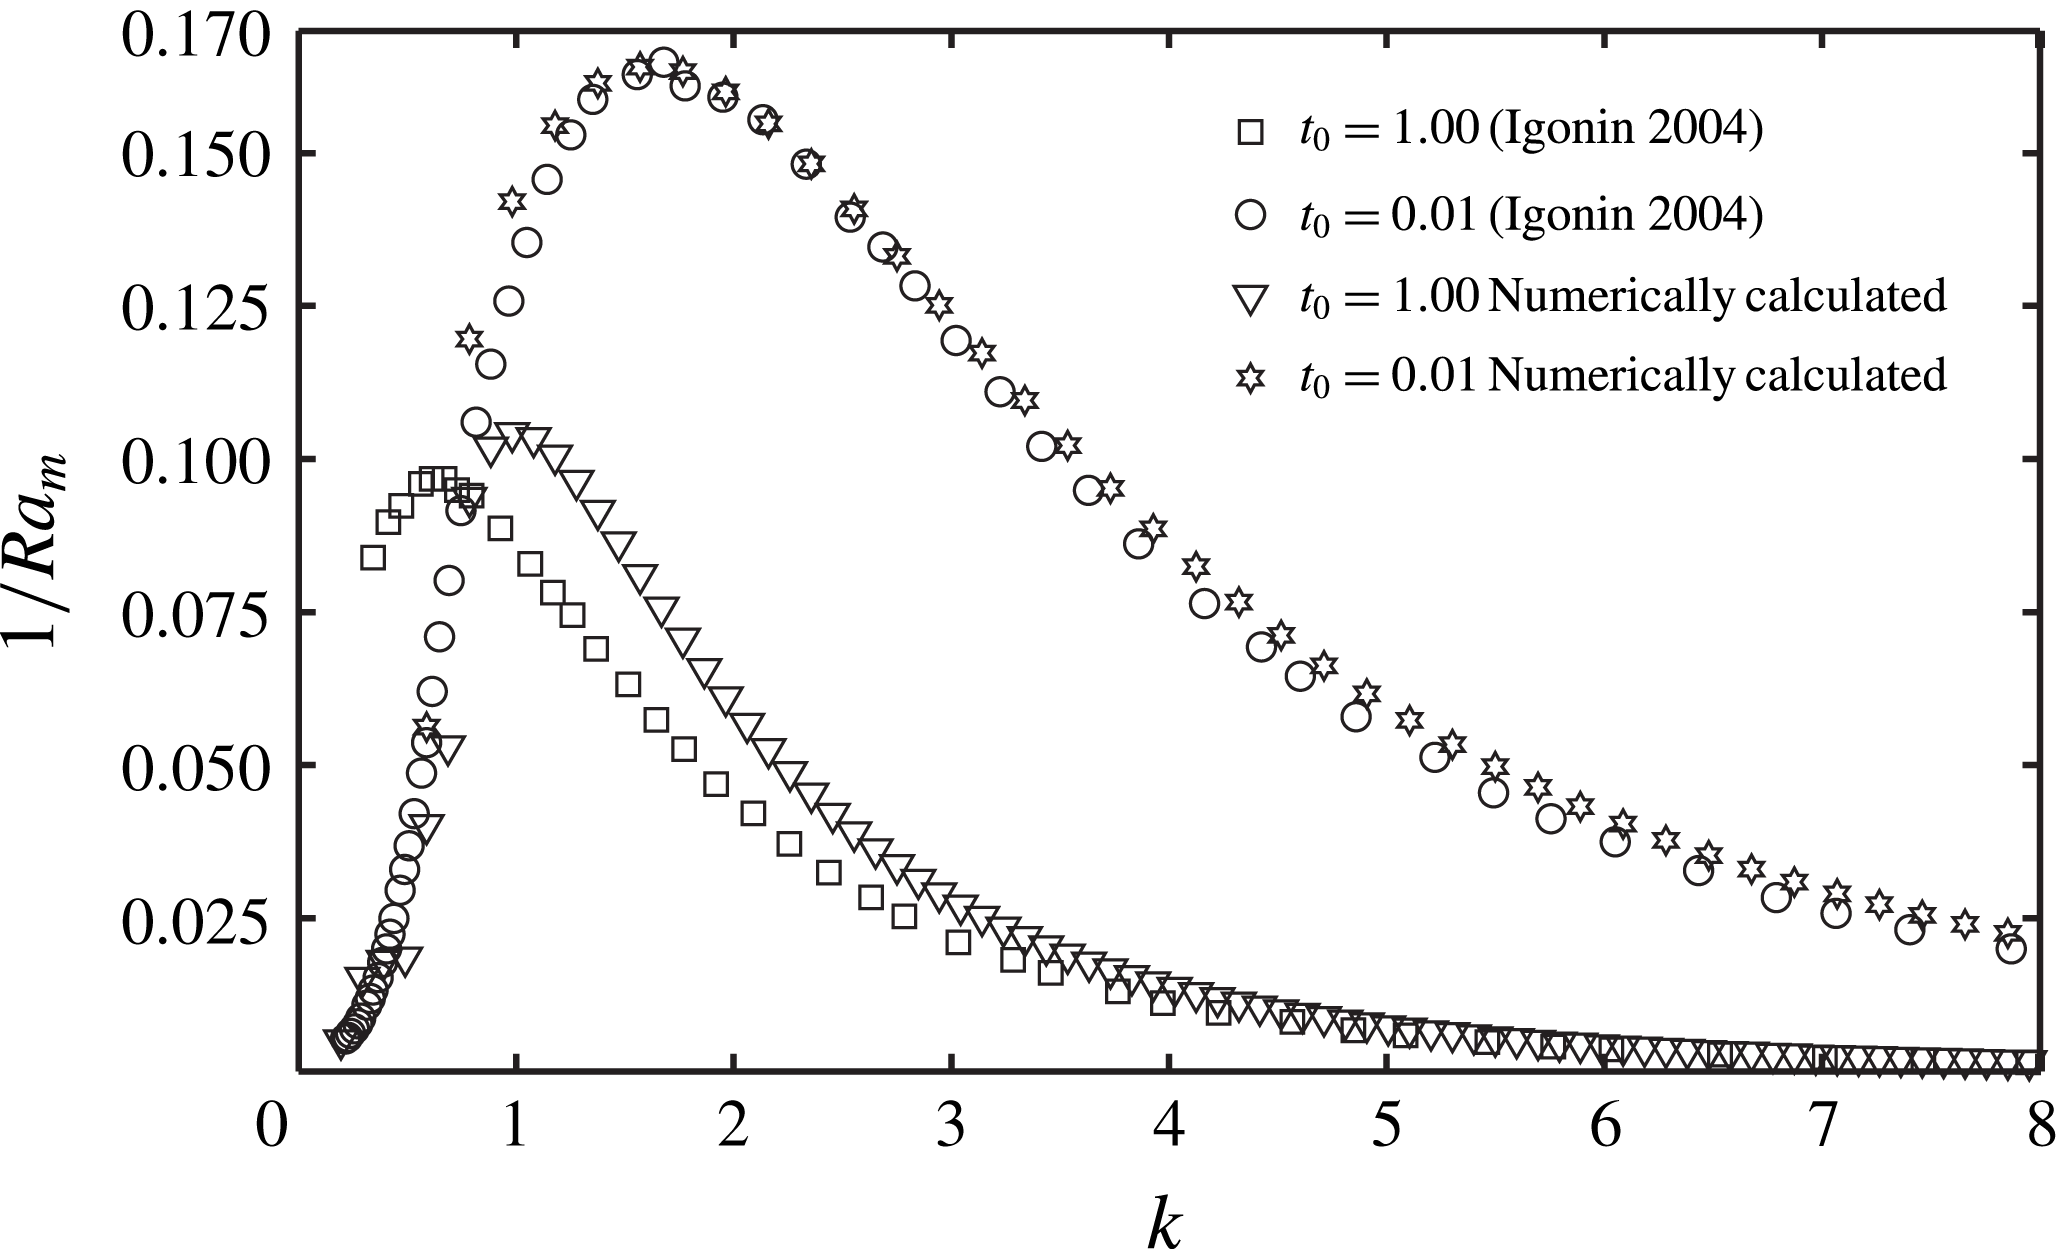
Figure 4 shows the numerically calculated neutral curves for two values of the smearing time
 $t_{0}=0.01$
and
 $t_{0}=1$
, together with those obtained in Igonin (Reference Igonin2004) by numerical solution of the eigenvalue problem ((2.11) and (2.12)) at the same
 $t_{0}$
value. From figure 4 we may conclude that the present numerical algorithm gives neutral curves in good agreement with the numerical calculations of (Igonin Reference Igonin2004) despite the small deviation at
 $t_{0}=1$
, since eigenfunctions for sharp and smeared fronts for
 $t_{0}=1$
are different.
Neutral curves (
 ${\it\lambda}=0$
) of the magnetic micro-convection for different values of the smearing parameters (
 $t_{0}=0.01$
and
 $t_{0}=1$
). Triangles and stars show the present numerical results, while circles and squares are Igonin’s numerical solution of the eigenvalue problem (Igonin Reference Igonin2004).

3.2. Numerical results
The initial concentration perturbation at the interface is introduced by applying the relation (3.4) with
 ${\it\varsigma}(y)$
taken to be random. In numerical calculations over long times, typically
 $1024\times 512$
collocation points are used for the space discretization. The time step is typically
 ${\rm\Delta}t=10^{-5}$
for
 $\mathit{Ra}_{m}<2000$
and
 ${\rm\Delta}t=10^{-6}$
for
 $\mathit{Ra}_{m}>2000$
.
Fingering patterns for three values of magnetic Rayleigh numbers
 $\mathit{Ra}_{m}=500$
, 1500, 5000 with a smearing parameter
 $t_{0}=0.025$
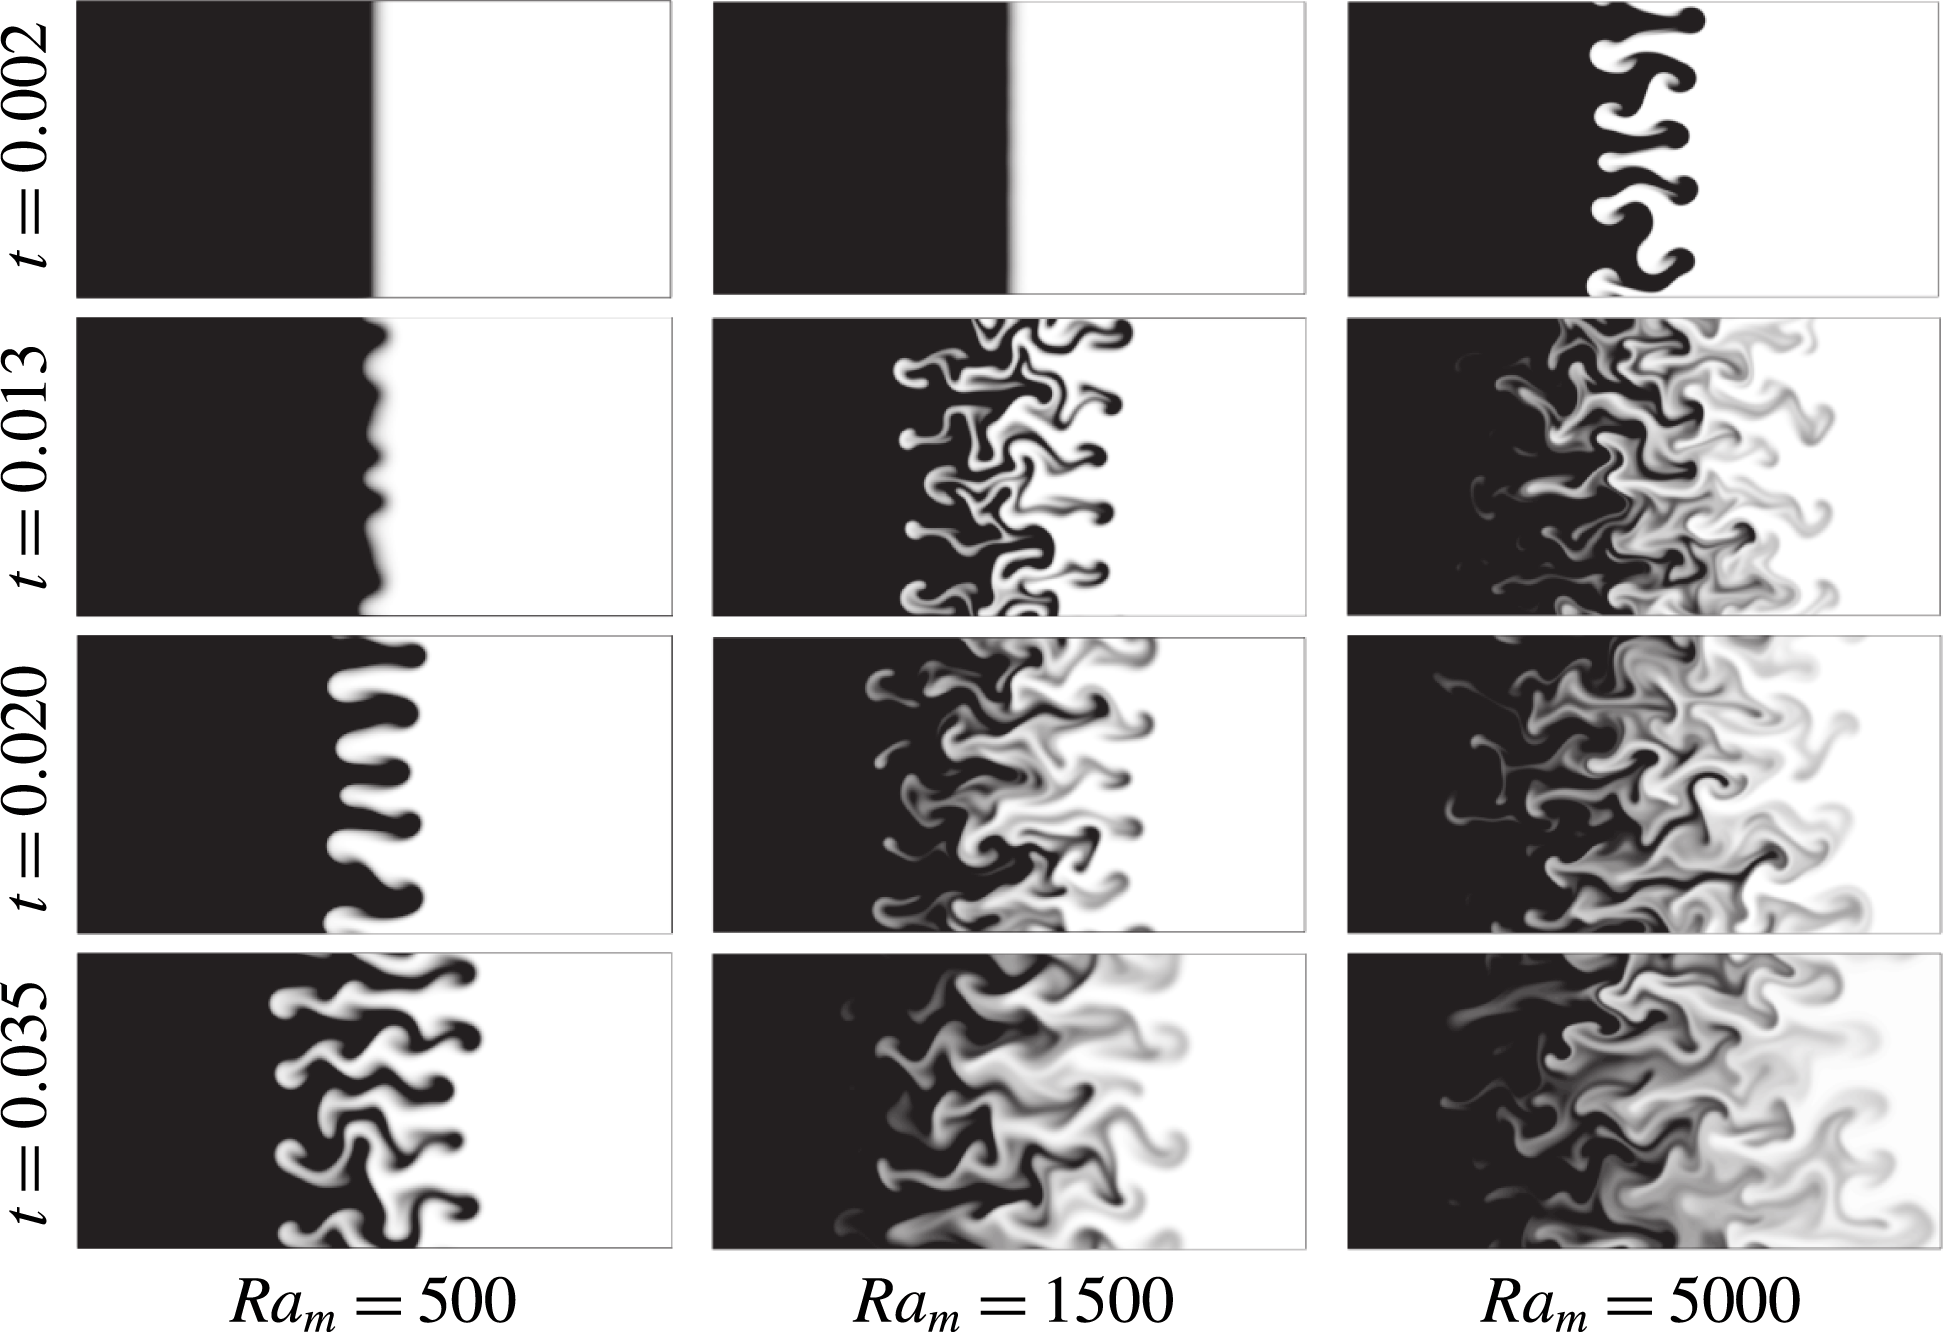
are shown in figure 5. Initially, depending on the magnetic field intensity, well-resolved fingers are formed for
 $\mathit{Ra}_{m}=500$
at
 $t=0.02$
and for
 $\mathit{Ra}_{m}=5000$
at
 $t=0.002$
. Fingers expand due to the magnetic interaction between particles forming a stable boundary between the magnetic and non-magnetic phases. Simultaneously the bending instability of fingers develops at
 $\mathit{Ra}_{m}=500$
(
 $t=0.035$
),
 $\mathit{Ra}_{m}=1500$
(
 $t=0.013$
) and
 $\mathit{Ra}_{m}=5000$
(
 $t=0.002$
). Finally the finger pattern smears out due to diffusion of magnetic particles, and in a strong magnetic field,
 $\mathit{Ra}_{m}=1500$
(
 $t=0.02$
,
 $t=0.035$
) and
 $\mathit{Ra}_{m}=5000$
(
 $t=0.013$
,
 $t=0.02$
,
 $t=0.035$
), the formation of new well-resolved larger fingers is observed. Fingering pattern dynamics, limited to the primary fingers, for
 $\mathit{Ra}_{m}=318$
and
 $t_{0}=0.005$
can be seen in movie 1 in the supplementary material available at http://dx.doi.org/10.1017/jfm.2015.255.
Concentration images for the magnetic Rayleigh number
 $\mathit{Ra}_{m}=500$
,
 $\mathit{Ra}_{m}=1500$
,
 $\mathit{Ra}_{m}=5000$
at time
 $t=0.002$
,
 $t=0.013$
,
 $t=0.02$
,
 $t=0.035$
with
 $L_{x}=16,L_{y}=8$
and
 $t_{0}=0.025$
.

The peculiarities of magnetic micro-convection in the non-linear stage are characterized via its Fourier spectrum dynamics. It is obtained from concentration plots with an ‘in-house’ data-processing algorithm, described in § 2 of the supplementary material. The characteristic size of the fingers is verified with a peak finding algorithm, described in § 3 of the supplementary material. The analysis is limited to the development of the primary fingers. To ease the comparison, the numerical simulation data are analysed in the same way as the experimental data in § 4.1.
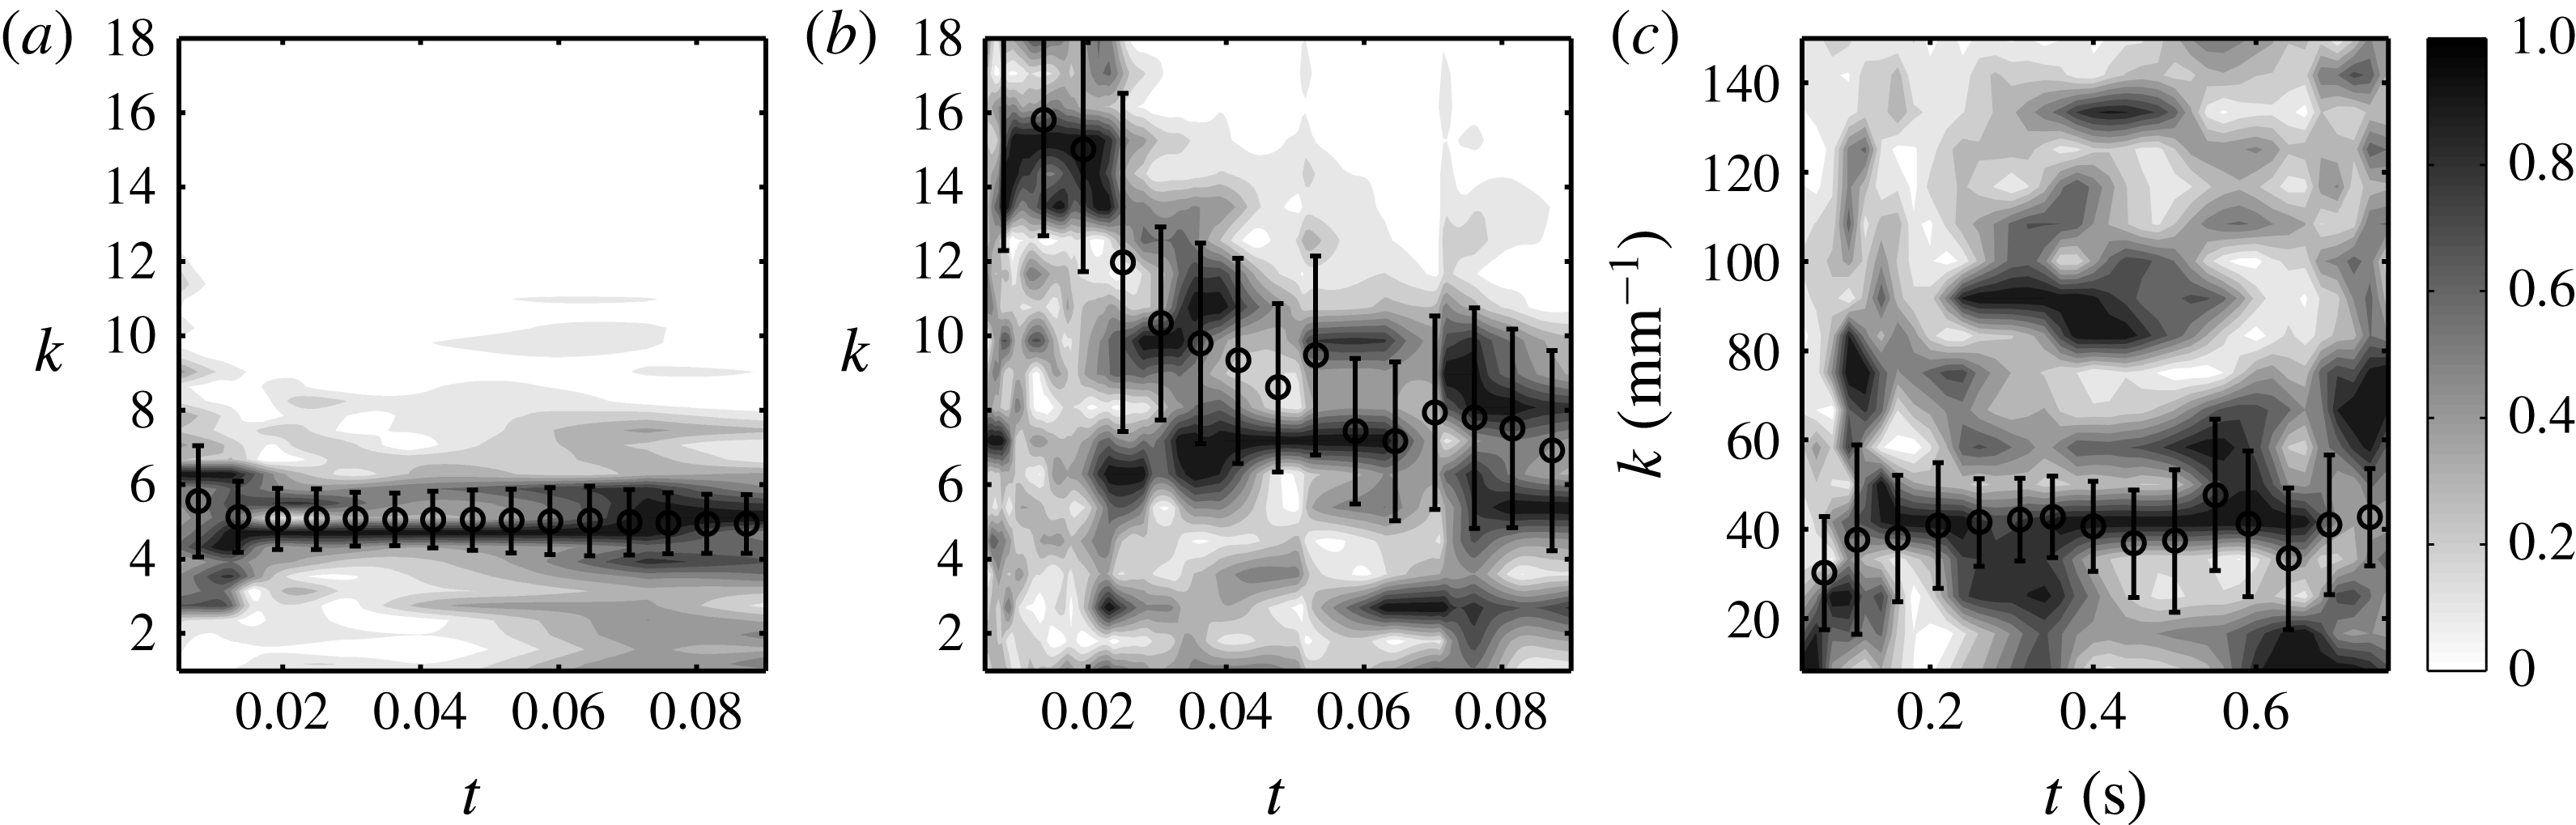
Figures 6(a) and 6(b) show the Fourier spectrum dynamics of the magnetic micro-convection for the Brinkman and Darcy models, respectively, at
 $\mathit{Ra}_{m}=318$
and
 $t_{0}=0.005$
, along with the experimental data (figure 6
c), which will be discussed in § 4.1.1. We see that the spectrum of the wavenumbers in the pattern stays around a constant value
 $\simeq 5$
at all times in the case of the Brinkman model. In comparison, the concentration pattern dynamics, as obtained in the framework of the Darcy model, has a much smaller scale at the beginning and shows different behaviour. Only around
 $t=0.1$
does it approach
 $k\simeq 5$
.
Analysis of the fingering pattern dynamics. The graphs show colour-coded greyscale contour plots of the Fourier coefficient dynamics. The average wavenumbers found by the peak finding algorithm are marked as circles with error bars. Results are shown for numerical simulation data at
 $\mathit{Ra}_{m}=318$
and
 $t_{0}=0.005$
of (a) the Brinkman model, (b) the Darcy model and (c) the experimental data at
 $H=138~\text{Oe}$
. The sizes of graphs are equal with respect to dimensionless quantities.

A special algorithm is developed in order to calculate the velocity of fingers as a function of the magnetic Rayleigh number. A regular concentration perturbation by (3.4) with
 ${\it\varsigma}(y)=0.25\cos (ky)$
and the characteristic value of the wavenumber
 $k=4.19$
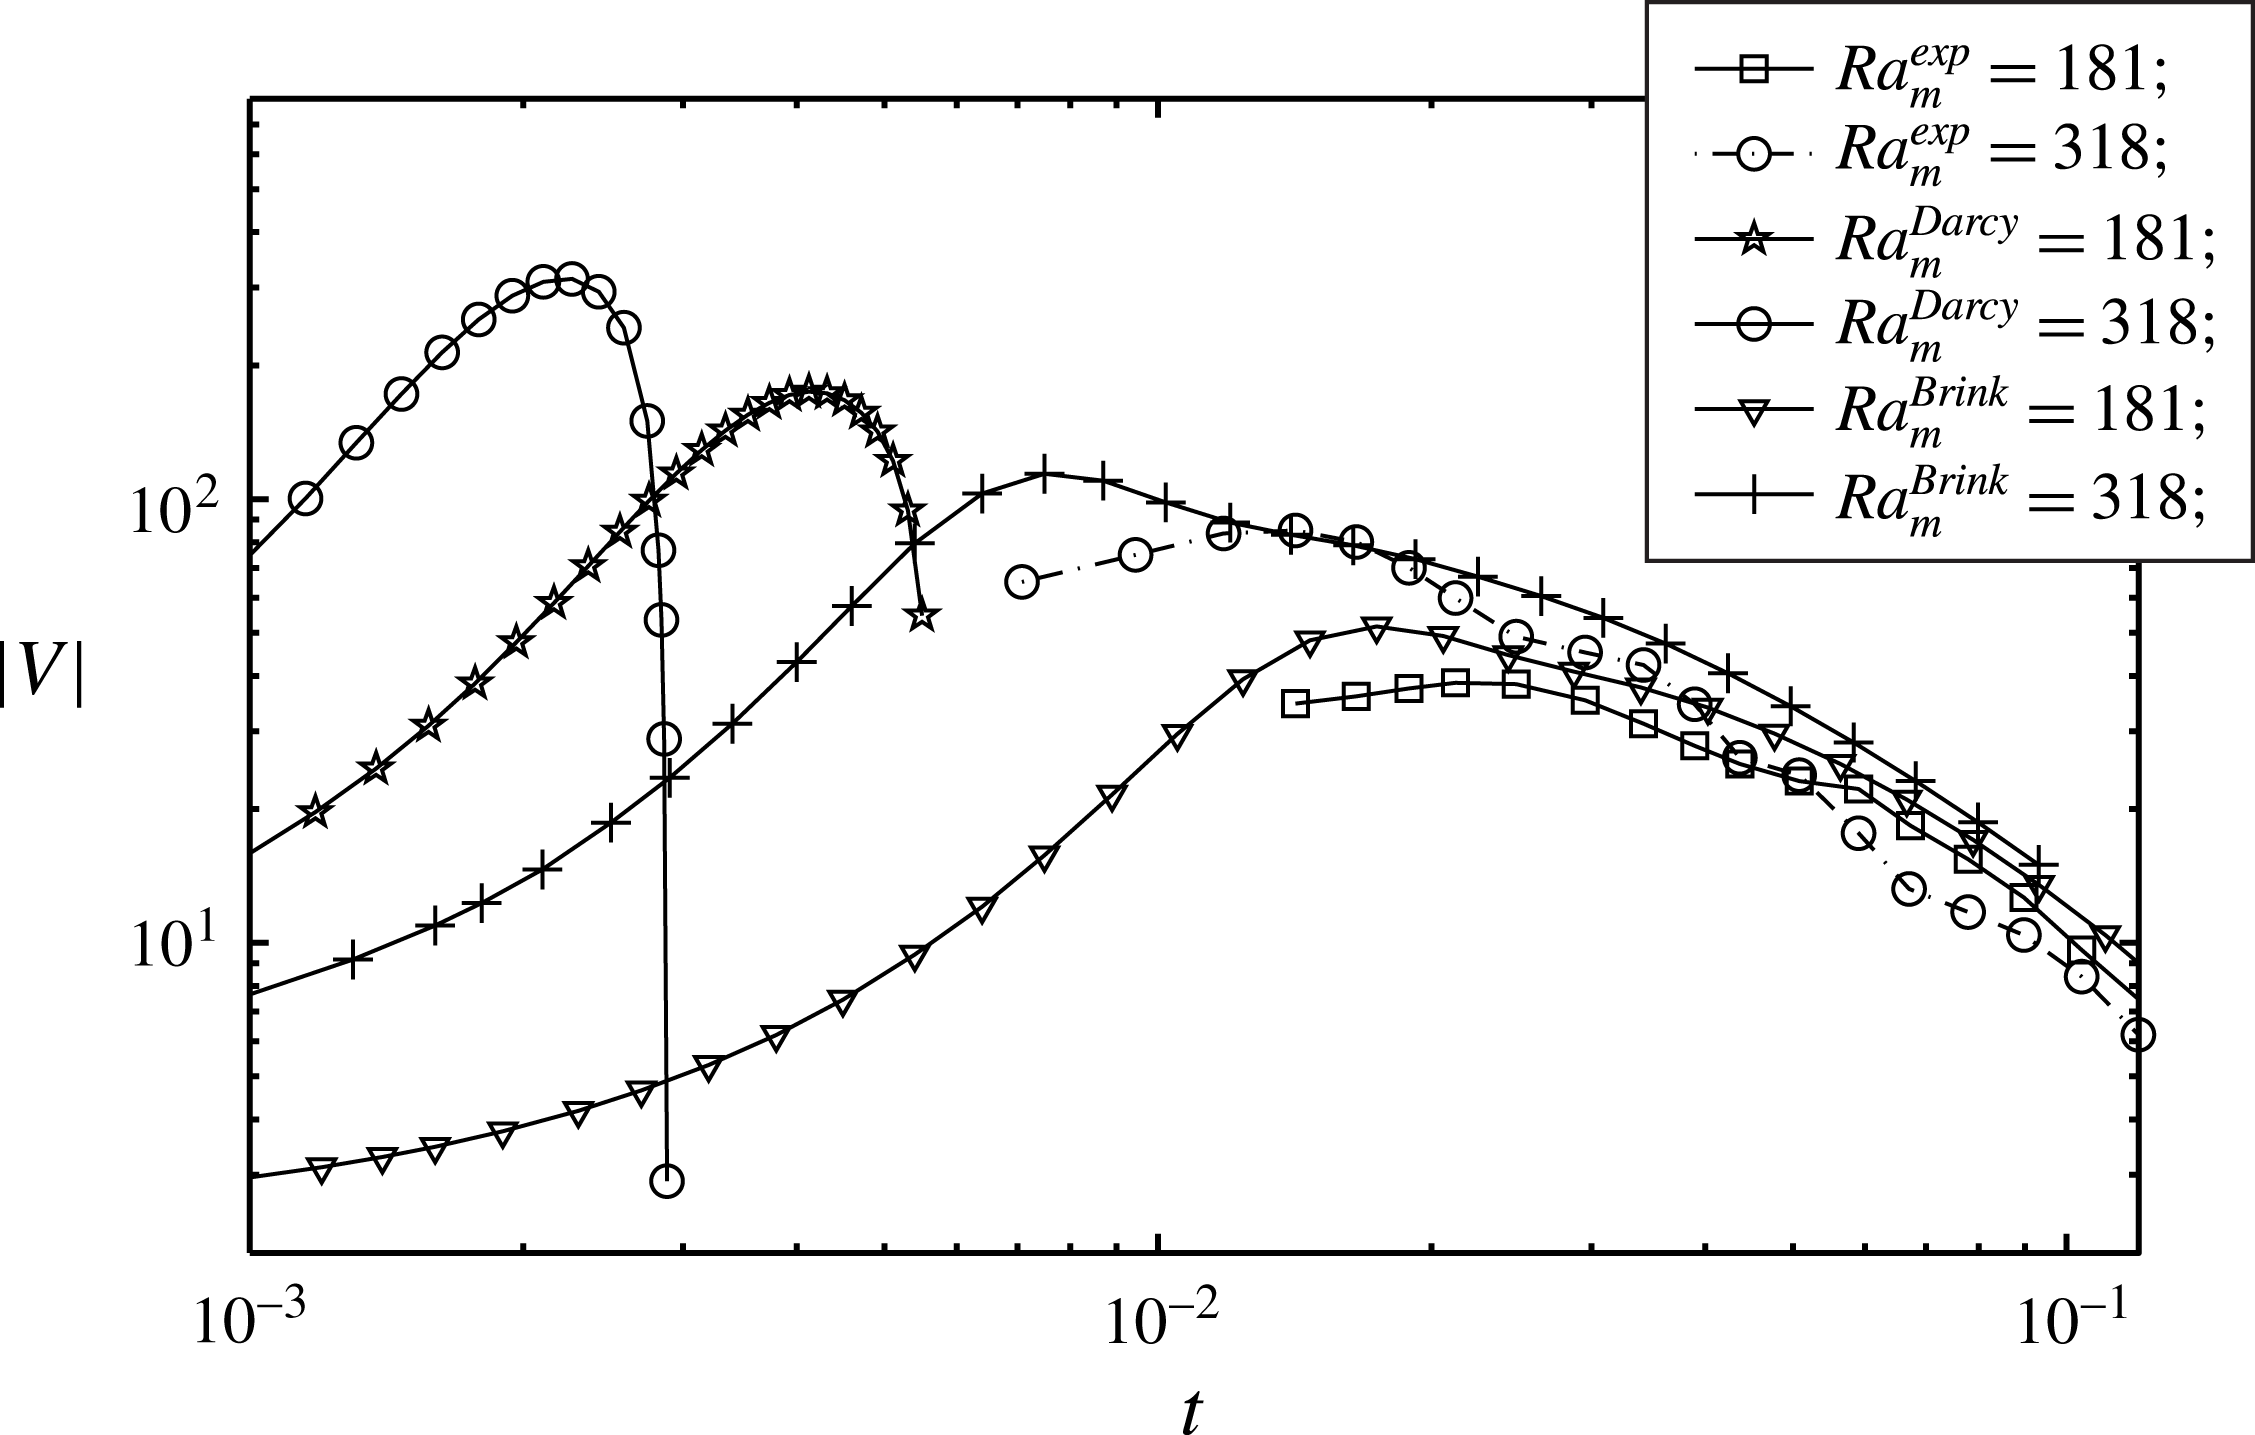
is used and its evolution with time is calculated. The finger velocity is found from the largest concentration gradient displacement over time. Figure 7 shows the velocity of the fingers as a function of time, calculated in the framework of both the Brinkman model and the Darcy model for two values of
 $\mathit{Ra}_{m}$
(181 and 318), chosen for an easy comparison with the experiments considered below. It presents growth with subsequent decay due to the smearing out of the concentration pattern. Both the growth and the following decay are faster in Darcy’s framework. The emergence and decay of instability observed in numerical and physical experiments is similar to the development of normal field instability at the interface between the miscible magnetic and non-magnetic fluids (Chen, Tsai & Miranda Reference Chen, Tsai and Miranda2008). A peak initially formed on the interface after reaching its maximal amplitude further disappears due to the diffusion of magnetic particles. The maximum in Chen et al. (Reference Chen, Tsai and Miranda2008) was also obtained for the normalized mixing length in the case of confined liquids, which after reaching a maximum, decays due to the diffusion of magnetic nanoparticles.
Finger velocity
 $|V|$
as a function of time for two values of the magnetic Rayleigh number
 $\mathit{Ra}_{m}$
. Data according to the Brinkman model: triangles,
 $\mathit{Ra}_{m}=181$
; crosses,
 $\mathit{Ra}_{m}=318$
. Data according to the Darcy model: stars,
 $\mathit{Ra}_{m}=181$
; open circles,
 $\mathit{Ra}_{m}=318$
. Experimental data: squares,
 $\mathit{Ra}_{m}=181$
; open circles on a dot-dashed line,
 $\mathit{Ra}_{m}=318$
.

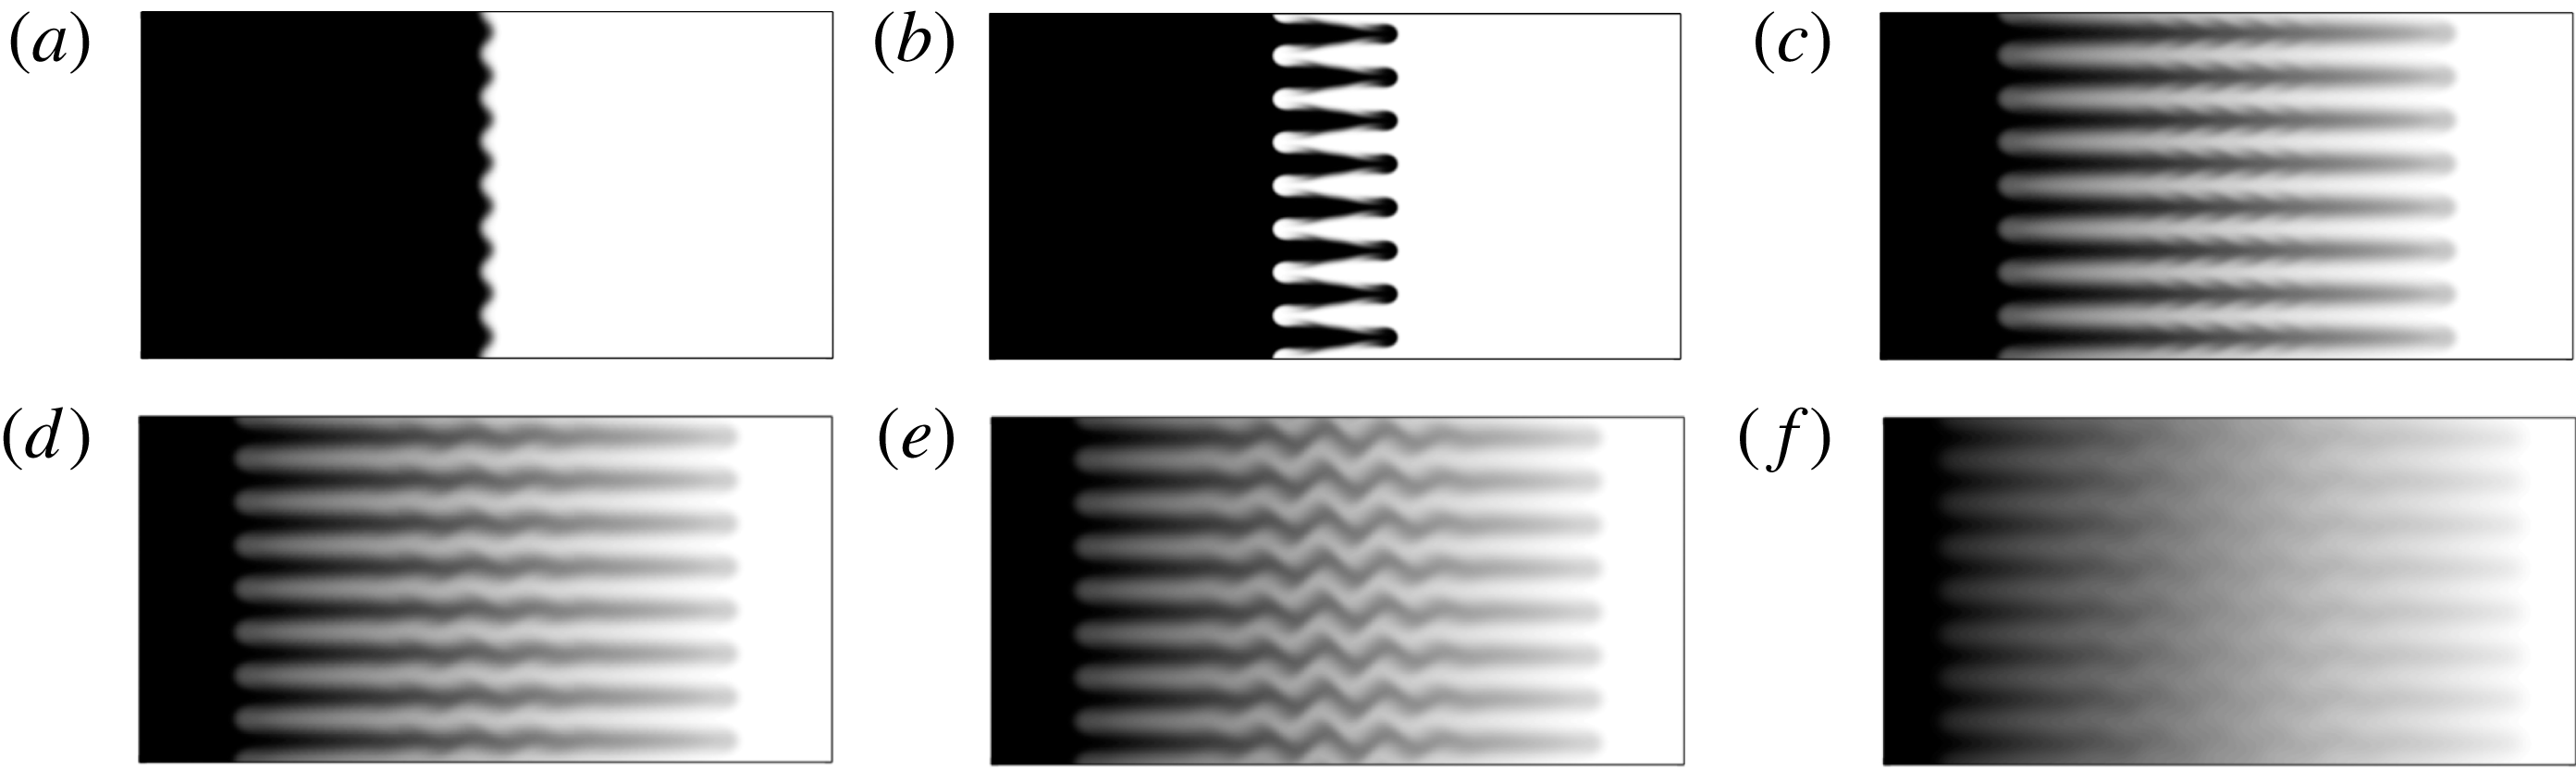
It is interesting to remark that, for a regular concentration perturbation, a definite value of the magnetic Rayleigh number may be found at which the finger pattern exhibits chevron instability. The development of this zigzag pattern is shown in figure 8.
Development of chevron instability at a regular concentration perturbation for magnetic Rayleigh number
 $\mathit{Ra}_{m}=1200$
,
 $L_{x}=24$
,
 $L_{y}=12$
,
 $t_{0}=0.0137$
,
 ${\rm\Delta}t=0.00001$
, and (a)
 $t=0.001$
, (b)
 $t=0.007$
, (c)
 $t=0.085$
, (d)
 $t=0.12$
, (e)
 $t=0.145$
, (f)
 $t=0.27$
.

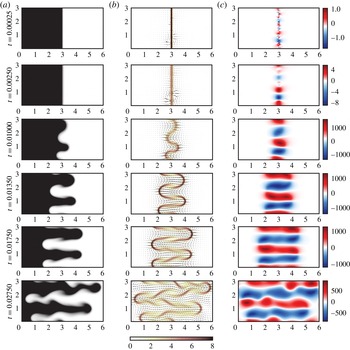
Numerical simulation makes it possible to study the finger formation between two miscible magnetic and non-magnetic fluids in detail. Figure 9 compares the concentration images, the velocity vector field, the absolute value of the concentration gradient and the vorticity distribution during the formation of two fingers. The initial concentration perturbation at the interface is introduced by random perturbation, the magnetic Rayleigh number being
 $\mathit{Ra}_{m}=500$
. The convection is caused by the ponderomotive forces due to the non-collinearity of the gradient of magnetic field and the gradient of concentration on the interface between fluids. Initially, at
 $t=0.00025$
(figure 9) a periodic system of vortices with different intensities is formed. The pair of
 $(+,-)$
vortices increases the absolute value of the gradient of concentration, and as a result also increases the absolute value of the fluid velocity (
 $t=0.0025$
). The velocity of fluids is maximal and fingers are formed (
 $t=0.01$
) between the pairs of
 $(+,-)$
vortices. The concentration gradient increases on the side boundaries of fingers (
 $t=0.0135$
), causing rearrangement of the vorticity (
 $t=0.0175$
) and formation of mushrooms on the plumes of the convective motion (
 $t=0.0275$
).
(a) Concentration images, (b) vector plots of the velocity field and absolute values of the concentration gradient, and (c) vorticity fields for a miscible magnetic and non-magnetic fluid in the Hele-Shaw cell. Numerical simulation snapshots correspond to the magnetic Rayleigh number
 $\mathit{Ra}_{m}=500$
at times
 $t=0.00025$
,
 $t=0.0025$
,
 $t=0.01$
,
 $t=0.0135$
,
 $t=0.0175$
,
 $t=0.0275$
, with
 $L_{x}=6$
,
 $L_{y}=3$
and
 $t_{0}=0.025$
.

4. Experimental observation
The experimental study of magnetic micro-convection is performed by observing the instability dynamics at the interface of two miscible fluids in a Hele-Shaw cell with an optical microscope. The first fluid is distilled water. The second is a water-based magnetic fluid with maghemite (
 ${\it\gamma}$
-
 $\text{Fe}_{2}\text{O}_{3}$
) particles that have an average diameter
 $d=7.0~\text{nm}$
(polydispersity
 $\text{PDI}=0.33$
), saturation magnetization
 $M_{sat}=8.4~\text{G}$
and an initial magnetic susceptibility
 ${\it\chi}_{m}=0.016$
, as determined by vibrating sample magnetometer magnetization measurements. Magnetic particles are synthesized by a coprecipitation method (Massart Reference Massart1981) and stabilized with citrate ions, leading to a fluid density
 ${\it\rho}_{mf}=1.147~\text{g}~\text{cm}^{-3}$
and particle volume fraction
 ${\it\phi}=2.9\,\%$
. An additional study in zero field of this water–magnetic fluid system with a jump of concentration (G. Kitenbergs, unpublished) shows that the effective diffusion coefficient is
 $D=5.4\times 10^{-5}~\text{cm}^{2}~\text{s}^{-1}$
.
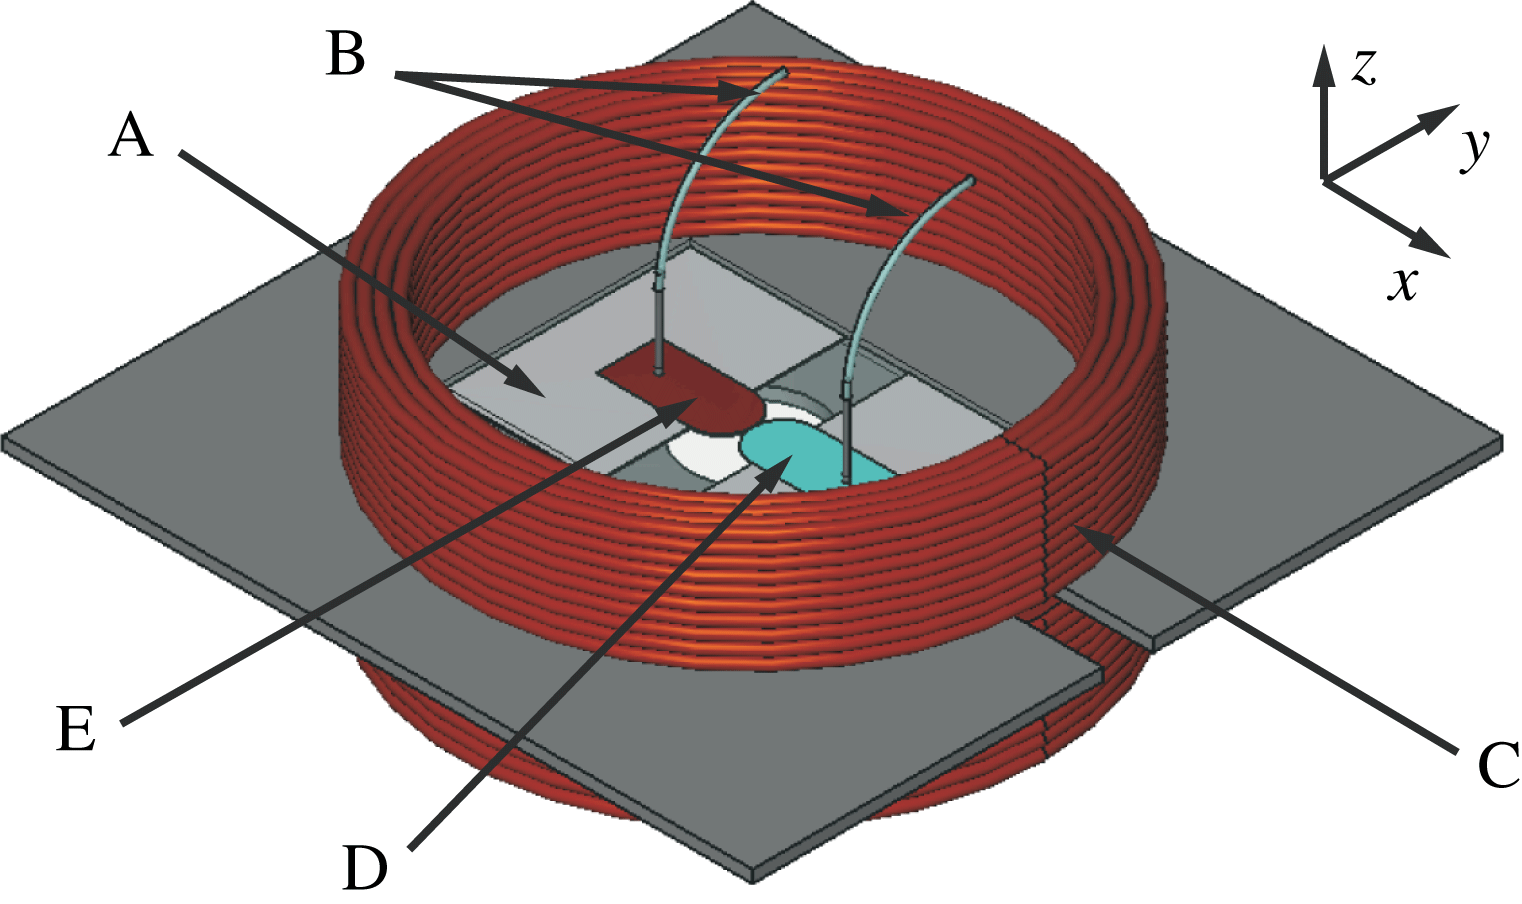
The experimental set-up, which is described in more detail in our recent publication (Kitenbergs et al.
Reference Kitenbergs, Erglis, Perzynski and Cebers2015), can be seen in figure 10. A Hele-Shaw cell (A) is made of two microscope glass slides and Parafilm M® spacers to form channels for fluids and air. The top glass slide has two drilled holes in which metallic tubes are glued for tubing connections (B) that come from syringes. Heating welds the glass slides and forms a Hele-Shaw cell with
 $h=120~{\rm\mu}\text{m}$
thickness and
 $5\times 20~\text{mm}$
lateral size. The cell is placed on a microscope stage equipped with a coil system (C) made up of two identical coils, creating a homogeneous magnetic field up to
 $H=150~\text{Oe}$
in the
 $z$
direction. Water (D) is introduced into the cell with a syringe through tubing to fill the cell halfway. Magnetic fluid (E) is slowly introduced with a syringe pump until it meets the water and an interface is formed. This has significantly improved the control of interface formation, allowing us to keep the initial concentration smearing as small as possible. The initial concentration smearing corresponds to the smearing parameter
 $t_{0}$
, which is crucial in numerical simulations. From a corresponding diffusion experiment (G. Kitenbergs, unpublished) performed in the same experimental set-up, we can estimate it to be
 $t_{0}\approx 0.05~\text{s}$
, as it is impossible to extract it directly for each experiment. Instability development is observed with an inverted microscope (Leica DMI 3000B, 10
 $\times$
, bright-field) and recorded with fast (Mikrotron MC1363, 50 Hz) and regular (Lumenera Lu165c, 15 Hz) cameras simultaneously.
Scheme of the experimental set-up with (A) a Hele-Shaw cell, (B) tubing connections, (C) a coil system, (D) water and (E) magnetic fluid droplets.

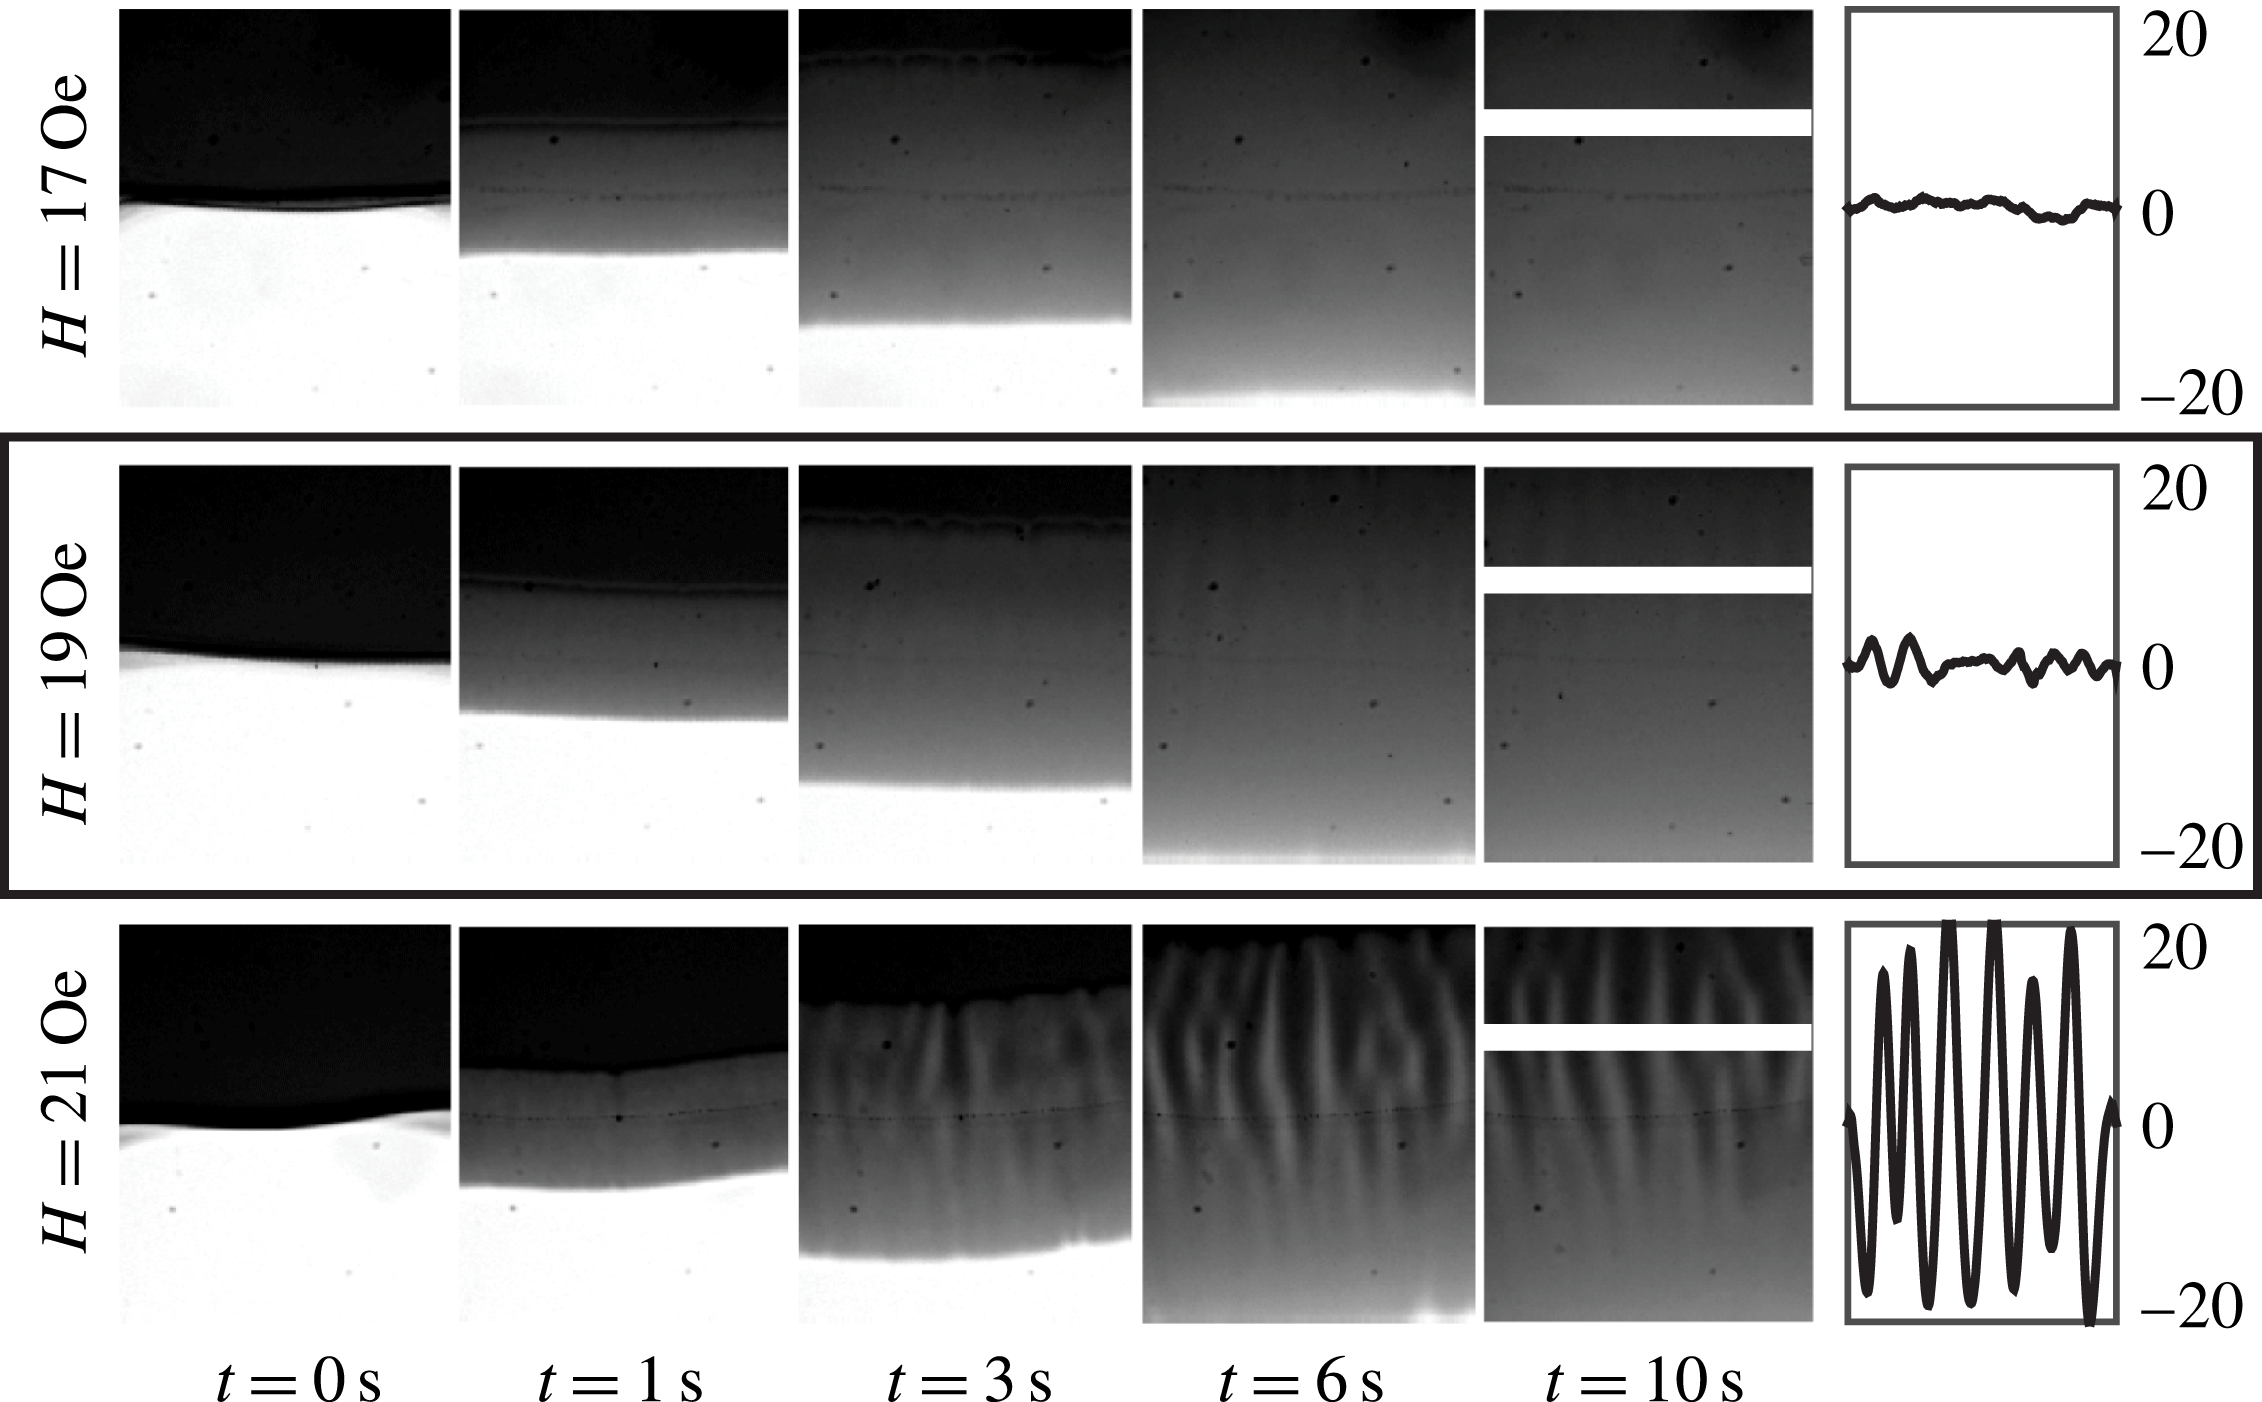
Experiments are performed for various magnetic field values. The critical field at which the fingering pattern appears is here estimated to be
 $H_{crit}=19\pm 1~\text{Oe}$
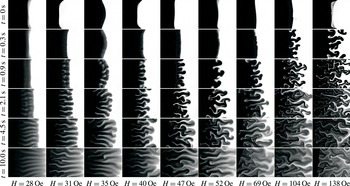
, justified by the experimental images in figure 11. Further increase of the field, as can be seen in figure 12, at first leads to straight fingers becoming more pronounced. Above a less obvious second threshold (
 $H\approx 40~\text{Oe}$
), finger bending and splitting is observed. A further increase of the magnetic field causes the instability to develop more rapidly. At
 $H=138~\text{Oe}$
, which is the largest magnetic field used in experiments, the primary fingers develop completely in less than a second (see also movie 3 in the supplementary material).
Experimental determination of the critical field (marked with a rectangle). Plots on the right-hand side show intensity values along the white lines at
 $t=10.0~\text{s}$
in a.u., after applying two moving average filters to remove background and noise. At
 $H=19~\text{Oe}$
a small but marked fingering pattern is visible, as compared to intensity fluctuations around the noise level at
 $H=17~\text{Oe}$
. At
 $H=21~\text{Oe}$
a well-developed fingering pattern is already visible.

Experimental images of the magnetic micro-convection development for various magnetic field values. Each image is
 $0.7~\text{mm}\times 0.9~\text{mm}$
in size.

To describe the process quantitatively, several characteristics are retrieved with image analysis methods, and are explained below.
4.1. Experimental image analysis
The experimental snapshots in figure 12 clearly indicate a field dependence. We perform an analysis of the experimental data comparable to that of the numerical simulations, and we retrieve the characteristic Fourier coefficients and wavenumber of the instability pattern and also the primary finger velocities. This is done with ‘in-house’ image processing algorithms written in MATLAB.
To allow direct comparison with numerical simulations, the images from the two cameras are transformed into concentration fields. As cameras are used in the linear regime, where intensity is proportional to the number of photons, and magnetic particles absorb optical light, the conversion is done with the Beer–Lambert law. The intensities of initial concentrations that are needed for the calculation are found in the first images of each image series, separately for both cameras. The concentrations are also normalized with respect to the initial magnetic fluid concentration, so setting
 $c_{0}=1$
. The coordinate systems of images from two cameras are linked via spatial calibration, which is done by cross-correlation of images of a fixed stage micrometer.
4.1.1. Analysis of fingering pattern dynamics
An obvious parameter of the fingering instability is its spatial periodicity. We quantify it by finding the dynamics of the characteristic Fourier coefficients of the concentration profile along the initial fluid interface, using the algorithm explained in § 2 of the supplementary material. As a result we get a colour-coded contour plot for each magnetic field value. The dynamics during the primary finger development at
 $H=138~\text{Oe}$
is shown next to numerical simulation data in figure 6(c) and for several other magnetic fields in figure SM.2 in the supplementary material.
To verify the Fourier coefficient accuracy, an additional algorithm finds the average wavenumber dynamics in the same concentration profiles. It is based on peak finding and is explained in § 3 in the supplementary material. The average wavenumbers are plotted as circles with error bars on the Fourier coefficient contour plots in figure 6(c) and SM.2 in the supplementary material.
Three points are worth noting. First, the dominant Fourier coefficients and average wavenumbers match well, confirming that the two algorithms are working accurately. Second, the characteristic wavenumber stays constant during the development of the primary fingers. Deviations from this constant value are visible only at the very beginning of each experiment, due to the time needed for the formation of the fluid interface and the first notable finger tips. Most importantly, the characteristic wavenumbers are close to the same value,
 $k\simeq 40{-}50~\text{mm}^{-1}$
, for a wide range of magnetic fields (
 $H=19{-}138~\text{Oe}$
).
This wavenumber
 $k$
corresponds to a characteristic wavelength
 ${\it\lambda}\simeq 125{-}160~{\rm\mu}\text{m}$
. It is close to the cell thickness
 $h$
and therefore consistent with earlier observations in Derec et al. (Reference Derec, Boltenhagen, Neveu and Bacri2008).
4.1.2. Analysis of the finger velocities
To characterize the instability dynamics across the initial interface, we choose to find the primary finger velocity dynamics. Velocities are found by locating the displacement of the maximal concentration gradient on the primary finger trajectories. The algorithm is described in § 5 of the supplementary material.
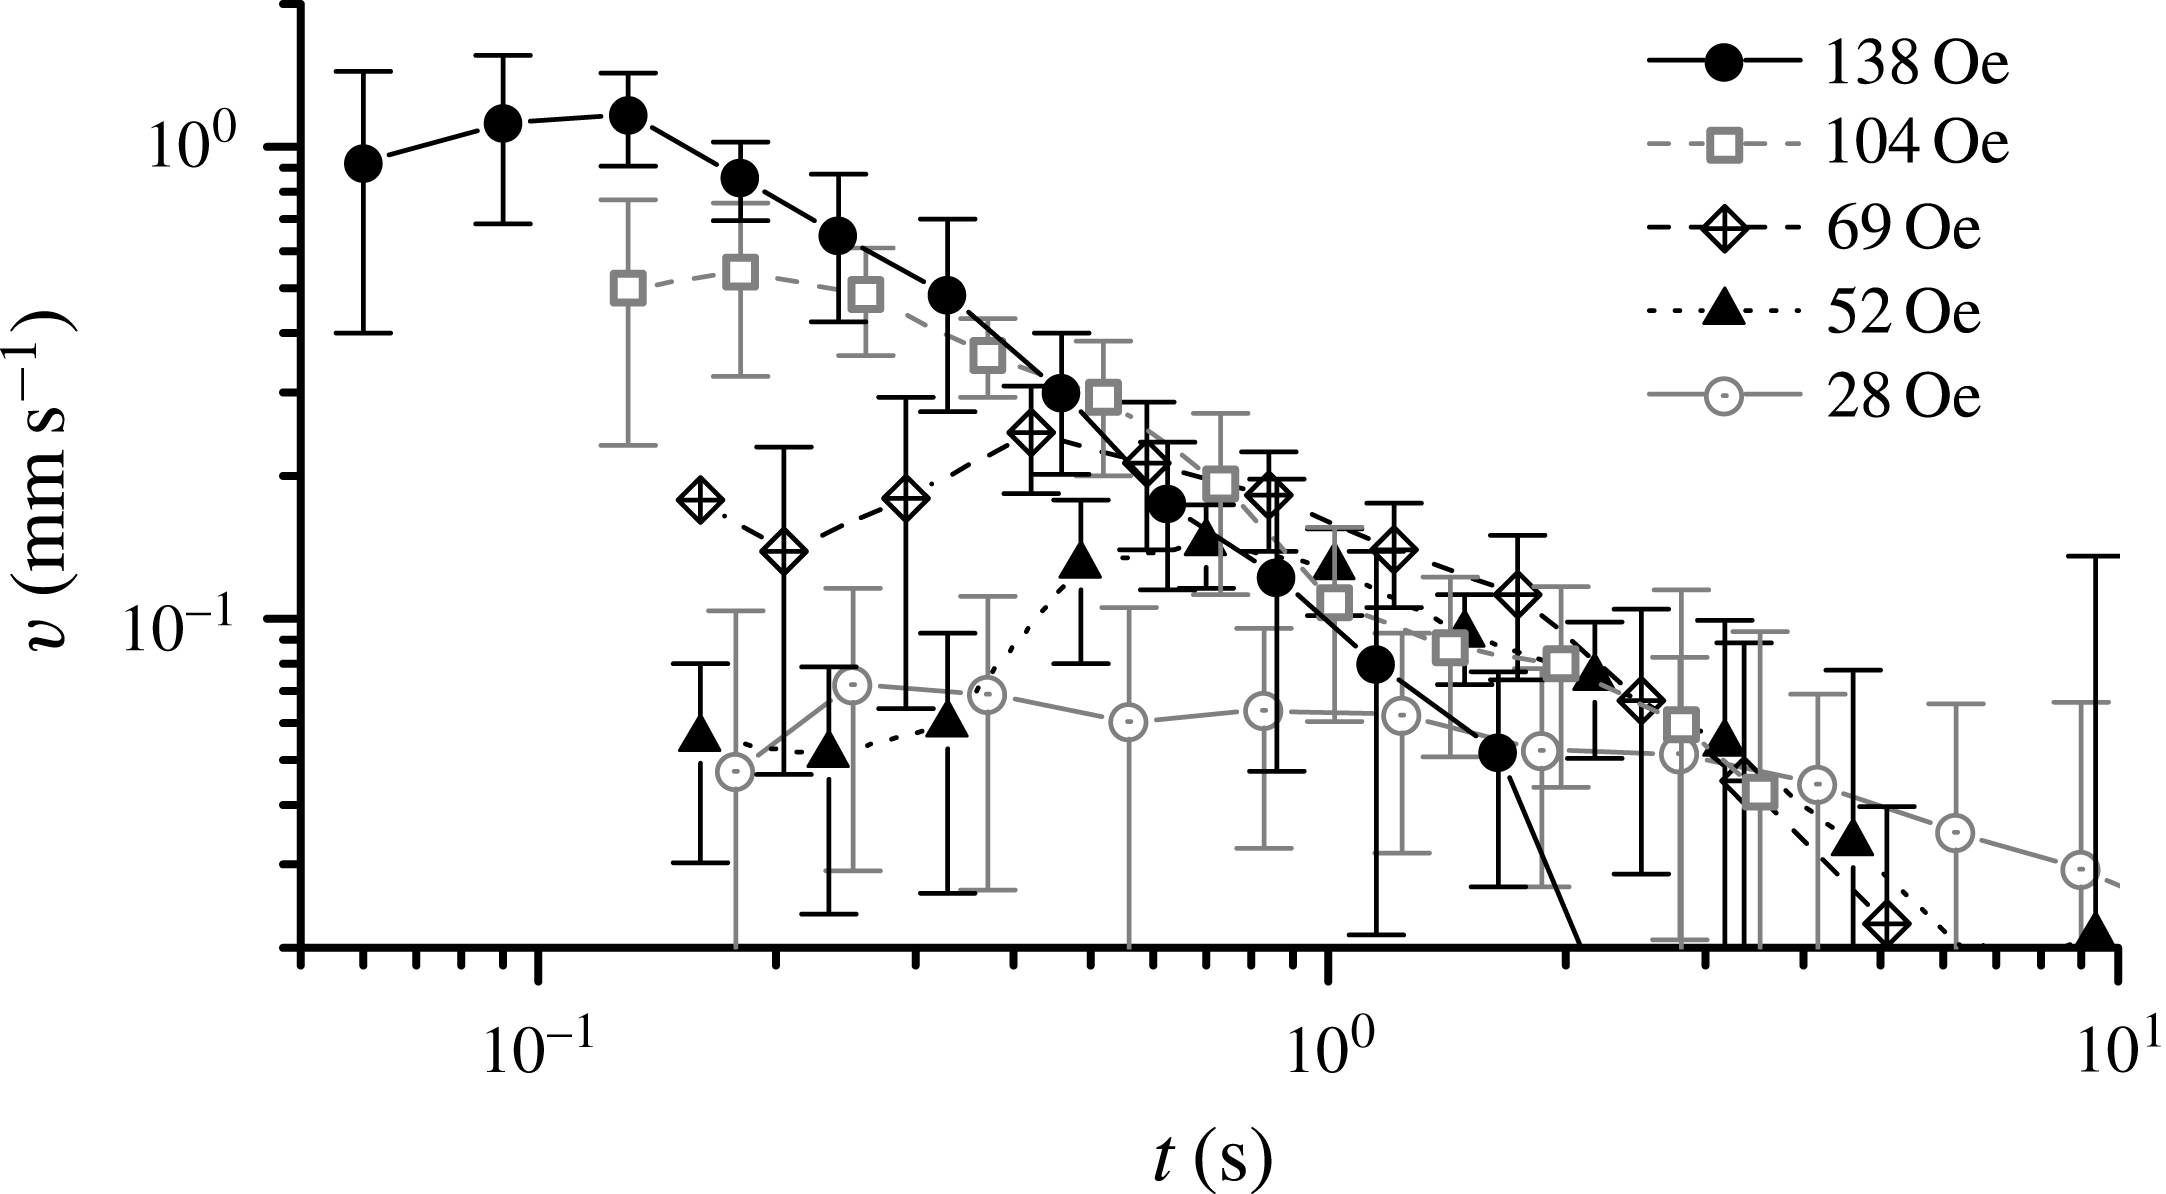
In each experiment the velocity dynamics is retrieved for several fingers. Averaging over these fingers and logarithmic time spans gives the average velocity dynamics and its standard deviation as the error for each magnetic field. Several of them are shown in figure 13. Data indicate that for fields larger than
 $H=40~\text{Oe}$
(corresponding to the second magnetic micro-convection threshold) the velocity first increases, reaching a maximum value
 $v_{max}$
which is followed by a slower decay. For lower fields (data shown only for
 $H=28~\text{Oe}$
) the primary finger velocity first remains roughly constant without any well-pronounced maximum, and later slowly decreases.
Finger velocity dynamics for several magnetic field values.

We quantify the field dependence by comparing the average maximal velocities. We find the maximal velocity
 $v_{max}$
for each finger and calculate the average value
 $\bar{v}_{max}$
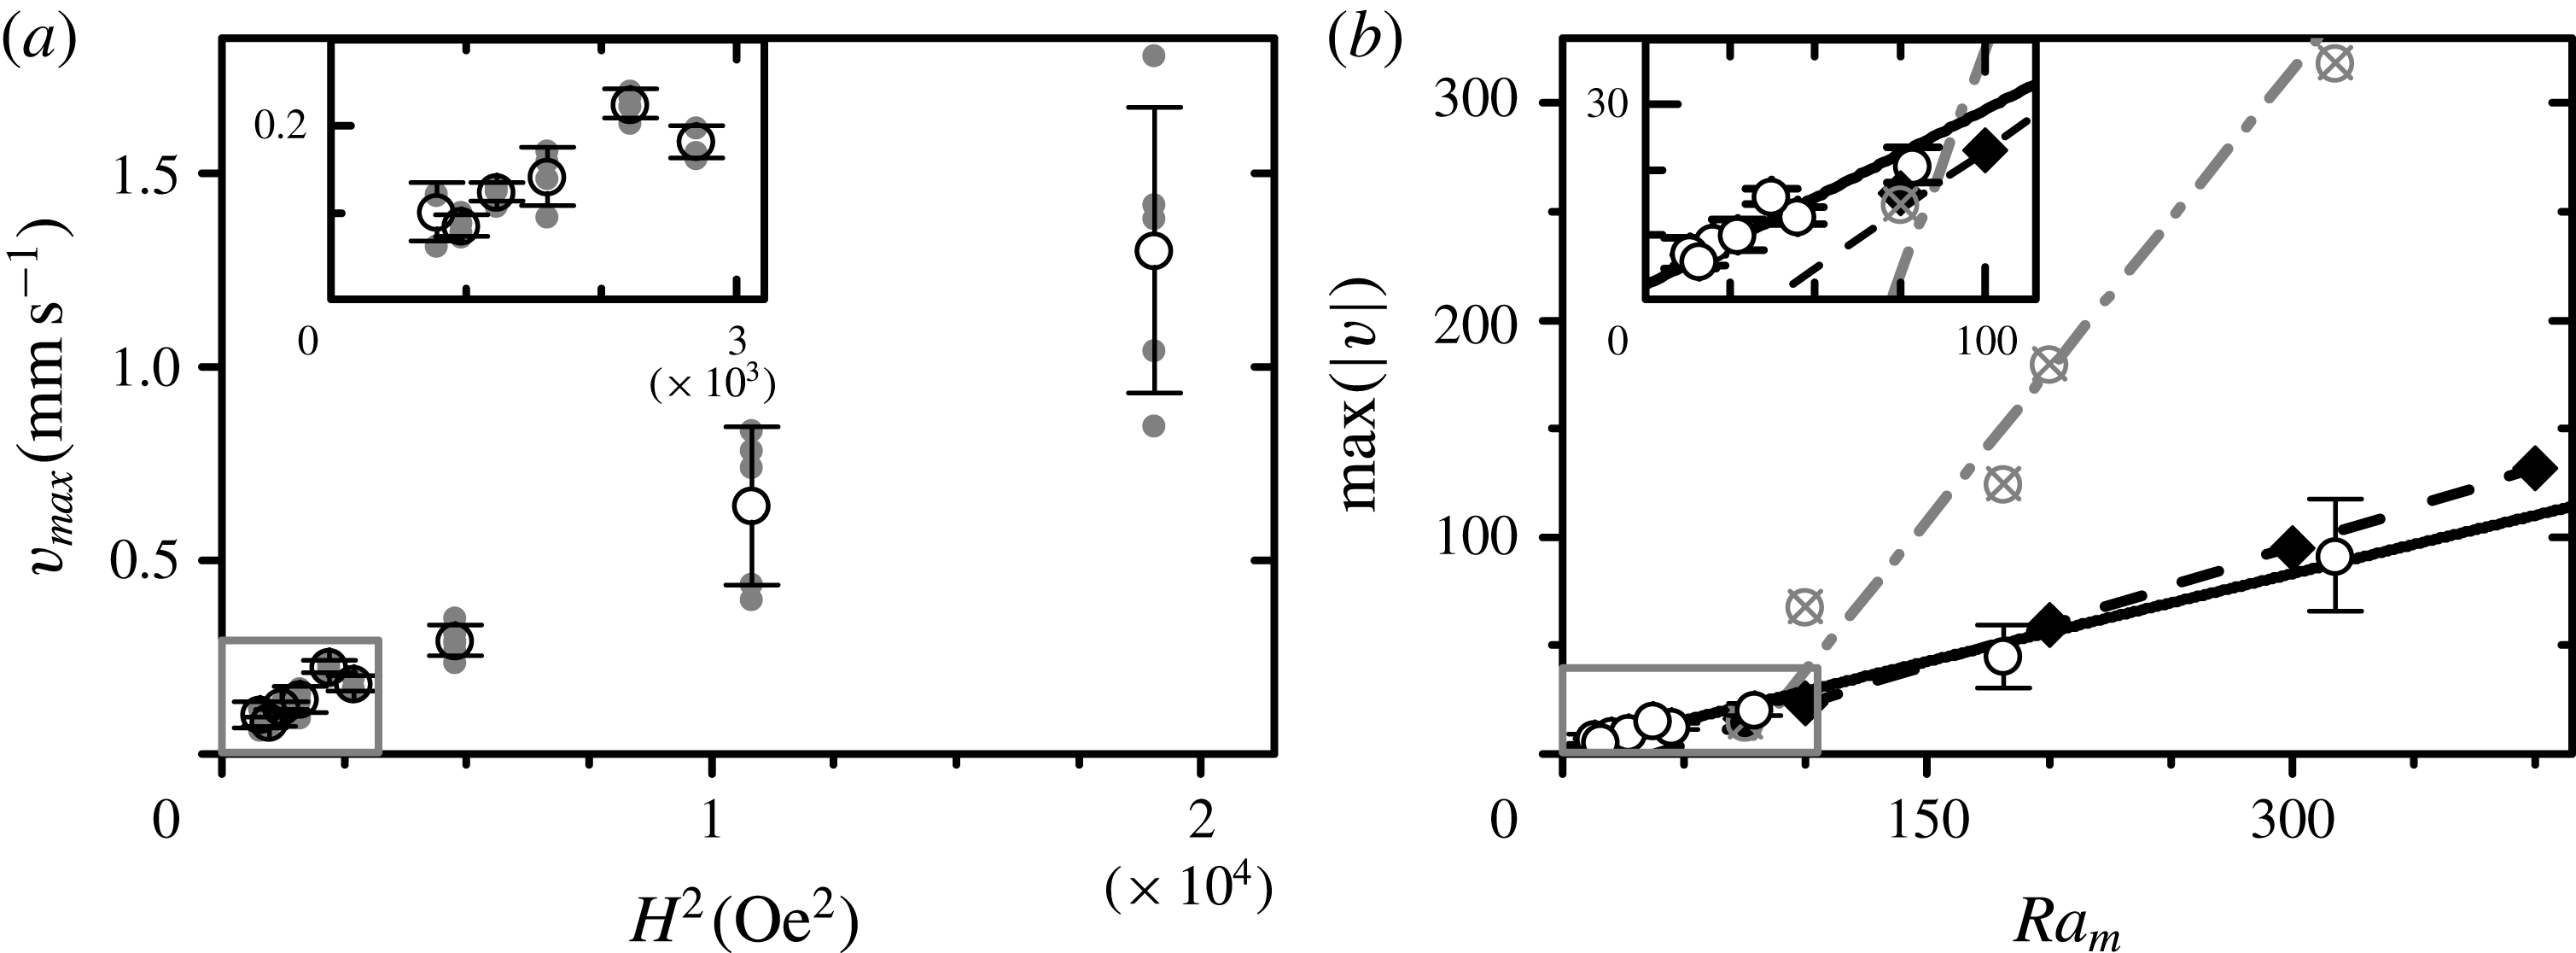
and its standard deviation for all magnetic fields. The average maximal velocity increases as a function of the magnetic field. It scales as
 $H^{2}$
, thus as the Rayleigh number
 $\mathit{Ra}_{m}$
. Data are shown in figure 14(a) as a function of the square of the magnetic field strength.
Maximal finger velocity. (a) Experimental data of the maximal finger velocity (grey dots) and average maximal velocity (empty circles with error bars) as a function of the square of the magnetic field strength. (b) Numerical simulation and experimental data with linear fits: the Brinkman model (black diamonds and a dashed line), the Darcy model (grey crossed open circles and a dash-dot line) and experimental data in dimensionless units (empty circles with error bars and a straight line) as a function of
 $\mathit{Ra}_{m}$
. Fitted slopes and their uncertainties are
 $0.36\pm 0.01$
,
 $1.39\pm 0.15$
and
 $0.27\pm 0.03$
. The two insets show the parts of the graphs marked with grey boxes in the main figures.

5. Discussion and comparison of experimental and theoretical results
Let us now compare the numerical simulations with the experimental results. The development of micro-convection depends on the magnetic Rayleigh number,
 $\mathit{Ra}_{m}=M_{0}^{2}h^{2}/12{\it\eta}D$
. The threshold value of the field strength at the development of the magnetic micro-convection (figure 11) allows us to estimate the diffusion coefficient of the particles. For the critical magnetic Rayleigh number, given the maximum of data in figure 3, we choose the value
 $\mathit{Ra}_{m}^{cr}=6$
corresponding to
 $t_{0}=0$
; we obtain
 $D=1.7\times 10^{-5}~\text{cm}^{2}~\text{s}^{-1}$
for the diffusion coefficient of the particles – a value of the same order of magnitude as that found above from the independent measurements of the diffusion profile in zero field. Note that it is much larger than the value calculated according to Einstein’s formula
 $k_{B}T/3{\rm\pi}{\it\eta}d\simeq 6\times 10^{-7}~\text{cm}^{2}~\text{s}^{-1}$
. It may be related to an electric field originating from the gradient of ionic species at the interface and able to modify the diffusion process. This will be studied in a separate publication (G. Kitenbergs, unpublished). Taking
 $t_{0}=0$
for this estimate corresponds to experimental observations with a smearing time of the diffusion front equal to 0.05 s, which in dimensionless units is approximately
 $5.7\times 10^{-3}$
and is close to zero.
A qualitative visual comparison can be done by watching the three movies in the supplementary material, which correspond to the Brinkman model (movie 1), the Darcy model (movie 2) and the experimental data (movie 3) at
 $\mathit{Ra}_{m}=318$
. The movies are created so that the fields of view and the durations are the same with respect to dimensionless quantities. More details can be found in § 1 in the supplementary material.
The Fourier spectra dynamics of the concentration perturbations are shown in figure 6. To simplify the comparison, the plot sizes are equalized with respect to the dimensionless quantities. For the experimental data (figure 6
c), the characteristic pattern wavenumber gives
 $k\simeq 40~\text{mm}^{-1}$
. Multiplying it by the thickness of the Hele-Shaw cell
 $h=120~{\rm\mu}\text{m}$
, we find
 $kh\simeq 5$
in dimensionless units, which is in good agreement with the numerical simulation data in the frame of the Brinkman model, visible in figure 6(a) and with the linear analysis. In contrast, the Darcy model figure 6(b) predicts an initial pattern with a much smaller scale and faster dynamics.
Finger velocities and their time dependence also agree well. Both numerical and experimental data in figure 7 show non-monotonic time dependence of the finger velocity. The Darcy model predicts faster growth and decay of the finger velocity than observed experimentally and found in the framework of the Brinkman model.
A quantitative comparison of the magnetic micro-convection field-dependence is done by comparing the maximal primary finger velocity as a function of the magnetic Rayleigh number. The experimental data (figure 14
a), after conversion to non-dimensional units, show good agreement with the numerical data obtained in the framework of the Brinkman model (figure 14
b). The slope 0.27 obtained experimentally for the linear dependence of
 $\max (|v|)$
as a function of
 $\mathit{Ra}_{m}$
is close to the value 0.36 for the Brinkman model and quite far from the value 1.39 in the frame of the Darcy model. The numerical values of the finger velocities are also similar. For example, the characteristic value of the finger velocity at
 $H=104~\text{Oe}$
is
 $0.64~\text{mm}~\text{s}^{-1}$
. In dimensionless units, it corresponds to 45 at
 $\mathit{Ra}_{m}=181$
, which is close to the value 59 obtained with the Brinkman model and very different from the value 180 obtained with the Darcy model for
 $\mathit{Ra}_{m}=200$
(see figure 14
b).
Both in numerical simulation and experiment (data not shown), if the magnetic Rayleigh number is large enough, the relation
 $v_{max}t_{max}\simeq 1$
(in dimensionless units) holds with good accuracy, where
 $t_{max}$
is the time interval at which the maximal finger velocity is established. This corresponds to the scaling
 $v_{max}=h{\it\tau}_{D}^{-1}\mathit{Ra}_{m}$
and
 $t_{max}={\it\tau}_{D}/\mathit{Ra}_{m}$
.
The development of micro-convection as shown by the numerical simulations (see figure 5,
 $t=0.035$
,
 $\mathit{Ra}_{m}=500$
) has the same features as those observed in experiments (figure 12,
 $35~\text{Oe}<H<40~\text{Oe}$
). In both numerical simulations and experiments we observe the formation of mushrooms, which, as shown by numerical calculation, are connected with the dynamics of vortices at the development of micro-convection (figure 9). We should point out that this feature was not observed in the numerical simulations carried out in the Darcy approximation (Erglis et al.
Reference Erglis, Tatulcenkov, Kitenbergs, Petrichenko, Ergin, Watz and Cebers2013).
Another interesting feature observed both in numerical simulations (figure 5) and in experiments (figure 12) is the bending instability of fingers, which leads to the formation of chevron patterns in the numerical simulations (figure 8). Formation of chevron patterns in thin ferromagnetic films (Seul & Wolfe Reference Seul and Wolfe1992) and stripe patterns of ferrofluids (Flament et al.
Reference Flament, Bacri, Cebers, Elias and Perzynski1996) occur if the distance between the stripes is larger than the equilibrium one. Development of chevrons in the case shown in figure 8 occurs by rearrangement of vortices responsible for the formation of fingers. The field strength
 $H_{ch}$
at which the chevron formation is observed in numerical simulation is
 $H_{ch}/H_{c}\simeq 5.5$
; this ratio is slightly larger than that observed in the experiment
 $\simeq 2.5$
(figure 12).
6. Conclusions
The numerical simulation and experimental study of the magnetic micro-convection carried out here show good qualitative and quantitative agreement. The application of the Brinkman model allows us to explain several quantitative and qualitative features of the magnetic micro-convection, which was not possible with the Darcy model. Rearrangements of the vortex patterns at the development of magnetic micro-convection are responsible for the formation of mushrooms on the plumes of micro-convective flows and their chevron-like instabilities. The non-monotonic time dependence of the finger velocities, which exhibits the development of micro-convection when the magnetic field strength is larger than the threshold value, and its subsequent decay due to particle diffusion, may be quantitatively described by the Brinkman model. The Darcy model predicts much faster growth and decay of instability than observed in the experiments. The dependence of the maximal finger velocity on the magnetic Rayleigh number calculated in the framework of the Brinkman model is in better quantitative agreement with experimental data than that calculated according to the Darcy model. A similar conclusion is valid with respect to the Fourier spectrum dynamics of the concentration field. The estimate of the particle diffusion coefficient from the experimentally determined threshold value of the field strength gives a value larger than expected for thermally driven diffusion processes by two orders of magnitude. This could be connected to the charge of the magnetic particles and other free species in the water-based fluid used, which will be studied in detail separately.
Acknowledgements
G.K.’s research was supported by European Social Fund Project 2013/0028/1DP/1.1.1.2.0/13/APIA/VIAA/054. The authors are grateful to M. M. Maiorov for magnetic measurements.
Supplementary movies
Supplementary movies are available at http://dx.doi.org/10.1017/jfm.2015.255.
Appendix A
In the limit
 $t_{0}\rightarrow 0$
,
 $\partial {\it\psi}_{m0}(x,0)/\partial x=-\ln (1+x^{-2})$
and the equations for the velocity component
 $u_{x}^{\prime }$
and concentration perturbations (2.11), (2.12) read
 $$\begin{eqnarray}\displaystyle & \displaystyle \left(\frac{\text{d}^{2}}{\text{d}x^{2}}-k^{2}\right)^{2}u_{x}^{\prime }-12\left(\frac{\text{d}^{2}}{\text{d}x^{2}}-k^{2}\right)u_{x}^{\prime }-24k^{2}\mathit{Ra}_{m}\ln (1+x^{-2})c^{\prime }=0, & \displaystyle\end{eqnarray}$$
 $$\begin{eqnarray}\displaystyle & \displaystyle ({\it\lambda}+k^{2})c^{\prime }-\frac{\text{d}^{2}c^{\prime }}{\text{d}x^{2}}=0. & \displaystyle\end{eqnarray}$$
 $c_{0}$
are given by continuity of the concentration perturbation, tangential and normal to the front velocity components and their derivatives:
 $$\begin{eqnarray}\displaystyle & \displaystyle c^{\prime }(0^{+})-c^{\prime }(0^{-})=0, & \displaystyle\end{eqnarray}$$
 $$\begin{eqnarray}\displaystyle & \displaystyle u_{x}^{\prime }(0^{+})-u_{x}^{\prime }(0^{-})=0, & \displaystyle\end{eqnarray}$$
 $$\begin{eqnarray}\displaystyle & \displaystyle \frac{\text{d}u_{x}^{\prime }}{\text{d}x}(0^{+})-\frac{\text{d}u_{x}^{\prime }}{\text{d}z}(0^{-})=0, & \displaystyle\end{eqnarray}$$
 $$\begin{eqnarray}\displaystyle & \displaystyle \frac{\text{d}^{2}u_{x}^{\prime }}{\text{d}x^{2}}(0^{+})-\frac{\text{d}^{2}u_{x}^{\prime }}{\text{d}x^{2}}(0^{-})=0. & \displaystyle\end{eqnarray}$$
 $\int _{-{\it\delta}}^{{\it\delta}}(\dots )\,\text{d}x$
of (A 1) and (A 2) across the diffusion layer and taking the limit
 ${\it\delta}\rightarrow 0$
, which gives
 $$\begin{eqnarray}\displaystyle & \displaystyle \frac{\text{d}c^{\prime }}{\text{d}x}(0^{+})-\frac{\text{d}c^{\prime }}{\text{d}x}(0^{-})=-c_{0}u_{x}^{\prime }(0), & \displaystyle\end{eqnarray}$$
 $$\begin{eqnarray}\displaystyle & \displaystyle \frac{\text{d}^{3}u_{x}^{\prime }}{\text{d}x^{3}}(0^{+})-\frac{\text{d}^{3}u_{x}^{\prime }}{\text{d}x^{3}}(0^{-})=-24k^{2}\mathit{Ra}_{m}{\it\psi}_{m}^{\prime }(0). & \displaystyle\end{eqnarray}$$
 $c^{\prime }$
, and taking into account conditions at infinity
 $c^{\prime }(\infty )=0$
,
 $c^{\prime }(-\infty )=0$
, it follows that
 $$\begin{eqnarray}\displaystyle c^{\prime }|_{x<0}=Q\text{e}^{\sqrt{{\it\lambda}+k^{2}}x}, & & \displaystyle\end{eqnarray}$$
 $$\begin{eqnarray}\displaystyle c^{\prime }|_{x>0}=Q\text{e}^{-\sqrt{{\it\lambda}+k^{2}}x}. & & \displaystyle\end{eqnarray}$$
 $$\begin{eqnarray}\quad u_{x}^{\prime }=\tilde{A}_{1}(x)\text{e}^{kx}+\tilde{B}_{1}(x)\text{e}^{-kx}+\tilde{C}_{1}(x)\text{e}^{\sqrt{k^{2}+12}x}+\tilde{D}_{1}(x)\text{e}^{-\sqrt{k^{2}+12}x},\end{eqnarray}$$
where the functions
 $\tilde{A}_{1}$
,
 $\tilde{B}_{1}$
,
 $\tilde{C}_{1}$
,
 $\tilde{D}_{1}$
are given by the solution of the set of linear differential equations
 $$\begin{eqnarray}\displaystyle & \displaystyle \frac{\text{d}\tilde{A}_{1}}{\text{d}x}\text{e}^{kx}+\frac{\text{d}\tilde{B}_{1}}{\text{d}x}\text{e}^{-kx}+\frac{\text{d}\tilde{C}_{1}}{\text{d}x}\text{e}^{kmx}+\frac{\text{d}\tilde{D}_{1}}{\text{d}x}\text{e}^{-kmx}=0, & \displaystyle\end{eqnarray}$$
 $$\begin{eqnarray}\displaystyle & \displaystyle \frac{\text{d}\tilde{A}_{1}}{\text{d}x}\text{e}^{kx}-\frac{\text{d}\tilde{B}_{1}}{\text{d}x}\text{e}^{-kx}+m\frac{\text{d}\tilde{C}_{1}}{\text{d}x}\text{e}^{kmx}-m\frac{\text{d}\tilde{D}_{1}}{\text{d}x}\text{e}^{-kmx}=0, & \displaystyle\end{eqnarray}$$
 $$\begin{eqnarray}\displaystyle & \displaystyle \frac{\text{d}\tilde{A}_{1}}{\text{d}x}\text{e}^{kx}+\frac{\text{d}\tilde{B}_{1}}{\text{d}x}\text{e}^{-kx}+m^{2}\frac{\text{d}\tilde{C}_{1}}{\text{d}x}\text{e}^{kmx}+m^{2}\frac{\text{d}\tilde{D}_{1}}{\text{d}x}\text{e}^{-kmx}=0, & \displaystyle\end{eqnarray}$$
 $$\begin{eqnarray}\displaystyle & \displaystyle \frac{\text{d}\tilde{A}_{1}}{\text{d}x}\text{e}^{kx}-\frac{\text{d}\tilde{B}_{1}}{\text{d}x}\text{e}^{-kx}+m^{3}\frac{\text{d}\tilde{C}_{1}}{\text{d}x}\text{e}^{kmx}-m^{3}\frac{\text{d}\tilde{D}_{1}}{\text{d}x}\text{e}^{-kmx}=\frac{24}{k}\mathit{Ra}_{m}\ln (1+x^{-2})c^{\prime }(x). & \displaystyle\end{eqnarray}$$
 $$\begin{eqnarray}\displaystyle & \tilde{A}_{1}|_{x<0}=-k\mathit{Ra}_{m}Qg(-k(s-1),x)+A_{1}, & \displaystyle\end{eqnarray}$$
 $$\begin{eqnarray}\displaystyle & \tilde{A}_{1}|_{x>0}=-k\mathit{Ra}_{m}Qg(k(s+1),x)+A_{2}, & \displaystyle\end{eqnarray}$$
 $$\begin{eqnarray}\displaystyle & \tilde{B}_{1}|_{x<0}=k\mathit{Ra}_{m}Qg(-k(s+1),x)+B_{1}, & \displaystyle\end{eqnarray}$$
 $$\begin{eqnarray}\displaystyle & \tilde{B}_{1}|_{x>0}=k\mathit{Ra}_{m}Qg(k(s-1),x)+B_{2}, & \displaystyle\end{eqnarray}$$
 $$\begin{eqnarray}\displaystyle & \tilde{C}_{1}|_{x<0}=\displaystyle \frac{k}{m}\mathit{Ra}_{m}Qg(-k(s-m),x)+C_{1}, & \displaystyle\end{eqnarray}$$
 $$\begin{eqnarray}\displaystyle & \tilde{C}_{1}|_{x>0}=\displaystyle \frac{k}{m}\mathit{Ra}_{m}Qg(k(s+m),x)+C_{2}, & \displaystyle\end{eqnarray}$$
 $$\begin{eqnarray}\displaystyle & \tilde{D}_{1}|_{x<0}=-\displaystyle \frac{k}{m}\mathit{Ra}_{m}Qg(-k(s+m),x)+D_{1}, & \displaystyle\end{eqnarray}$$
 $$\begin{eqnarray}\displaystyle & \tilde{D}_{1}|_{x>0}=-\displaystyle \frac{k}{m}\mathit{Ra}_{m}Qg(k(s-m),x)+D_{2}, & \displaystyle\end{eqnarray}$$
 $m=\sqrt{1+12/k^{2}}$
,
 $s=\sqrt{1+{\it\lambda}/k^{2}}$
and
 $$\begin{eqnarray}g(a,z)=\int _{0}^{z}\text{e}^{-a{\it\zeta}}\ln (1+{\it\zeta}^{-2})\,\text{d}{\it\zeta},\quad g(a,-z)=-g(-a,z).\end{eqnarray}$$
As a result,
 $$\begin{eqnarray}\displaystyle u_{x}^{\prime }|_{x<0} & = & \displaystyle A_{1}\text{e}^{kx}+B_{1}\text{e}^{-kx}+C_{1}\text{e}^{kmx}+D_{1}\text{e}^{-kmx}\nonumber\\ \displaystyle & & \displaystyle -\,k\mathit{Ra}_{m}Qg(-k(s-1),x)\text{e}^{kx}+k\mathit{Ra}_{m}Qg(-k(s+1),x)\text{e}^{-kx}\nonumber\\ \displaystyle & & \displaystyle +\,\frac{k}{m}\mathit{Ra}_{m}Qg(-k(s-m),x)\text{e}^{kmx}-\frac{k}{m}\mathit{Ra}_{m}Qg(-k(s+m),x)\text{e}^{-kmx},\end{eqnarray}$$
 $$\begin{eqnarray}\displaystyle u_{x}^{\prime }|_{x>0} & = & \displaystyle A_{2}\text{e}^{kx}+B_{2}\text{e}^{-kx}+C_{2}\text{e}^{kmx}+D_{2}\text{e}^{-kmx}\nonumber\\ \displaystyle & & \displaystyle -\,k\mathit{Ra}_{m}Qg(k(s+1),x)\text{e}^{kx}+k\mathit{Ra}_{m}Qg(k(s-1),x)\text{e}^{-kx}\nonumber\\ \displaystyle & & \displaystyle +\,\frac{k}{m}\mathit{Ra}_{m}Qg(k(s+m),x)\text{e}^{kmx}-\frac{k}{m}\mathit{Ra}_{m}Qg(k(s-m),x)\text{e}^{-kmx}.\end{eqnarray}$$
 $$\begin{eqnarray}sk+\mathit{Ra}_{m}\left(2\frac{m-1}{m}J(s,k)+k\left[\frac{g(k(s+m),\infty )}{m}-g(k(s+1),\infty )\right]\right)=0,\end{eqnarray}$$
where the function
 $J(p,q)$
is defined by the integral
 $$\begin{eqnarray}J(p,q)=\int _{0}^{\infty }\text{e}^{-pz}\left(K_{0}(z)-K_{0}\left(\sqrt{z^{2}+q^{2}}\right)\right)\text{d}z.\end{eqnarray}$$
Appendix B
Introducing the stream function
 ${\it\psi}$
via
 $u_{x}=\partial {\it\psi}/\partial y$
and
 $u_{y}=-\partial {\it\psi}/\partial x$
, and the vorticity
 ${\it\omega}=-{\rm\Delta}{\it\psi}$
allows us to rewrite the convection–diffusion equation (2.8) as
 $$\begin{eqnarray}\frac{\partial c^{\prime }}{\partial t}=\frac{\partial ^{2}c^{\prime }}{\partial x^{2}}+\frac{\partial ^{2}c^{\prime }}{\partial y^{2}}-\frac{\partial {\it\psi}}{\partial y}\left(\frac{\partial c_{0}}{\partial x}+\frac{\partial c^{\prime }}{\partial x}\right)+\frac{\partial {\it\psi}}{\partial x}\frac{\partial c^{\prime }}{\partial y}.\end{eqnarray}$$
Equation (2.7a,b ) gives the vorticity equation
 $$\begin{eqnarray}{\it\omega}=-\frac{1}{12}{\rm\Delta}^{2}{\it\psi}-2\mathit{Ra}_{m}\left(\frac{\partial {\it\psi}_{m}}{\partial y}\left[\frac{\partial c_{0}}{\partial x}+\frac{\partial c^{\prime }}{\partial x}\right]-\frac{\partial {\it\psi}_{m}}{\partial x}\frac{\partial c^{\prime }}{\partial y}\right).\end{eqnarray}$$
Integration in (3.3a
) is carried out through all of the infinite region occupied by the magnetic fluid. The fast decay of the field strength
 $\partial {\it\psi}_{m0}/\partial x$
with distance from the diffusion front justifies the use of periodic boundary conditions. Integration in (3.3b
) is carried out along the cell with dimensions
 $L_{x}$
and
 $L_{y}$
.
The Fourier component of
 $\partial {\it\psi}_{m0}/\partial x$
is obtained using the convolution theorem:
 $$\begin{eqnarray}\hat{\frac{\partial {\it\psi}_{m0}}{\partial x}}(q_{m})=2{\rm\pi}\hat{\frac{\partial c_{0}}{\partial x}}(q_{m})\frac{1-\text{e}^{-|q_{m}|}}{|q_{m}|},\end{eqnarray}$$
where the Fourier coefficients
 $\hat{\partial c_{0}}/\partial x$
are calculated by a one-dimensional fast Fourier transform (the domain size is increased in the
 $x$
direction from
 $L_{x}$
to
 $4L_{x}$
to eliminate the Gibbs phenomenon).
The concentration perturbation
 $c^{\prime }$
, the stream function
 ${\it\psi}$
and the vorticity
 ${\it\omega}$
are presented by the Fourier series
 $$\begin{eqnarray}\displaystyle & \displaystyle c^{\prime }(x,y,t)=\mathop{\sum }_{m=0}^{M-1}\mathop{\sum }_{n=0}^{N-1}{\hat{c}}_{mn}(t)\text{e}^{\text{i}(q_{m}x+k_{n}y)}, & \displaystyle\end{eqnarray}$$
 $$\begin{eqnarray}\displaystyle & \displaystyle {\it\psi}(x,y,t)=\mathop{\sum }_{m=0}^{M-1}\mathop{\sum }_{n=0}^{N-1}\hat{{\it\psi}}_{mn}(t)\text{e}^{\text{i}(q_{m}x+k_{n}y)}, & \displaystyle\end{eqnarray}$$
 $$\begin{eqnarray}\displaystyle & \displaystyle {\it\omega}(x,y,t)=\mathop{\sum }_{m=0}^{M-1}\mathop{\sum }_{n=0}^{N-1}\hat{{\it\omega}}_{mn}(t)\text{e}^{\text{i}(q_{m}x+k_{n}y)}, & \displaystyle\end{eqnarray}$$
 $q_{m}=(2{\rm\pi}m)/L_{x}$
,
 $k_{n}=(2{\rm\pi}n)/L_{y}$
are wavenumbers (
 $m,n=0,1,2,\dots$
). Functions
 ${\hat{c}}_{mn}$
,
 $\hat{{\it\psi}}_{mn}$
and
 $\hat{{\it\omega}}_{mn}$
are calculated by using fast Fourier transform in collocation points
 $x_{m}=(L_{x}/M)m$
and
 $y_{n}=(L_{y}/N)n$
(
 $m=0,1,2,\dots ,M-1$
,
 $n=0,1,2,\dots ,N-1$
). The total number of collocation points
 $N$
,
 $M$
is proportional to
 $2^{p}$
,
 $p=1,2,3,\dots ,$
and depend on the concrete case.
The non-linear terms in (B 1) and (B 2) are given by applying the fast Fourier transform:
 $$\begin{eqnarray}\displaystyle & \displaystyle J(x,y,t)=\frac{\partial {\it\psi}}{\partial y}\left(\frac{\partial c_{0}}{\partial x}+\frac{\partial c^{\prime }}{\partial x}\right)-\frac{\partial {\it\psi}}{\partial x}\frac{\partial c^{\prime }}{\partial y}=\mathop{\sum }_{m=0}^{M-1}\mathop{\sum }_{n=0}^{N-1}{\hat{J}}_{mn}(t)\text{e}^{\text{i}(q_{m}x+k_{n}y)}, & \displaystyle\end{eqnarray}$$
 $$\begin{eqnarray}\displaystyle & \displaystyle Q(x,y,t)=\frac{\partial {\it\psi}_{m}}{\partial y}\left(\frac{\partial c_{0}}{\partial x}+\frac{\partial c^{\prime }}{\partial x}\right)-\frac{\partial {\it\psi}_{m}}{\partial x}\frac{\partial c^{\prime }}{\partial y}=\mathop{\sum }_{m=0}^{M-1}\mathop{\sum }_{n=0}^{N-1}\hat{Q}_{nm}(t)\text{e}^{\text{i}(q_{m}x+k_{n}y)}. & \displaystyle\end{eqnarray}$$
As a result, the equations for the amplitudes of the Fourier modes read
 $$\begin{eqnarray}\displaystyle & \hat{{\it\omega}}_{mn}=(q_{m}^{2}+k_{n}^{2})\hat{{\it\psi}}_{mn}, & \displaystyle\end{eqnarray}$$
 $$\begin{eqnarray}\displaystyle & \displaystyle \hat{{\it\omega}}_{mn}=-\frac{(q_{m}^{2}+k_{n}^{2})^{2}}{12}\hat{{\it\psi}}_{mn}-2\mathit{Ra}_{m}\hat{Q}_{mn}, & \displaystyle\end{eqnarray}$$
 $$\begin{eqnarray}\displaystyle & \displaystyle \frac{\partial {\hat{c}}_{mn}}{\partial t}=-(q_{m}^{2}+k_{n}^{2}){\hat{c}}_{mn}-{\hat{J}}_{mn}. & \displaystyle\end{eqnarray}$$
The values of the stream function
 ${\it\psi}(t_{j})$
for given values of the concentration
 $c(t_{j})$
are found from (B 6) and (B 7). Since
 ${\it\psi}_{m}^{\prime }$
is periodic in both the
 $x$
and
 $y$
directions,
 $\hat{{\it\psi}}_{m}^{\prime }(\boldsymbol{k})$
is obtained as follows:
 $$\begin{eqnarray}\hat{{\it\psi}}_{m}^{\prime }(\boldsymbol{k})=2{\rm\pi}{\hat{c}}_{mn}(\boldsymbol{k})\hat{T}_{mn}(\boldsymbol{k}),\end{eqnarray}$$
where
 $\boldsymbol{k}=(q_{m},k_{n})$
is the two-dimensional wavevector and
 $|\boldsymbol{k}|=\sqrt{q_{m}^{2}+k_{n}^{2}}$
. The Fourier coefficients
 ${\hat{c}}_{mn}$
are calculated by a two-dimensional fast Fourier transform algorithm, and
 $\hat{T}_{mn}(\boldsymbol{k})=(1-\text{e}^{-|\boldsymbol{k}|})/(|\boldsymbol{k}|)$
is the Fourier transform of
 $K(\boldsymbol{r},1)$
. All derivatives of
 ${\it\psi}_{m}^{\prime }$
are calculated spectrally from the obtained values of
 $\hat{{\it\psi}}_{m}^{\prime }(\boldsymbol{k})$
.
The linear equation (B 8) is solved for the known stream function by applying the linear propagator method, which factors out the leading-order linear term prior to the discretization. Introducing
 $\hat{{\it\chi}}_{mn}=\text{e}^{(q_{m}^{2}+k_{n}^{2})t}{\hat{c}}_{mn}$
, the equation
 $(\partial \hat{{\it\chi}}_{mn})/(\partial t)=-\text{e}^{(q_{m}^{2}+k_{n}^{2})t}{\hat{J}}_{mn}$
is discretized by using the three-step Adams–Bashforth method (Samarskij & Gulin Reference Samarskij and Gulin1989). The result reads
 $$\begin{eqnarray}\displaystyle & \displaystyle {\hat{c}}_{mn}^{(j+1)\ast }={\hat{c}}_{mn}^{j}{\it\gamma}-\frac{{\rm\Delta}t}{12}(23{\hat{J}}_{mn}^{j}{\it\gamma}-16{\hat{J}}_{mn}^{(j-1)}{\it\gamma}^{2}+5{\hat{J}}_{mn}^{(j-2)}{\it\gamma}^{3}), & \displaystyle\end{eqnarray}$$
 $$\begin{eqnarray}\displaystyle & {\it\gamma}=\text{e}^{-(q_{m}^{2}+k_{n}^{2}){\rm\Delta}t}. & \displaystyle\end{eqnarray}$$
Further, corrected values of
 ${\it\psi}_{mn}^{(j+1)\ast }$
and
 ${\hat{J}}_{mn}^{(j+1)\ast }$
are found from (B 6), (B 7) and (B 5a
), respectively. As a result the Fourier components of the concentration are obtained for the next time step:
 $$\begin{eqnarray}{\hat{c}}_{mn}^{(j+1)}={\hat{c}}_{mn}^{j}-\frac{{\rm\Delta}t}{2}({\hat{J}}_{mn}^{(j+1)\ast }+{\hat{J}}_{mn}^{j})-\frac{{\rm\Delta}t}{2}(q_{m}^{2}+k_{n}^{2})({\hat{c}}_{mn}^{(j+1)\ast }+{\hat{c}}_{mn}^{j}).\end{eqnarray}$$
The concentration field is obtained by applying the inverse fast Fourier transform to
 ${\hat{c}}_{mn}^{(j+1)}$
and adding
 $c_{0}(t)$
. Since the numerical scheme used is not fully implicit in time, the solution may show numerical instability.