

Introduction
Many countries struggle to improve the performance of their health care systems, while containing costs. The Netherlands is no different in this respect. The Dutch reforms follow the international trend of health care systems towards incentives and competition (Cutler, Reference Cutler2002), making the system more demand driven. In 2006, a new universal mandatory insurance scheme was introduced, requiring all Dutch citizens to buy standardized individual health insurance coverage from a private insurer (Ministry of Health, 2006a; Van de Ven and Schut, Reference Ven and Schut2008). The aim is to replace supply-side regulation by a managed competition scheme in which competing health insurers act as prudent buyers of health services. Insurers are allowed to selectively contract or integrate with health care providers and have to accept any applicant at a community rated premium. A Risk Equalization Fund (REF) compensates insurers for enrollees with predictably high medical expenses. Gradually, the supply-side constraints are being relaxed and replaced through demand-side constraints by increasing the cost-consciousness of buyers, both consumers and health insurers.
However, in the Dutch context increasing cost consciousness through cost-sharing arrangements has always been politically a very controversial issue because of its negative redistributive effects for the unhealthy poor. In the previous social health insurance scheme that covered lower- and middle-income groups, several co-payment schedules were introduced, but were all soon abolished. Since the degree of cost sharing was typically very modest and the various co-payment schedules were often poorly designed, the impact on health care expenditure was negligible (Schut and Van de Ven, Reference Schut and van de Ven2005). Moreover, because of all types of exemptions and compensation payments to mitigate the negative redistributive effects for the elderly and chronically ill, the administrative costs of the schemes tended to outweigh the savings on medical consumption. The apparent ineffectiveness and administrative complexity contributed to the general unpopularity of the various cost-sharing arrangements and most co-payment schedules did not survive a change of government. As a consequence, demand constraints have played only a marginal role in containing costs as compared to supply-side constraints (Schut and Van de Ven, Reference Schut and van de Ven2005).
In view of the previous unsuccessful attempts, the Dutch government opted for a ‘consumer friendly’ method of cost sharing in social health insurance. Instead of a ‘penalty’ for using health services – as in the case of co-payments and deductibles – the government proposed the introduction of a ‘bonus’ for not using health services. During a calendar year, people incurring less health care costs than a certain threshold (₠ 255), would be entitled to receive the difference between their annual expenses and the threshold in the form of a ‘no-claim rebate’. Since the average expected no-claim rebate that had to be paid by health insurers was about ₠ 90, the average premium had to be raised by that amount (Ministry of Health, 2006c). In this sense, the no-claim rebate is exactly the opposite of a deductible, where the premium can be reduced because of increased out-of-pocket payments. Although the redistributive effects of the no-claim rebate are similar to that of a deductible, a perceived advantage of the no-claim rebate was that, contrary to a deductible, there would be no financial barrier to care use at the moment of health care need (Ministry of Health, 2004).
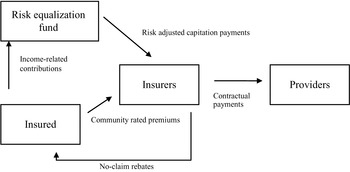
In anticipation of the introduction of the new Health Insurance Act in 2006, the no-claim rebate was already introduced in the former social health insurance scheme (Sickness Fund Act) in 2005. Despite its more friendly appearance, the introduction of the no-claim rebate encountered substantial opposition, which forced the government to exempt GP services from the scheme. In 2006, the no-claim rebate was included in the new health insurance scheme for the entire Dutch population. Some key financial flows within the new health insurance system are highlighted in Figure 1.
Key financial flows in the new health insurance system (2007)

Although there were some experiments with no-claim rebates and bonus options in Switzerland, Germany and by some Dutch private health insurers, these experiments were on a very small scale and typically short-lived (Zweifel, Reference Zweifel1987, Groenewegen and De Jong, Reference Groenewegen and de Jong2004). Internationally, the introduction of a mandatory no-claim rebate in a social health insurance scheme for an entire population is unprecedented.
The central aim of this article is to examine the effects of the no-claim rebate on health care utilization, and to investigate people’s knowledge of, and their attitude and sensitivity towards the no-claim rebate scheme. We first discuss the prior expectations about the scheme and the available evaluative studies regarding effects of the no-claim rebate. Next, we present and discuss the results of a survey we conducted among a convenience sample of the Dutch population. Finally, we discuss the implications of our findings.
At the time of writing, one may consider this article as reporting on a failed social experiment in the Dutch health care sector, since the new Dutch government has decided to replace the no-claim rebate with a traditional, mandatory deductible of ₠ 150 in 2008. This decision has much to do with the experiences of the no-claim rebate. Hence, the Dutch experience may be of interest to other countries considering innovative methods of demand-side cost sharing as a means to contain health care expenditure.
The no-claim rebate
The no-claim rebate differs in important ways from traditional cost-sharing methods, such as co-payments, coinsurance, and deductibles. First, traditional cost-sharing methods involve a direct financial threshold for the insured, whereas the no-claim rebate does not. At the point of consumption, care is still free of charge. Second, cost sharing is a negative incentive (one has to pay), while the no-claim rebate is a positive one (one may receive something back). Third, unlike many user fee schemes involving immediate payment, the incentive of the no-claim was delayed. The insured did not receive their rebate until several months into the next year, after (most of) the annual medical claims were processed.Footnote 1
Predicted effects before introduction
Before the introduction of the no-claim rebate, the financial effects of the scheme were projected by the Netherlands Bureau for Economic Policy Analysis (CPB). Since the behavioural effects of a no-claim rebate were unknown, the impact on health care costs was assumed to be equal to that of a similar deductible. Under that strong assumption, the no-claim rebate was projected to result in a cost reduction of ₠ 200 million per year (CPB, 2004), which would amount to about 1% of the relevant expenditures.Footnote 2 Given the above-mentioned differences between the no-claim rebate and a traditional deductible, this assumption is likely to produce an overestimation of potential cost savings. The features of the no-claim rebate, such as the weak link between usage and payment, the strongly delayed incentives and the fact that people react more strongly to potential losses (deductibles) than to profits (no-claim rebates), are likely to diminish its effectiveness of reducing health care consumption (Kahneman and Tversky, Reference Kahneman and Tversky1979; Schut, Reference Schut and van de Ven2004; Baarsma et al., Reference Baarsma, deGroot and Kok2004).
The political compromise of excluding GP-services from the no-claim scheme also reduced its expected impact on health care utilization, since empirical research demonstrates that people are most price sensitive to GP-services and GPs have an important referral function in the Dutch health care system (Van Vliet, Reference Vliet2004).
Finally, some observers pointed at the possibility that the no-claim rebate offers an incentive to postpone care at the end of the year if the rebate is still intact.
In sum, beforehand, the effects of the no-claim rebate on health care utilization were expected to be limited. In the absence of a significant effect on health care costs, its main effects would be a redistribution of wealth from the sick to the healthy, and a shift from public to private expenditure.
First evaluations of the no-claim rebate
Several studies have been performed to evaluate the first effects of the no-claim rebate. In April 2006, just after the payments of the no-claim rebates related to the year 2005 were made, the Netherlands Institute for Health Services Research (NIVEL) performed a study amongst some 1,500 citizens (de Jong et al., Reference De Jong, Verheij and Groenewegen2006; Goudriaan et al., Reference Goudriaan, Bartelings, Thio and Snijders2006). The results indicated that although 88% of the respondents were familiar with the no-claim rebate, only 3% indicated that they had used less care because of the no-claim rebate. They reduced the number of visits both to GPs and to medical specialists, which is remarkable given that the GP visits were excluded from the no-claim rebate. A possible explanation for this is that patients reduced their visits to the GP in order to avoid follow-up costs. An alternative explanation, however, is that consumers were not sufficiently informed about the details of the scheme. Indeed, Goudriaan et al. (2006) found that despite the fact that people reported that they were familiar with the no-claim rebate, they lacked detailed knowledge. Only 58% of respondents knew that GPs were excluded from the no-claim rebate, and less than one-third (27%) appeared to be well informed about which care items were included in or excluded from the no-claim rebate. Another interesting finding was that, while respondents indicated that they would not reduce their own care utilization because of the no-claim, they did expect that others would use less care to keep the no-claim rebate intact (de Jong, Reference De Jong, Verheij and Groenewegen2006).
Another study, amongst physicians, showed that 25% of physicians had encountered patients who, because of financial concerns, did not want to be referred (Wijlick and de Rond, Reference Wijlick and de Rond2006). However, since the number of patients per physician with such concerns was generally very small (i.e. less than five), the impact on health care utilization was likely to be small too.
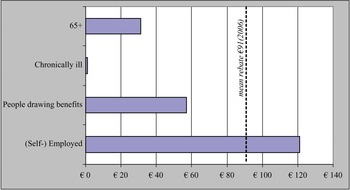
The distributional effects of the no-claim rebate were calculated by Vektis (2006), the statistical bureau of the Dutch health insurers and are depicted in Figure 2.
Average no-claim rebate refunds over 2006

As shown in Figure 2 the average no-claim rebate refund in 2007 (concerning the year 2006) was ₠ 91. For the (self-)employed the average refund was ₠ 117, for those using any health care the average rebate was about ₠ 60, for the elderly the refund was only about ₠ 30, while for the chronically ill the refund was negligible (₠ 1). As expected, the scheme involved a transfer of money from the sick to the healthy. The government stressed that this transfer should be evaluated in relation to the overall solidarity of the health care system (Ministry of Health, 2006b). The average health care expenditure for the most expensive 10% of users is ₠ 15,500 per year, while if they pay an average total premium, they contribute ‘only’ some ₠ 2,200.Footnote 3 This group therefore ‘receives’ ₠ 13,200 as a solidarity contribution. Healthy citizens who do not use care on average pay a premium of ₠ 2,200 and receive ₠ 255 as a no-claim rebate, which means they pay a ₠ 1,945 solidarity contribution. The government also pointed out that from an international perspective the total share of out-of-pocket expenses in the Netherlands is relatively low, about 11% (Ministry of Health, 2006b).
The final evaluation of the no-claim scheme was published in September 2007 (Goudriaan et al., Reference Goudriaan, Bartelings, Thio and Snijders2007), largely repeating the previous study by Goudriaan et al. (2006). In addition, this study investigated in more detail the effects on real behaviour by studying claims data. It concluded that knowledge regarding the no-claim scheme had not improved. As in the previous study, still only 58% of respondents were aware that GP visits were not included in the no-claim scheme. Some 5% of respondents indicated that they had reduced care consumption due to the no-claim rebate, which share was twice as high as in the previous study (2.6%). Goudriaan et al. (2007) attributed this increase to a learning effect amongst the previously socially insured and the fact that the previously privately insured were used to voluntary deductibles and therefore probably were more aware of and familiar with such financial incentives. Almost 70% of the GPs that responded to the survey did not expect the no-claim to reduce health care consumption, but still almost one in four GPs indicated to fear that it would lead to a reduction in or postponement of necessary care. Due to a lot of other disturbing factors, Goudriaan et al. (2007) were not able to establish a causal relationship between changes in consumption and the no-claim rebate.
Methods and data
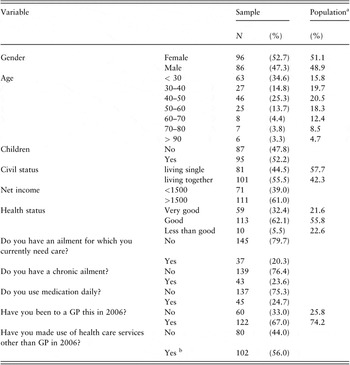
In the second half of 2006 we conducted a survey among the Dutch general public to investigate their (i) knowledge, (ii) attitude, and (iii) sensitivity to the no-claim rebate scheme. For this explorative study, we used a convenience sample stratified according to gender, age, civil status, children, and income. The respondents were recruited in the Rotterdam area in several public places, including a sports club and the university campus, which may involve some selection bias. A total of 182 respondents aged between 18 and 91 participated in the study out of some 300 respondents approached (see Table 1). As shown in Table 1, compared to the general Dutch population the sample is relatively young and healthy. In addition, our recruitment strategy may also have resulted in some self-selection bias, for instance if people who were willing to participate in the survey were more interested in the no-claim rebate or health insurance than other people with similar characteristics as reported in Table 1.
Sample characteristics (n =182)

Notes:
a source www.cbs.nl; statistics for population aged 20+; only available statistics with similar definition shown.
b hospital care: 8 (4.4); outpatient care: 27 (14.8); specialist: 41 (22.5); physiotherapy: 32 (17.6); diagnostic tests: 27 (14.8); prescribed medication: 43 (23.6).
Respondents were asked to report both on actual behaviour to examine revealed preferences and to react to hypothetical scenarios to elicit stated preferences. The main aim of this study, however, is to examine the stated preferences.
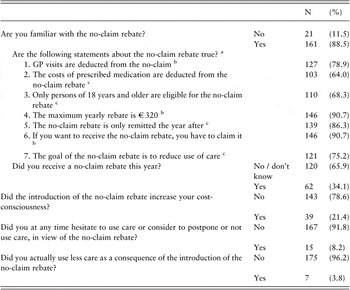
First, knowledge of the no-claim rebate scheme was assessed by asking respondents whether they knew about the introduction of the no-claim rebate and, if they did, presenting them with seven statements about the scheme, which they were asked to evaluate as true or false (see Table 2).
Knowledge of and experience with the no-claim rebate (n = 182)

Notes:
a only asked to respondents who indicated they were familiar with the no-claim rebate; numbers of respondents with correct answer (and proportion of sub-sample); mean proportion was 79.2% correct.
b false.
c true.
These questions were used to construct a knowledge scale (n = 182; Cronbach’s α: 0.63, which is considered adequate for the purpose of our study). Respondents who did not know the rebate had been introduced (n = 21; 11.5%), or indicated they knew about it yet scored all seven follow-up statements wrong (n = 4; 2.5%) received a knowledge score of 0; those who knew about the introduction of the rebate and scored all seven statements correct (n = 32; 19.9%) received a knowledge score of 7. The mean (SD) knowledge score was 4.5 (2.2).
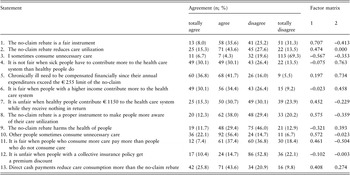
Second, respondents’ attitude toward the no-claim rebate policy was assessed using 13 statements regarding its features in terms of effectiveness and fairness (see Table 3). Respondents were asked to indicate their agreement on a 4-level Likert-type scale, ranging from ‘totally agree’ to ‘totally disagree’. Factor analysisFootnote 4 was applied to analyze whether dominant attitudes towards the no-claim existed.
Attitudes towards the no-claim rebate policy (n = 163)

Notes:
a KMO sampling adequacy: 0.659. Explained variance: 36.4
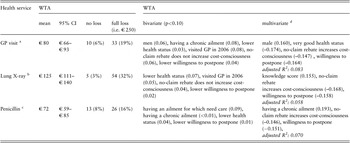
Third, sensitivity to the no-claim rebate policy was assessed in terms of individuals’ willingness to accept (WTA) a loss in rebate for the use of certain health care services (GP visits, lung X-rays, and penicillin), and their willingness to postpone (WTPP) care consumption until the next year in order to keep the no-claim rebate of the current year intact (Wijlick and de Rond, Reference Wijlick and de Rond2006; Goudriaan et al., Reference Goudriaan, Bartelings, Thio and Snijders2006, Reference Goudriaan, Lalloesingh and Vemer2007). WTA was assessed by presenting respondents with three consecutive scenario’s (see Table 4).
Willingness to accept (WTA) reduction in no-claim rebate for specified health services (n = 167)

Notes:
a Suppose a GP visit was deducted from your no-claim rebate, and you had a fever and a bad cough. You suspect it possibly is bronchitis that could best be treated with a course of penicillin, but it could also be an ordinary flu. In this case, what size of deduction from your no-claim rebate would you surely accept and still visit the GP?
b Suppose you went to the GP and you get the advice to visit a medical specialist to make a lung X-ray, in order to exclude some severe disorders. In this case, what size of deduction from your no-claim rebate would you surely accept and still have the lung X-ray made?
c As under note a. But now suppose your GP also prescribes you a course of penicillin. Although he expects you will recover from your complaints (fever, cough) also without treatment, with the penicillin you will recover five days sooner. In this case, what size of deduction from your no-claim rebate would you surely accept to get the course of penicillin?
d linear regression (stepwise; in 0.10/ out 0.15); standardized coefficients presented in table.
Respondents were asked to indicate what size of deduction from their no-claim rebate they would surely accept in the hypothetical situation, using a payment scale (monetary values: ₠ 0–₠ 5–₠ 10–₠ 20–₠ 30–₠ 50–₠ 75–₠ 100–₠ 150–₠ 200–₠ 250). Payment scales have been shown to be more valid than open-ended formats, because of higher completion rates and less zero values (Donaldson et al., Reference Donaldson, Thomas and Torgerson1997; Whynes et al., Reference Whynes, Frew and Wolstenholme2003).
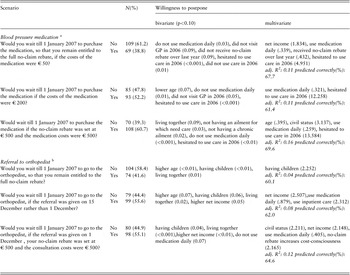
Finally, to examine people’s willingness to postpone (WTPP) care near the end of the year, we included two scenarios in the questionnaire, one involving blood pressure medication and the other about a visit to an orthopedist. In each of the two scenario’s respondents were faced with three different cases for which they had to decide whether they would be willing to postpone health care consumption for two weeks or a month until 1 January of the next year in order to keep their entitlement to the full no-claim rebate over the current year (see Table 5).
Willingness to postpone health care consumption (n = 178)

Notes:
a Suppose it is 15 December 2006 and that you are still entitled to the full no-claim rebate. You have just visited your GP. The GP diagnosed high blood pressure and prescribed medication. The high blood pressure poses no direct threat to your health. The medication costs ₠ 50, which will be deducted from your no-claim rebate.
b Suppose it is 1 December 2006 and that you are still entitled to the full no-claim rebate. Your have pain in your knee when walking, you experience difficulties with mobility. You have just visited your GP. The GP thinks it might be arthritis, and referred you to an orthopedist. A consultation with the orthopedist will cost you your full no-claim rebate (₠ 255).
c logistic regression (stepwise; in 0.10/ out 0.15); standardized coefficients presented in table.
The six cases were used to construct a willingness to postpone scale (n = 177; Cronbach’s α: 0.85). About 25% of the sample (46 respondents) were unwilling to postpone health care consumption in all six cases, leading to a score of 0; about 20% of the sample (35 respondents) indicated they would be willing to postpone in all six cases, leading to a score of 6. Mean score was 3.1.
We analyze both the WTPP and the WTA, as well as the relationship between the two.
Results
Knowledge
The results with respect to the knowledge about the no-claim rebate are reported in Table 2. Relative to previous studies, the general knowledge of the scheme was better in our sample. Most statements were scored correctly by more than 75% of the respondents and almost half (46%) of the sample answered at least six out of seven statements correctly. Statistically significant higher knowledge scores were observed for respondents with higher net income (5.1 vs. 3.7; p<0.001), who had received a no-claim rebate over the previous year (5.4 vs. 4.1; p<0.001) and those who were not in favour of the no-claim rebate (5.1 vs. 4.3; p = 0.017). Multivariate analysis showed that having a chronic ailment, higher net income, having received a no-claim rebate over the previous year, and not being in favour of the no-claim rebate were associated with higher knowledge scores (adj. R2 = 0.19). Note that higher net income may be a proxy for a higher level of education here. Given that the healthy are overrepresented in our sample, this may have lowered the proportion of well-informed people compared to the general population. It must be noted that the methods of recruitment and location of respondents may also have biased our results.
Attitude
Table 3 provides an overview of how our sample responded to the different attitude statements regarding the no-claim. As can be seen, about half of the respondents do not consider the no-claim to be fair. Likewise, a majority of the respondents rejects the idea that the chronically ill have to pay more than healthy people and agree that higher income groups have to pay more for health care. In line with a previous study (De Jong et al., Reference De Jong, Verheij and Groenewegen2006), respondents indicate that they themselves do not use unnecessary care but expect that others do. Analyzing these responses using factor analysis revealed two main types of attitudes towards the no-claim rebate. People with the first type of attitude (48.5% of the sample) perceived the no-claim rebate to be unfair and ineffective in increasing cost-consciousness or in reducing use of care. They held the opinion that payment for care should not be related to care use, thought that people are unlikely to use unnecessary care, and did not feel that healthy people are more entitled to a rebate. These people tended to be against the no-claim rebate. By contrast, people with the second type of attitude (51.5% of the sample) perceived the no-claim rebate to be a fair policy. They held the opinion that the rich should not necessarily pay more for health care than the poor, did not consider it to be unfair that unhealthy people have higher costs than healthy people, did not feel people with a chronic ailment should be compensated for the fact that they always lose out on their rebate, and did not expect the no-claim rebate to lead to negative health effects. These people tended to be in favour of the no-claim rebate. Being in favour of the no-claim rebate (people of type 2) was associated with lower age (p<0.001), not having children (p<0.001), currently not having an ailment for which care is needed (p = 0.009), not having a chronic ailment (p = 0.013), higher health status (p = 0.004), and lower knowledge of the no-claim rebate (p = 0.017). Since our sample consists of an overrepresentation of young and healthy people, the proportion in the general population that would consider the no-claim rebate as being unfair is likely to be larger than in our sample. On the other hand, there may also be a self-selection effect in the opposite direction if people who perceive the no-claim as unfair were more inclined to participate in our survey.
Sensitivity
Regarding sensitivity, respondents elicited sizeable mean WTA values (see Table 4). In all three scenarios the number of respondents who would consume the health service even if this meant they would lose the full no-claim rebate at once is much larger than the number of respondents who were unwilling to accept any loss, implying that the no-claim rebate would not constrain their demand at all. Table 4 also shows bivariate and multivariate associations with WTA: for instance, respondents who indicated that the introduction of the no-claim rebate increased their cost-consciousness elicited a lower WTA, as did respondents who were more willing to postpone health care consumption until after 1 January in order to maintain their rebate.
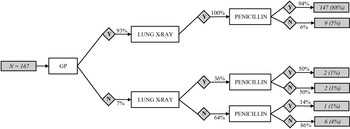
As depicted in Figure 3, 88% of respondents was willing to accept a reduction in their rebate for all three services (GP visits, lung X-rays, and penicillin), with mean WTA of ₠ 86, ₠ 131, and ₠ 78 respectively. Correlation coefficients between the three WTA values ranged between 0.61 and 0.76. Only a small group (4%) was not willing to accept any deduction from their rebate.
Health services use at cost of no-claim rebate

Finally, we found evidence of a substantial willingness to postpone care consumption up to a month. As shown in Table 5, WTPP tends to increase with the absolute and relative size of the no-claim rebate loss and if the postponement reduces from one month to two weeks. In the case of blood pressure medication, many variables were associated with willingness to postpone care consumption, but especially individuals who indicated reluctance to use care because of the rebate were substantially more willing to postpone care. In the case of referral to an orthopedist, individual characteristics like civil status, having children, and income were more prominent.Footnote 5
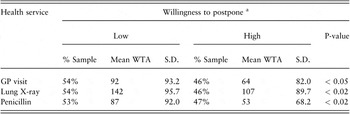
Table 6 provides insight in the relationship between WTPP and WTA. One would expect people with a higher willingness to postpone care also to be less willing to accept decreases in the no-claim rebate, thus leading to a lower WTA. Table 6 shows that this relationship indeed exists: a higher willingness to postpone is associated with a significantly lower willingness to accept decreases in the no-claim rebate.
Willingness to accept (WTA) according to willingness to postpone (n = 167)

Notes:
a Willingness to postpone was defined as being low if a respondent opted to postpone in no more than three of the six scenarios presented in Table 5 and as being high otherwise.
Discussion
The no-claim scheme was proposed by the government as a friendly alternative to traditional cost sharing in an attempt to increase the cost awareness among buyers while relaxing constraints on supply and prices. First projections of the behavioural effects were favourable (CPB, 2004), but based on unrealistic assumptions. Already before the actual introduction of the scheme, there were serious doubts about its potential effectiveness in containing costs (Schut, Reference Schut and van de Ven2004). The first evaluations showed that while some patients may have reacted by restricting the use of health services, this number was very small and no real evidence of reduced consumption was found. Moreover, many people appeared to be poorly informed about the details of the scheme. Therefore, the most prominent effect of the no-claim rebate was a redistributional effect, involving a transfer of money from the sick to the healthy.
Our study sheds some more light on the effects of the no-claim. Using a questionnaire, we investigated (i) people’s knowledge, (ii) people’s attitude, and (iii) people’s sensitivity to the no-claim rebate scheme, including postponement behaviour.
Regarding knowledge, the majority (88%) of our respondents indicated that they were familiar with the no-claim rebate, similar to the 89% and 87% reported in the studies by Goudriaan et al. (2006, 2007). As in the previous studies (de Jong, Reference De Jong, Verheij and Groenewegen2006; Goudriaan et al., Reference Goudriaan, Bartelings, Thio and Snijders2006, Reference Goudriaan, Lalloesingh and Vemer2007), however, knowledge regarding the details of the scheme was imperfect. Nevertheless, 46% of respondents answered at least six out of seven statements correctly. This percentage is higher than those in the evaluations by Goudriaan et al. (2006, 2007). This may be partly explained by differences in the statements and partly by differences in the sample.
Regarding attitude, it is clear that people were divided about the fairness of the no-claim rebate. About half of the respondents considered the instrument to be unfair, although most respondents (78.5%) agreed that other people sometimes consume unnecessary care (whereas only 11% agreed with the statement that they themselves occasionally consume unnecessary care). Almost 80% of respondents indicated that they expected that people would be more sensitive to direct payments than to the no-claim rebate.
Regarding sensitivity, we found a substantial willingness to accept (WTA) a reduction of the no-claim rebate for obtaining various types of health care. Our results may even underestimate the true WTA, because a significant number of people indicated that they would accept the highest value on the presented payment scale (₠ 250). This holds particularly for the lung X-ray, where 58 respondents (32%) chose the highest presented value. The high willingness to accept a reduction of the no-claim rebate indicates that people were not very sensitive to this type of financial incentive to reduce consumption. This conclusion is also supported by the fact that about 70% of the respondents agreed with the proposition that direct cash payments would result in a larger reduction of care consumption than the no-claim rebate (see Table 3). Only 4% of the respondents indicated not to accept a lower rebate in any case (see Figure 3) – similar to the 3% and 5% reported previously (Goudriaan et al., Reference Goudriaan, Bartelings, Thio and Snijders2006; Reference Goudriaan, Lalloesingh and Vemer2007). In the three presented scenarios on average 22% of the respondents (19% in GP visit scenario, 32% in Lung X-ray scenario, and 16% in Penicillin scenario; see Table 4) indicated that they were willing to accept a loss of ₠ 250 (about the maximum no-claim rebate), implying that the no-claim rebate would not constrain their demand at all.
Regarding postponement behaviour, we found that a substantial proportion (about 60%) of the respondents were willing to postpone care for at least two weeks if that could leave their current rebate intact, and that a higher WTPP was consistently associated with a lower WTA. The fact that many people had both substantial WTA and WTPP values, suggests that people are much more prepared to delay than to reduce health care consumption. It should be noted, however, that the WTPP may be overstated because a decision to postpone utilization in a hypothetical situation is easier than when one is actually sick or suffering (Carlsson and Martinsson, Reference Carlsson and Martinsson2003; Marka and Swait, Reference Marka and Swait2004). Moreover, the WTPP may also be biased by the possibility that in the hypothetical scenarios people received more information than they may in practice, making the trade-off between refund and care use clearer and more explicit than in practice.
Finally, we would like to point to some limitations of our study. First, like the only comparable previous study, we had to use hypothetical scenarios and people’s own retrospective perceptions regarding health care consumption. Since the no-claim rebate was mandatory, we could not infer the effectiveness of the no-claim from data about actual health care utilization, since a control group without entitlement to a no-claim rebate was lacking. Moreover, we used only a limited number of hypothetical scenarios. Using more scenarios (for instance in a discrete choice experiment) would have produced additional information. Second, the way we framed the study, the scenarios and questions may have influenced answers. For example, whether the payment scale adequately reflects decision making under the no-claim scheme may be questioned, particularly if people base their answers on expected future health care consumption. A third limitation is the use of a relatively small convenience sample that is not entirely representative for the general population and for which we cannot rule out potential selection bias. All these aspects hamper the generalizability of our results. Nonetheless, our results are quite similar to comparable findings of a previous study (de Jong et al., Reference De Jong, Verheij and Groenewegen2006).
Concluding remarks
Our findings indicate that the no-claim rebate provided only a very weak incentive to reduce care consumption. The main effect, therefore, was a redistribution from the sick to the healthy, which is perceived by many people as unfair. Moreover, our study shows a potential danger of strategic postponement of care, which may have adverse health effects. In sum, for society the no-claim rebate resulted in some pain, but no gain.
In 2007 the Dutch government, faced with rising costs in health care and the ineffectiveness of the no-claim rebate policy, decided to replace it with a mandatory deductible of ₠ 150 per year in 2008 (Ministry of Health, 2007). Politically, the replacement of the no-claim rebate with a mandatory deductible was attractive and did not encounter strong opposition because the immediate effect was a reduction in health insurance premiums. This is because the surcharge on the premium to finance the no-claim rebate could be replaced by a discount on the premium due to higher (future) out-of-pocket payments. Although the net effect on total payments was the same, in the short run people only experienced a reduction of their health insurance premium. Moreover, to mitigate unfavourable redistributional effects, the government decided to compensate the chronically ill for the expected additional expenses (₠ 40 per year) relative to an average non-chronically ill individual. These compensatory payments, however, are likely to increase the administrative costs of the new scheme. In addition, the savings related to the deductible are likely to be small because, again, GP services are excluded from the proposed deductible scheme. So, just as in the case of the no-claim rebate, by trying to avoid any pain the new deductible scheme is unlikely to generate any substantial gain.