


Introduction
Microsporidia are ubiquitous fungi-related, obligate intracellular parasites that evolved with extremely reduced genomes and proteomes to become highly dependent upon the host cell biochemistry (Peyretaillade et al., Reference Peyretaillade, El Alaoui, Diogon, Polonais, Parisot, Biron, Peyret and Delbac2011; Cuomo et al., Reference Cuomo, Desjardins, Bakowski, Goldberg, Ma, Becnel, Didier, Fan, Heiman, Levin, Young, Zeng and Troemel2012). This host cell dependency has been highlighted by the ability of several microsporidia species that secrete factors and appropriate host cell metabolism in favour of their infection and replication (Cuomo et al., Reference Cuomo, Desjardins, Bakowski, Goldberg, Ma, Becnel, Didier, Fan, Heiman, Levin, Young, Zeng and Troemel2012; Heinz et al., Reference Heinz, Hacker, Dean, Mifsud, Goldberg, Williams, Nakjang, Gregory, Hirt, Lucocq, Kunji and Embley2014; Panek et al., Reference Panek, El Alaoui, Mone, Urbach, Demettre, Texier, Brun, Zanzoni, Peyretaillade, Parisot, Lerat, Peyret, Delbac and Biron2014; Senderskiy et al., Reference Senderskiy, Timofeev, Seliverstova, Pavlova and Dolgikh2014; He et al., Reference He, Fu, Li, Liu, Cai, Man and Lu2015; Luallen et al., Reference Luallen, Bakowski and Troemel2015; Watson et al., Reference Watson, Williams, Williams, Moore, Hirt and Embley2015; Wiredu Boakye et al., Reference Wiredu Boakye, Jaroenlak, Prachumwat, Williams, Bateman, Itsathitphaisarn, Sritunyalucksana, Paszkiewicz, Moore, Stentiford and Williams2017; Ferguson and Lucocq, Reference Ferguson and Lucocq2018). In addition, microsporidia can induce cell hypertrophy, giant cell formation and increase lifespan of infected cells (Leitch et al., Reference Leitch, Shaw, Colden-Stanfield, Scanlon and Visvesvara2005; Aoki Mdel et al., Reference Aoki Mdel, Cano, Pellegrini, Tanos, Guinazu, Coso and Gea2006; Stentiford et al., Reference Stentiford, Bateman, Feist, Oyarzun, Uribe, Palacios and Stone2014; Desjardins et al., Reference Desjardins, Sanscrainte, Goldberg, Heiman, Young, Zeng, Madhani, Becnel and Cuomo2015; Timofeev et al., Reference Timofeev, Tokarev, Simakova, Tsarev and Dolgikh2016).
Apoptosis of infected cells is a universal mechanism used by the host to eliminate pathogens and facilitate the release of pathogen antigens to then promote adaptive humoral and cell-mediated immune responses in mammals (Liu et al., Reference Liu, Deng, Lancto, Abrahamsen, Rutherford and Enomoto2009). Signalling pathways involved in regulating the host cell cycle and apoptosis however also are primary targets of intracellular prokaryotic and eukaryotic parasites for subverting innate immune responses (Luder et al., Reference Luder, Gross and Lopes2001; Hay and Kannourakis, Reference Hay and Kannourakis2002; James and Green, Reference James and Green2004; Faherty and Maurelli, Reference Faherty and Maurelli2008; Huang et al., Reference Huang, Chen, Wang, Cheng and Evans2016). A number of intracellular parasites, including several species of microsporidia, have evolved means to subvert apoptosis mechanisms to maintain or prolong infection (Scanlon et al., Reference Scanlon, Leitch, Shaw, Moura and Visvesvara1999; James and Green, Reference James and Green2004; del Aguila et al., Reference del Aguila, Izquierdo, Granja, Hurtado, Fenoy, Fresno and Revilla2006). For example, Anncaliia algerae inhibited induced apoptosis in human lung fibroblasts (Scanlon et al., Reference Scanlon, Leitch, Shaw, Moura and Visvesvara1999) and infection with Encephalitozoon spp. disrupted the host cell cycle of Vero cells (Scanlon et al., Reference Scanlon, Shaw, Zhou, Visvesvara and Leitch2000). Encephalitozoon cuniculi also suppressed induced apoptosis in Vero cells and modulated the host cell cycle via inhibiting tumour suppressor factor p53 (del Aguila et al., Reference del Aguila, Izquierdo, Granja, Hurtado, Fenoy, Fresno and Revilla2006). V ittaforma corneae induced formation of multinucleated xenoma-like structures during infection of monkey kidney cells (Leitch et al., Reference Leitch, Shaw, Colden-Stanfield, Scanlon and Visvesvara2005) and Nosema bombycis suppressed apoptosis in a Bombix mori ovarian cell line (He et al., Reference He, Fu, Li, Liu, Cai, Man and Lu2015). Furthermore, Nosema ceranae and Nosema apis can modulate the host cycle and suppress apoptosis of the ventricular epithelium cells of Apis melifera (Higes et al., Reference Higes, Juarranz, Dias-Almeida, Lucena, Botias, Meana, Garcia-Palencia and Martin-Hernandez2013; Kurze et al., Reference Kurze, Le Conte, Dussaubat, Erler, Kryger, Lewkowski, Muller, Widder and Moritz2015, Reference Kurze, Dosselli, Grassl, Le Conte, Kryger, Baer and Moritz2016; Huang et al., Reference Huang, Chen, Wang, Cheng and Evans2016; Martin-Hernandez et al., Reference Martin-Hernandez, Higes, Sagastume, Juarranz, Dias-Almeida, Budge, Meana and Boonham2017).
Macrophages are key cells in the innate immune system of vertebrates and invertebrates and comprise the first line of defence against intracellular parasites for then transitioning to adaptive immune response in higher vertebrates. Macrophages can kill microsporidia via activation signalling processes yet also serve as host cells of infection for several species of microsporidia. Among these are the Encephalitozoon species, i.e. E. cuniculi, E. hellem and E. intestinalis, as well as V. corneae, species that infect mammals, including humans, and that can be grown in tissue culture. Encephalitozoon spp. replicate within host cell-derived parasitophorous vacuoles (PVs) while V. corneae replicates in direct contact with the host cell cytoplasm. Based on the earlier reports that microsporidia affect the host cell machinery and apoptosis pathways, the purpose of this study was to examine the effects of these two biologically dissimilar human-infecting microsporidia, E. cuniculi and V. corneae, on staurosporine-induced apoptosis in the human macrophage-differentiated cell line, THP-1. The results demonstrated that viable microsporidia, but not heat-killed organisms, inhibited apoptosis of the THP-1 macrophages.
Materials and methods
Macrophage cell line and microsporidia
Human monocytic leukaemia THP-1 cells (ATCC TIB-202; American Type Culture Collection, Manassas, VA) were grown in RPMI 1640 (Mediatech Inc., Herndon, VA, USA) supplemented with 10% fetal bovine serum, 2 mm L-glutamine and antibiotics (100 units penicillin mL−1, 100 µg streptomycin mL−1) referred to as RPMI complete medium. Culture and cryopreservation methods were performed per instructions provided by ATCC (https://www.atcc.org/Products/All/TIB-202.aspx#culturemethod). Encephalitozoon cuniculi organisms (originally isolated from rabbit; ATCC #50503), and V. corneae (originally isolated from human; ATCC #50505) were grown in RK-13 rabbit kidney epithelial cells (ATCC #CCL-37) in RPMI complete medium. Medium was exchanged at least twice per week and culture supernatants containing released microsporidia spores were stored in sterile flasks at 4 °C until use within 1 month of collection.
Microsporidia spores were enriched from host cell debris as described previously (Didier et al., Reference Didier, Bowers, Martin, Kuroda, Khan and Didier2010). Culture supernatants were transferred to tubes, centrifuged (400 × g 10 min at 4 °C), and washed sequentially by centrifugation in sterile solutions of dH2O, 0.3% Tween 20 in tris-buffered saline (TBS), and TBS. The pellets were resuspended in TBS, mixed with an equal volume of 100% Percoll (to achieve a final 50% Percoll vol/vol suspension), and centrifuged for 45 min at 500 × g. The pellets containing spores were washed again with TBS and suspended to the desired concentration. Suspensions of dead spores were prepared by boiling live spores for 15 min. Spore concentrations were determined by haemocytometer counting via phase contrast optics at 400 × final magnification.
Infection of THP-1 cell and induction of apoptosis
THP-1 cells were plated at 4 × 10⁶ cells per mL in six- or 24-well plates for performing the caspase 3 fluorometric assay or in eight-well chamber slides (Nalge Nunc International, Naperville, IL, USA) for the TUNEL assay. Live or dead microsporidia spores were added to wells at a parasite to host cell ratio of 3:1. Thirty minutes later, the cultures were treated with 40–80 nm (25–50 ng mL−1) phorbol 12-myristate 13-acetate (PMA) (Sigma-Aldrich, St. Louis, MO, USA) and incubated for 24 h to differentiate the THP-1 cells to adherent macrophages. The cell cultures then were washed three times to remove PMA and fresh complete RPMI medium was added. Apoptosis was experimentally induced by treatment with 1 um (50 ng mL−1) of staurosporine (Sigma-Aldrich) at various times (as indicated in the results section).
Caspase 3 fluorometric assay
At 1, 2, 4 or 8 days after exposure to microsporidia and 4–6 h after induction of apoptosis, cells were subjected to lysis buffer [250 mm HEPES, pH 7.4, 25 mm 3-((3-cholamidopropyl)dimethylammonio)-1-propanesulfonate (CHAPS), 25 mm dithiothreitol (DTT); Sigma-Aldrich]. Lysates were collected in microtubes for storage at −70 °C until use. Caspase 3 activity was measured according the manufacturer instructions using the 96-well plate Caspase 3 fluorometric assay kit (Sigma-Aldrich) based on the hydrolysis of the peptide substrate Acetyl-Asp-Glu-Val-Asp-amido-4 methylcoumarin and cleavage of the fluorescent 7-amino-4-methylcoumarin (AMC). Optical density of the AMC cleavage product was quantified by a SPECTRAmaxM2 microplate reader and calculated as fluorescence units per milligram of protein per millilitre lysate from the standard curve. Protein concentrations in the analysed samples were measured by the Micro BCA Protein Assay Kit (Thermo Scientific, Rockford, IL, USA).
DeadEnd colorimetric and fluorometric TUNEL assays
Apoptosis was also measured via in situ terminal deoxynucleotidyltransferase-mediated dUTP nick end-labelling (TUNEL). Cultures of macrophages were grown in chamber slides, exposed to live or dead microsporidia, and induced for apoptosis at the same times points described for Caspase 3 assays. The cells were then fixed with 4% paraformaldehyde, permeabilized for 30 min with 0.2% Triton X-100 (Sigma-Aldrich), and assayed using either the DeadEnd Colorimetric TUNEL System (Promega, Madison, WI, USA) or the In Situ Cell Death Detection kit (TMR-red; Roche, Indianapolis, IN, USA). In the DeadEnd assay, biotinylated nucleotides incorporated at the 3′-OH DNA ends were labelled by Streptavidin-HRP and detected using peroxidase substrate, hydrogen peroxide and diaminobenzidine (DAB) for visualization of dark brown apoptotic nuclei. DAB-stained slides were mounted using Permount mounting medium (Fisher Scientific, Fai Lawn, NJ, USA) and observed using a Leica (NNN) light microscope at 400×. Five fields of view per well (variant) were imaged using a digital SPOT camera attached to the microscope, and the numbers of TUNEL-positive cells relative to the total number of cell nuclei were determined. In the fluorometric TUNEL assay, nucleotides were conjugated to the TMR-red fluorescent stain allowing for direct detection of DNA strand breaks characteristic of apoptotic nuclei using fluorescent microscopy in the red range of the spectrum (with a maximum of 580 nm). TMR-red-stained cells were retained on chamber slides in TBS at 4 °C until further staining. Three independent sets of experiments were analysed by each detection assay.
Immunofluorescent antibody staining and confocal microscopy imaging to detect microsporidia infection and host cell apoptosis
Immunofluorescent antibody (IFA) was performed to ascertain and detect intracellular development of microsporidia in relation to staurosporine induction of apoptosis in individual THP-1 cells. The TMR-red-stained cells were blocked in 0.2% v/v fish skin gelatin (FSG; Sigma-Aldrich) in TBS for 30 min and then incubated in 10% normal goat serum (NGS; GIBCO) for 40–60 min at room temperature. A rabbit polyclonal antiserum raised against a combination of microsporidia species (E. cuniculi, E. intestinalis, E. hellem and V. corneae) was diluted 1:200 in 10% NGS, centrifuged and applied to experimental wells for incubation for 60 min at room temperature or overnight at 4 °C. The slides were washed sequentially in TBS containing 0.2% cold water FSG (Sigma-Aldrich) and then TBS containing 0.1% Triton X-100. The cells on slides were then incubated with Alexa 488 (Molecular Probes, Eugene, OR, USA)-conjugated goat-anti-rabbit IgG diluted 1:1000 in 10% NGS for 60 min at room temperature. Slides were then rinsed with TBS and counterstained with To-Pro-3 (far red) fluorescent dye (Molecular Probes) to identify host cell nuclei. Slides were examined by inverted confocal laser scanning microscope Leica TCP SP2. Approximately 12–14 optical sections at intervals of 0.3–0.5 µm were recorded for the presence of microsporidia.
Quantitative reverse transcription polymerase chain reaction microarray
Expression of apoptosis pathway-related genes was examined 4 days after exposure to live or dead spores or medium (control) and 4 h after apoptosis induction in THP-1 cells using the RT2 Profiler PCR Array system (SABiosciences, Qiagen, Germantown, MD, USA) per manufacturer's instructions. Briefly, cells were washed three times in TBS, lysed by Tryzol reagent (Invitrogen, Carlsbad, CA, USA) and subjected to Qiagen clean-up columns. Total RNA (1 µg) was used to generate cDNA via incubation with random oligo-hexamers (Invitrogen) and reverse transcription (Superscript III; Invitrogen). Samples were treated with E. coli RNAse H (Invitrogen) for clearance of RNA–DNA helices and quantitative reverse transcription polymerase chain reaction was performed using the Apoptosis RT2 Profiler PCR Array kit (SABiosciences, Qiagen) in a Strategene mx3000 thermocycler for amplification of 84 apoptosis pathway-associated genes in 96-well platform. These included 47 genes that encoded pro-apoptosis proteins, 21 genes that encoded anti-apoptosis proteins, and 15 genes encoding regulatory proteins (that may either trigger or suppress apoptosis). In addition to the ‘Functional gene grouping’ table provided with the Apoptosis RT2 Profiler PCR Array kit (http://www.sabiosciences.com/rt_pcr_product/HTML/PAHS-012A.html), anti- or pro- apoptotic gene functions were also verified using public databases for gene ontology (http://www.genecards.org/; http://www.geneontology.org/). Gene expression levels (E) were considered to be up or downregulated based on at least 2-fold differences over that of control untreated macrophages (i.e. −2 ⩾ ΔE ⩾ + 2, ΔE). Replicate samples were assayed in triplicate and were normalized for expression relative to the housekeeping gene, β-2-microglobulin (one of the five housekeeping genes included in the kit and that was expressed at the same level in the experimental and control samples). Results were analysed using Cluster software version 3 (de Eisen et al., Reference Eisen, Spellman, Brown and Botstein1998; Hoon et al., Reference de Hoon, Imoto, Nolan and Miyano2004) and hierarchical clustering to generate dendrograms was performed with TreeView software version 2 (Saldanha, Reference Saldanha2004). Canonical pathways were examined using Ingenuity Pathway Analysis (Qiagen).
Statistical analysis
Statistical analyses and graphing were performed using Graphpad PRISM 7.01 (GraphPad Software, San Diego, CA, USA, 2003). One-way analysis of variance (ANOVA) with Tukey pairwise post hoc test or unpaired t-test were used for analyses. P < 0.05 was considered statistically significant.
Results
Microsporidia infection of THP-1 macrophages inhibited staurosporine-induced caspase 3 activity
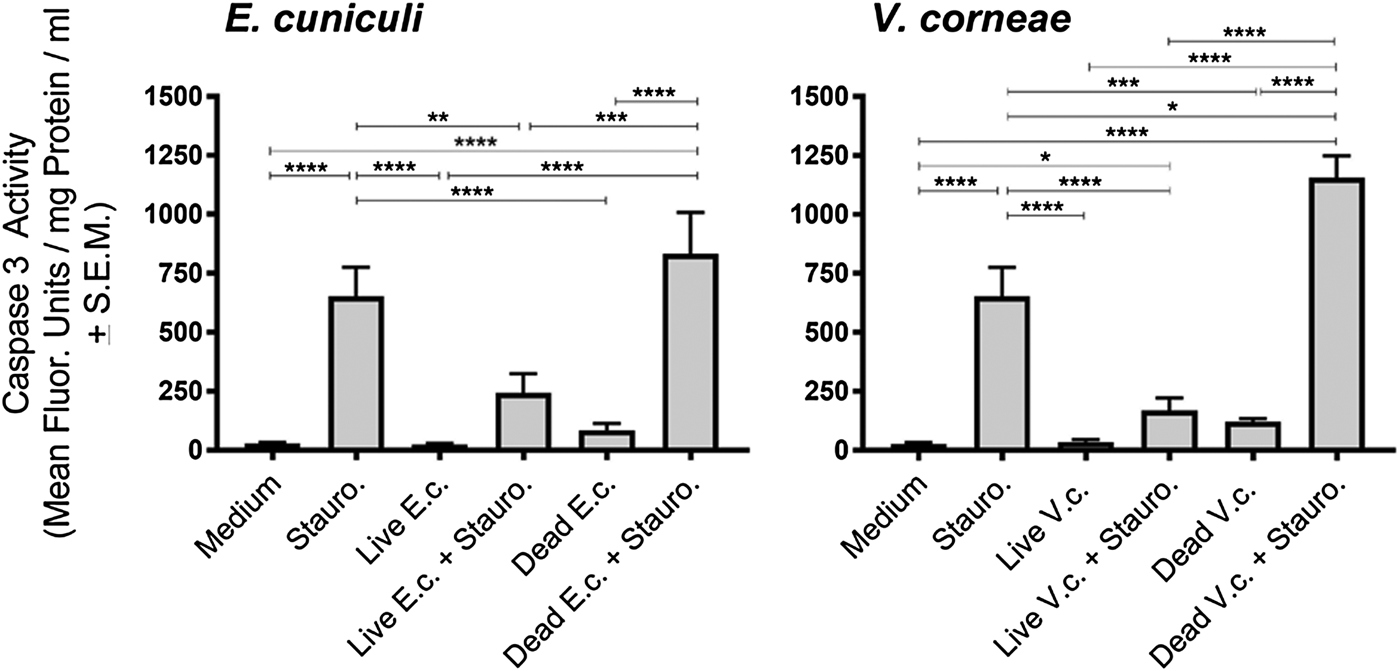
THP-1 macrophages were inoculated with live or dead microsporidia and induced for apoptosis by treatment with staurosporine (or medium as a control) followed by measuring caspase 3 activity (Fig. 1). Results were most consistent for experiments at the 4-day infection time point which may reflect a sufficiently established infection that could be detected prior to cell rupture/leakage and parasite release that would have produced secondary infections. Thus, the results throughout this study were presented after 4 days’ infection. Exposure of THP-1 cells with live or dead spores of E. cuniculi and V. corneae did not independently induce caspase 3 activity. Interestingly, infection of the macrophages with microsporidia (i.e. after exposure to live spores) of both species did significantly inhibit staurosporine-induced caspase 3 activity compared with macrophages not incubated with live microsporidia and induced with staurosporine. Conversely, incubation of THP-1 macrophages with dead V. corneae spores significantly increased staurosporine-induced caspase 3 activity compared with the THP-1 macrophages induced with staurosporine in the absence of microsporidia. Incubation of the macrophages with dead E. cuniculi and then induced with staurosporine also increased caspase 3 activity over the non-microsporidia-treated apoptosis-induced macrophages, but this was not statistically significantly different.
Caspase 3 activity in THP-1 macrophages exposed to E. cuniculi and V. corneae spores. Four days after addition of live or dead E. cuniculi (E.c) or V. corneae (V.c.) spores, cell cultures of THP-1 macrophages were induced for apoptosis by addition of staurosporine (Stauro.). Caspase 3 activity was measured by fluorometry 4 h later. Results represent the means of three experiments with at least three replicates each. ANOVA was performed as was significant for E.c. and V.c. experiments (P < 0.0001 and P < 0.0001, respectively). Tukey's post hoc test was the applied for pairwise comparisons. *P < 0.05; **P < 0.01; ***P < 0.001; ****P < 0.0001.
Infection with viable E. cuniculi, but not V. corneae inhibited expression of TUNEL in staurosporine-induced THP-1 macrophages
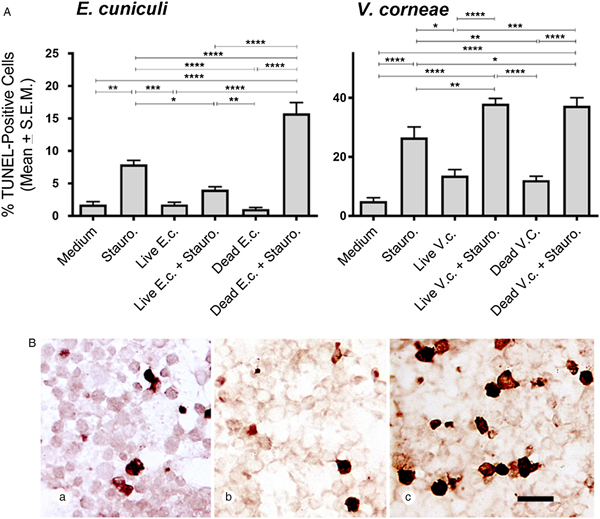
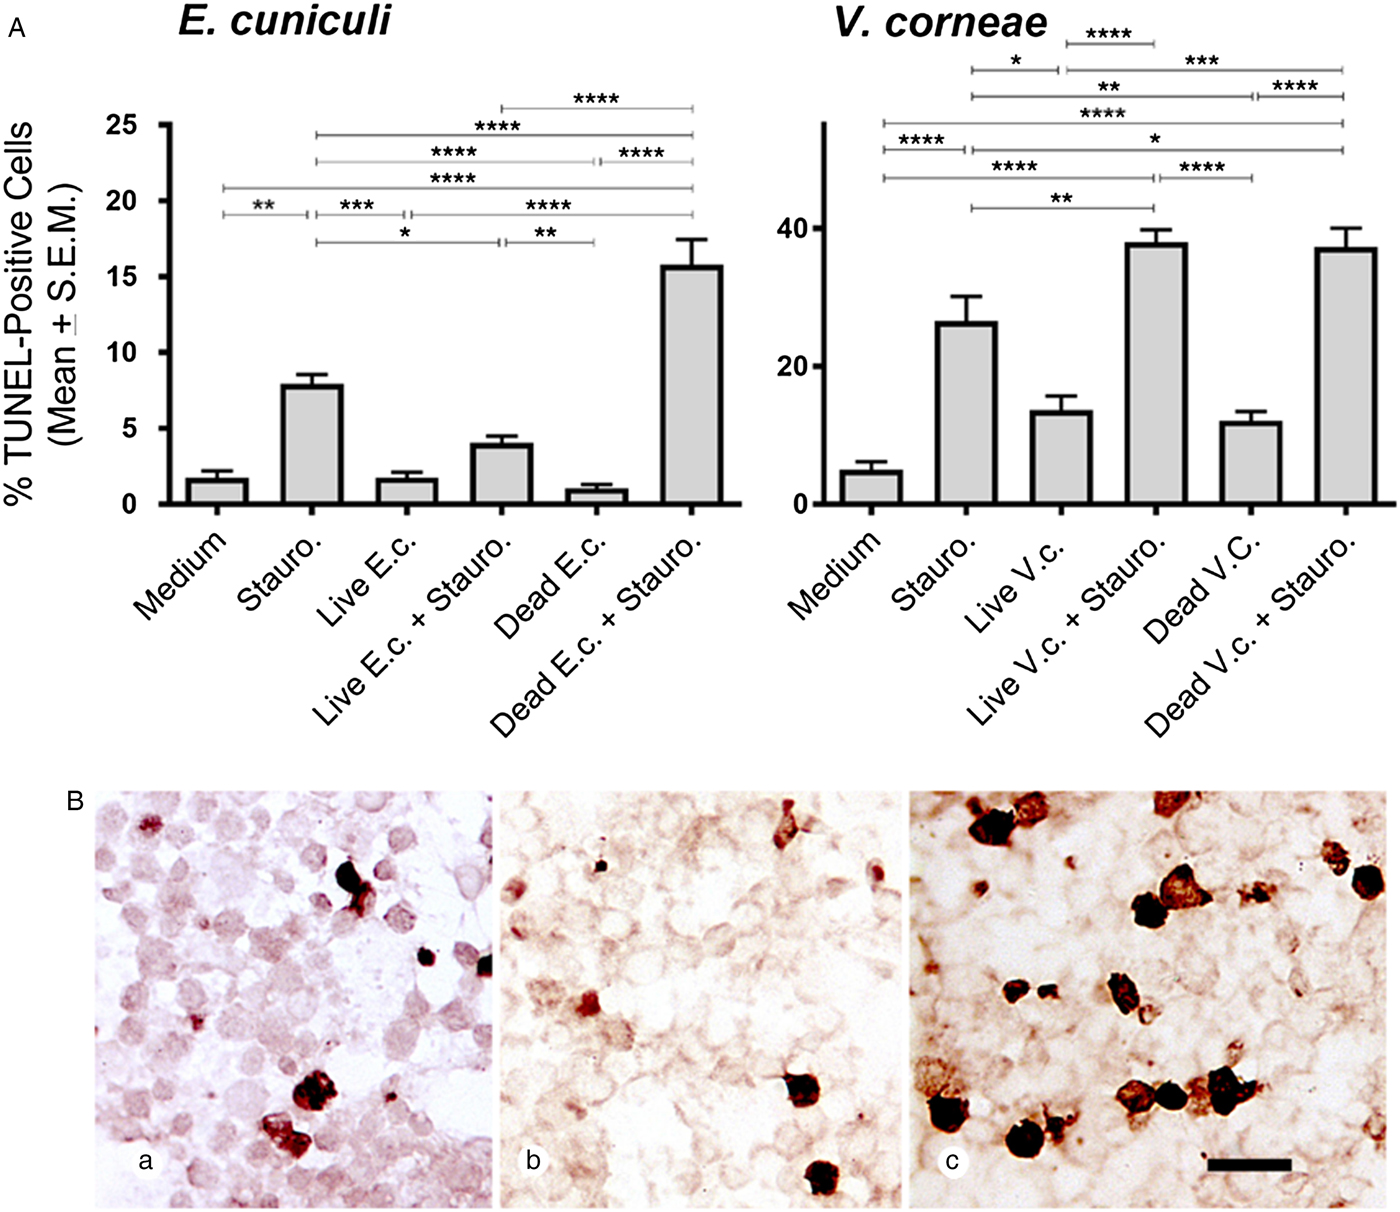
The DeadEnd colorimetric system was used to detect TUNEL-staining macrophages in cultures treated with live and dead E. cuniculi or V. corneae, with and without staurosporine induction (and comparable medium controls). Macrophages incubated with live E. cuniculi and induced by staurosporine exhibited significantly fewer TUNEL-positive cells compared with macrophages incubated without microsporidia and induced with staurosporine (Fig. 2A). Conversely, cultures incubated with dead E. cuniculi spores and induced with staurosporine exhibited significantly higher numbers of TUNEL-positive macrophages than macrophages only treated with staurosporine. Interestingly, staurosporine-induced THP-1 macrophages treated with either live or dead V. corneae spores exhibited higher percentages of TUNEL-expressing cells than macrophages only induced with staurosporine. Representative images in Fig. 2B show the relatively lower and higher numbers of TUNEL-positive staurosporine-induced macrophages incubated with live and dead E. cuniculi, respectively, compared with macrophages only induced with staurosporine.
TUNEL expression in THP-1 macrophages after exposure E. cuniculi or V. corneae (V.c.). THP-1 macrophages were treated as described in Fig. 1 and then were fixed and stained for TUNEL (DeadEnd colorimetric system, Promega) 4 h after staurosporine induction of apoptosis. (A) TUNEL-positive cells were counted under bright-field microscopy at 400×. Results shown represent the means from five fields of view of each of 10 slides per experimental treatment group. ANOVA was performed and was significant for E.c. (P < 0.0001) and V.c (P < 0.0001) experimental groups. Tukey's post hoc test was then applied for pairwise comparisons. *P < 0.05; **P < 0.01; ***P < 0.001; ****P < 0.0001. (B) Representative images are shown demonstrating TUNEL staining of THP-1 cells incubated in medium (a), with live E. cuniculi spores (b) or dead E. cuniculi spores (c). Scale bar = 20 µm.
TUNEL expression was absent in E. cuniculi-infected cells but occurred in V. corneae-infected cells
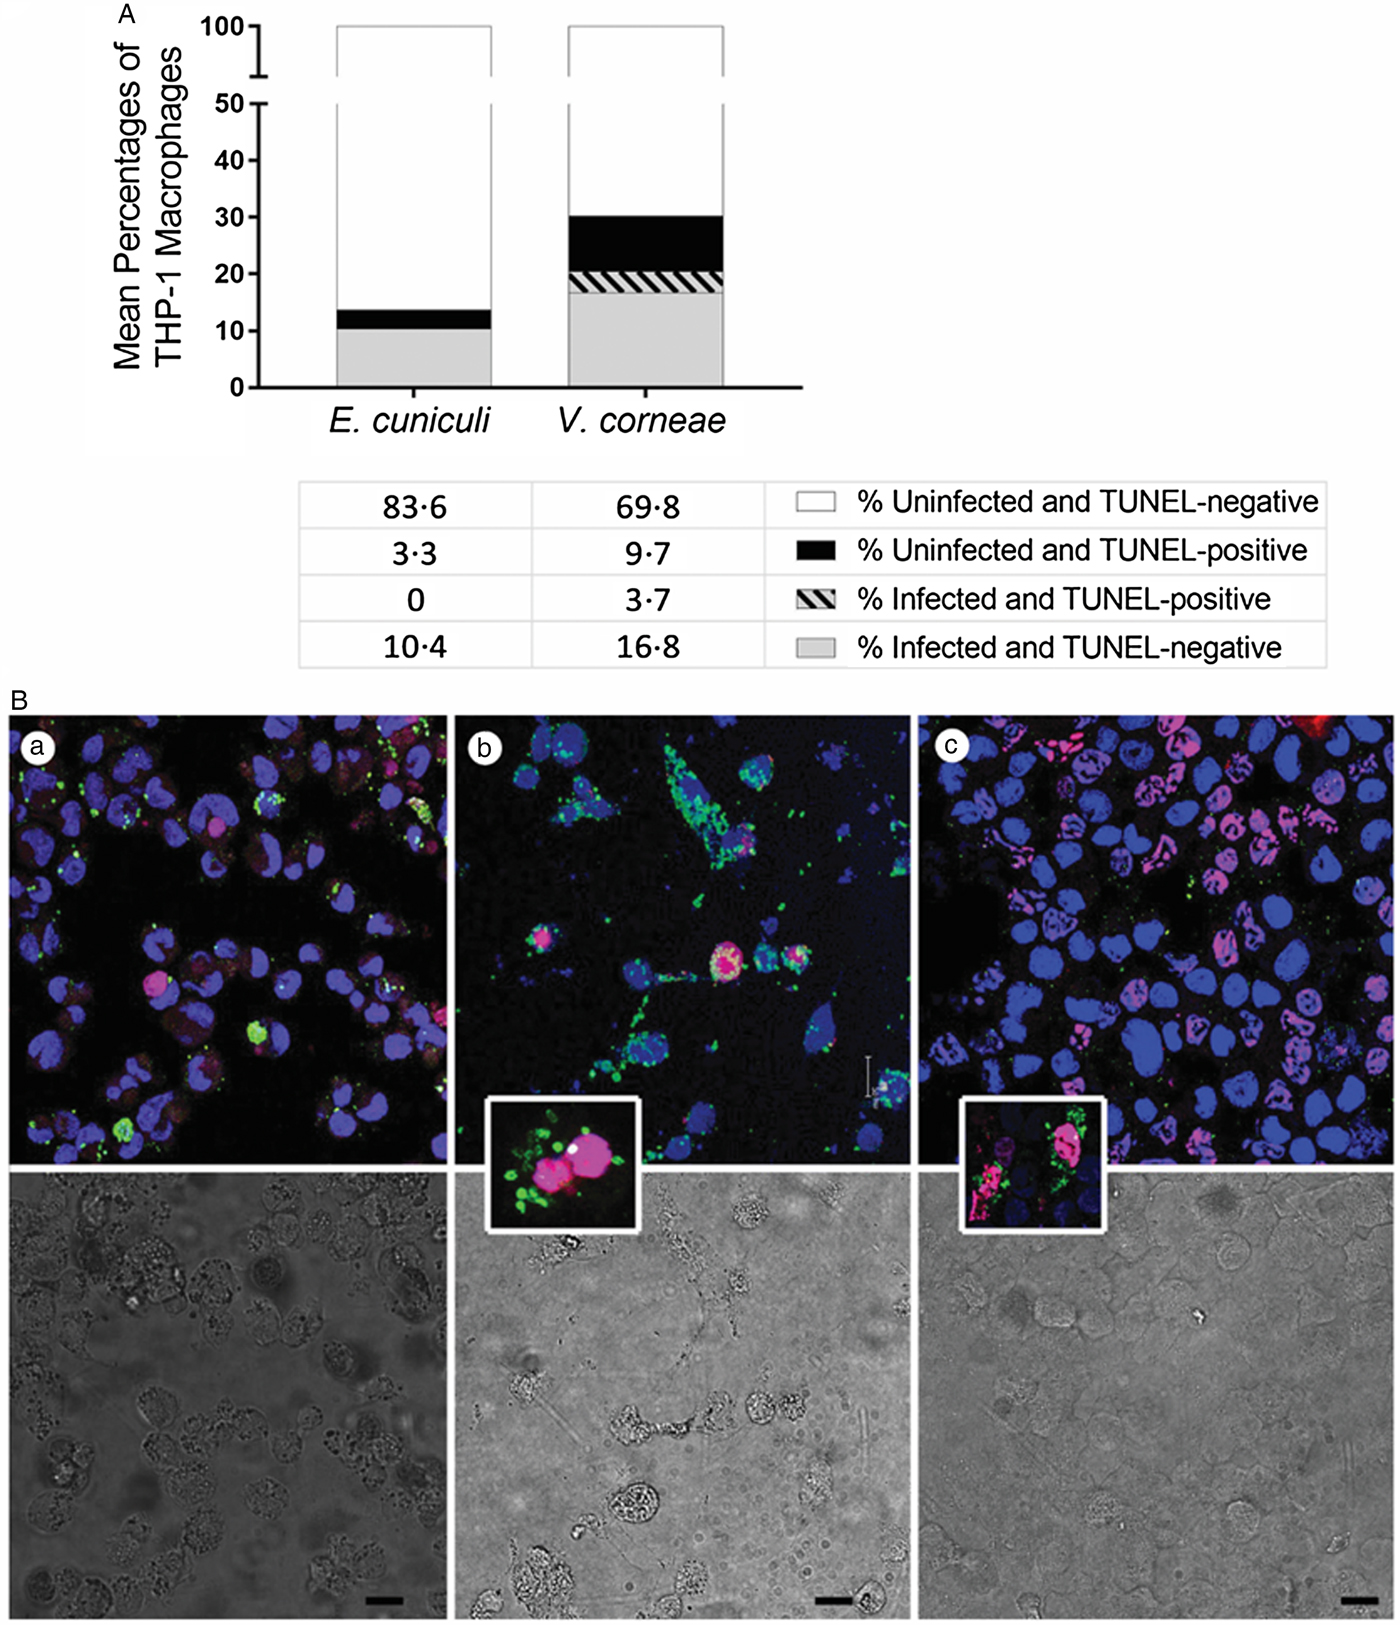
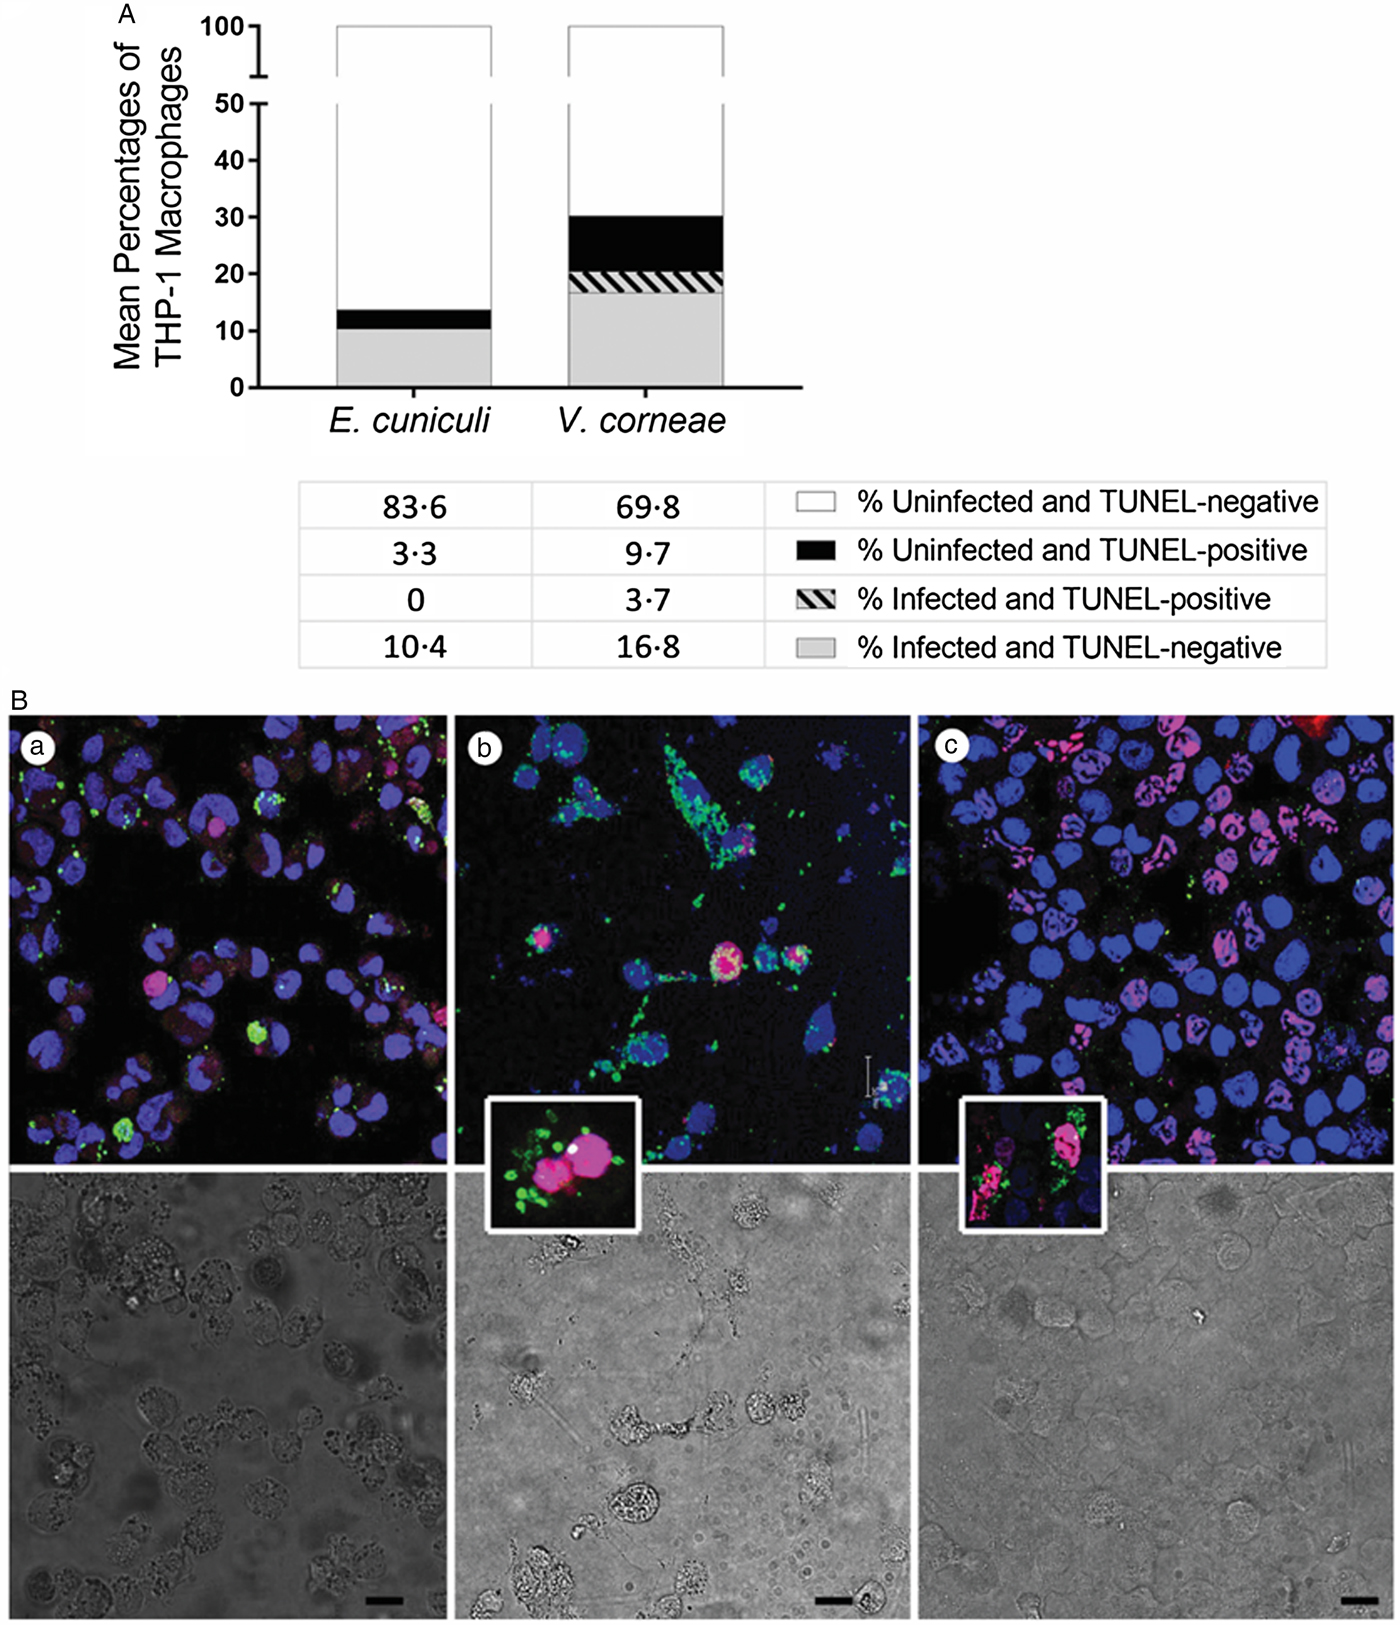
To determine if the cells undergoing apoptosis were infected or uninfected after addition of live microsporidia spores as performed in studies of Fig. 2, we instead applied fluorometric TUNEL-staining assay in combination with immunostaining of microsporidia, and TO-PRO far red-staining of host cell nuclei. Of the cultures incubated with live E. cuniculi, none of the infected macrophages concurrently expressed TUNEL at 4 days after infection and 3.3% of the uninfected macrophages were TUNEL-positive (Fig. 3A). Among the cultures incubated with live V. corneae, 3.7% of the macrophages were concurrently infected and TUNEL-positive, and 9.7% of the uninfected macrophages were TUNEL-positive. Representative images show E. cuniculi-infected THP-1 cells (green) distinct from apoptotic uninfected macrophages (TUNELTMR-red) (Fig. 3B). (a) Among cultures incubated with V. corneae, infected macrophages occasionally were observed to stain positively with TUNEL (Fig. 3B). (b) Cultures incubated with dead E. cuniculi commonly exhibited the presence of apoptotic macrophages containing remnants of phagocytized spores (Fig. 3A). (c) These results suggested that E. cuniculi inhibited apoptosis within cells infected for 4 days, while V. corneae-inhibited apoptosis was lower and not distinctively selective between infected and neighbouring uninfected cells.
TUNEL staining and concurrent detection of microsporidia-infected THP-1 macrophages. THP-1 macrophages were incubated with live E. cuniculi, live V. corneae or dead E. cuniculi, and induced for apoptosis with staurosporine as described in Fig. 1. Cultures were subjected to fluorometric TUNEL-TMR red assay as well as immunofluorescence staining for microsporidia. (A) Percentages of microsporidia-infected or non-infected THP-1 macrophages that were TUNEL-positive or TUNEL-negative 4 days after inoculation of cultures were counted from 4–5 fields of 10 culture wells of each treatment and plotted. (B) Representative images demonstrate fluorometric TUNEL-TMR red assay staining (magenta–red) to detect TUNEL-positive cells, indirect IFA staining to detect microsporidia (green), and Topro-3 far red (blue in figure) to stain host cell nuclei of THP-1 cells infected with E. cuniculi (a), THP-1 cells infected with V. corneae (b) and THP-1 cells exposed to dead E. cuniculi spores (c). The lower panel shows the corresponding differential interference contrast (DIC) images. The insert in image (b) demonstrates a double-nucleated host cell typical for V. corneae infection in which both host nuclei stain for TUNEL. The insert in image (c) demonstrates TUNEL-positive cells containing dead E. cuniculi spore remnants. Magnification bars in (a), (b), (c), and (c) insert = 20 µm and in (b) insert = 10 µm.
Microsporidia-infected THP-1 macrophages exhibited an apoptosis inhibition profile
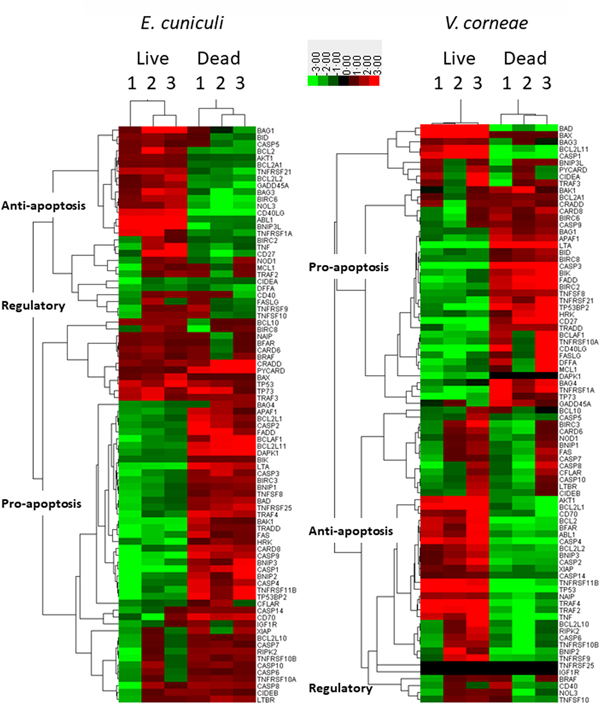
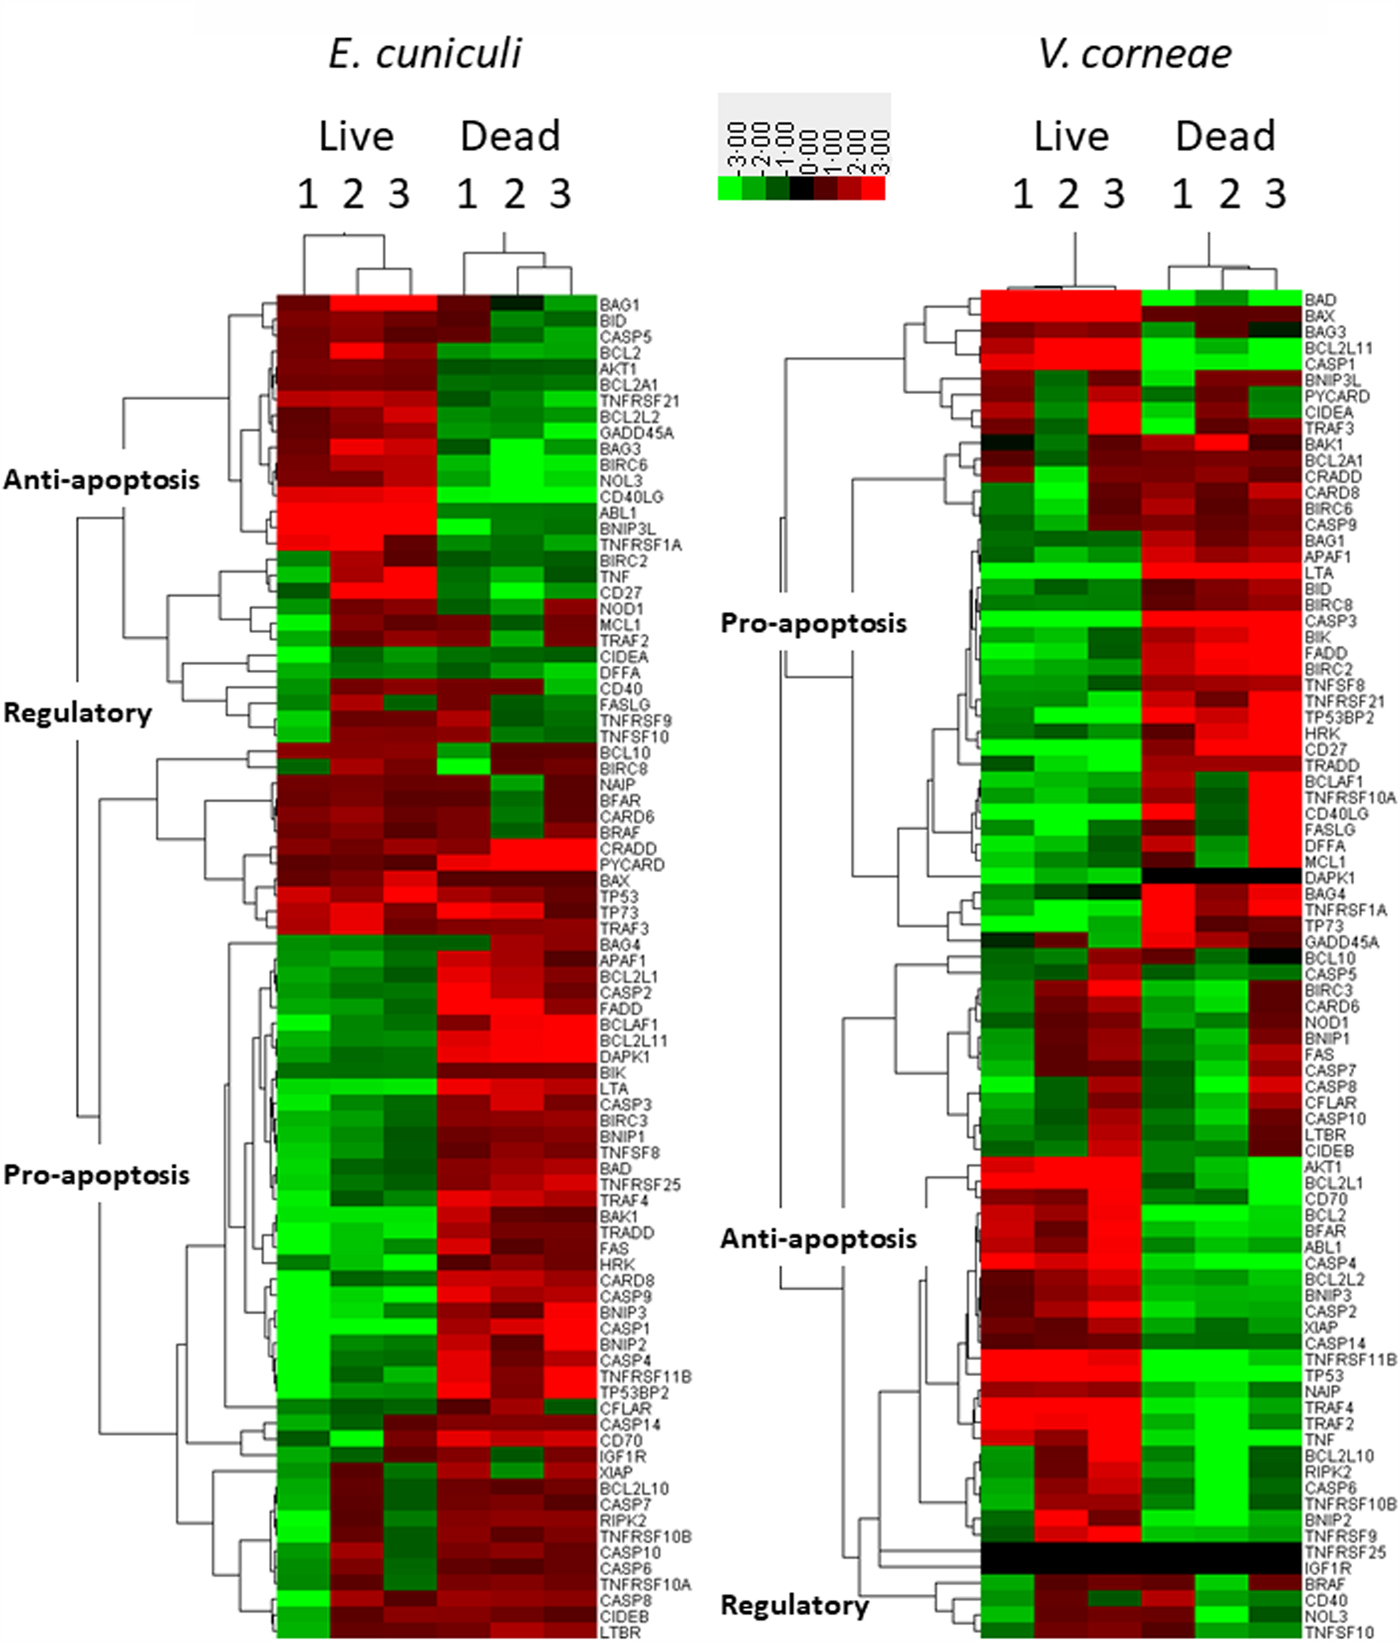
The Qiagen SaBiosciences RT2 profiler array for apoptosis-related gene expression (i.e. mRNA) was applied to THP-1 macrophages incubated with live vs dead microsporidia for 4 days and induced with staurosporine for comparison to control macrophages incubated in medium and induced with staurosporine. Heat maps using hierarchical clustering provide a visualized overview for the relative expression of the regulatory as well as pro- and anti-apoptosis-related genes of this array in macrophages infected with live microsporidia or exposed to dead spores (Fig. 4). Apoptosis inhibitory genes tended to be upregulated in infected macrophage cultures but downregulated in the cultures incubated with dead microsporidia. Conversely, pro-apoptosis genes were downregulated in the cultures inoculated with live microsporidia and upregulated in the macrophages with dead microsporidia. The overall gene expression patterns indicated that live microsporidia spores producing infection inhibited apoptosis while dead spores of microsporidia promoted apoptosis of the macrophages, but that this appeared to be more strongly evident for E. cuniculi than V. corneae.
Heat maps of apoptosis-related gene expression in THP-1 macrophages. THP-1 human macrophages in replicates of three were incubated with medium, live or dead E. cuniculi (left panel) or live or dead V. corneae (right panel) for 4 days. Staurosporine was then added and 4 h later, cells were processed for measuring expression of the 84 apoptosis-related genes using the Apoptosis RT2 Profiler PCR Array kit and as described in the ‘Materials and methods’ section. Heat maps compared gene expression between microsporidia-treated macrophage and medium-treated macrophages. Results were analysed by Cluster software using uncentred hierarchical clustering. Dendrograms were prepared using TreeView software, and categories of pro-, anti- and regulatory apoptosis genes were designated as described in the ‘Materials and methods’ section.
Among the genes expressed by macrophages incubated with dead E. cuniculi spores, 42–44 of the 47 pro-apoptosis genes were upregulated while only three of 21 anti-apoptosis genes were upregulated (Table S1). Conversely, only 4–9 of the 21 anti-apoptosis genes were upregulated and 12–15 genes were downregulated, indicating that dead E. cuniculi spores promoted gene expression in macrophages that favoured apoptosis. When relating percentages of up vs. downregulated genes within each group of pro- and anti-apoptosis genes, over 90% of the upregulated genes were pro-apoptotic in macrophages treated with dead E. cuniculi spores. Among the anti-apoptosis genes, the majority was downregulated (i.e. nearly 64%). Macrophages treated with dead V. corneae spores, however, did not exhibit such a strong difference in that approximately half of each group of pro- and anti-apoptosis genes was up and downregulated.
Macrophages incubated with live E. cuniculi exhibited upregulation of 11–17 of the 21 anti-apoptosis genes and downregulation of the 29–40 of the 47 pro-apoptosis genes. This also was associated with upregulation of only 7–19 of the 47 pro-apoptotic genes. In macrophages incubated with live E. cuniculi spores, 69.4% of anti-apoptotic genes were upregulated and 72.5% of pro-apoptotic genes were downregulated. Again, the percentages of up vs downregulated pro- and anti-apoptosis genes were approximately 50% in macrophages treated with live V. corneae. Thus, the overall percentage of genes up or downregulated in macrophages after incubation with live or dead E. cuniculi shifted more than did the genes in macrophages after exposure to live or dead V. corneae spores.
Of the 84 apoptosis-related genes assayed in this array kit, 42 comprised the top 10 genes that were up or downregulated in at least one of the four treatment groups (i.e. with live or dead microsporidia of two species). These included 23 pro-apoptosis, nine anti-apoptosis and 10 regulatory genes and encoded three major groups of proteins; the Bcl2 family (11 genes), caspases and their regulators (eight genes), and proteins of the tumour necrosis factor (TNF) and tumour necrosis factor receptor (TNFR) superfamilies (11 genes) (Table S2).
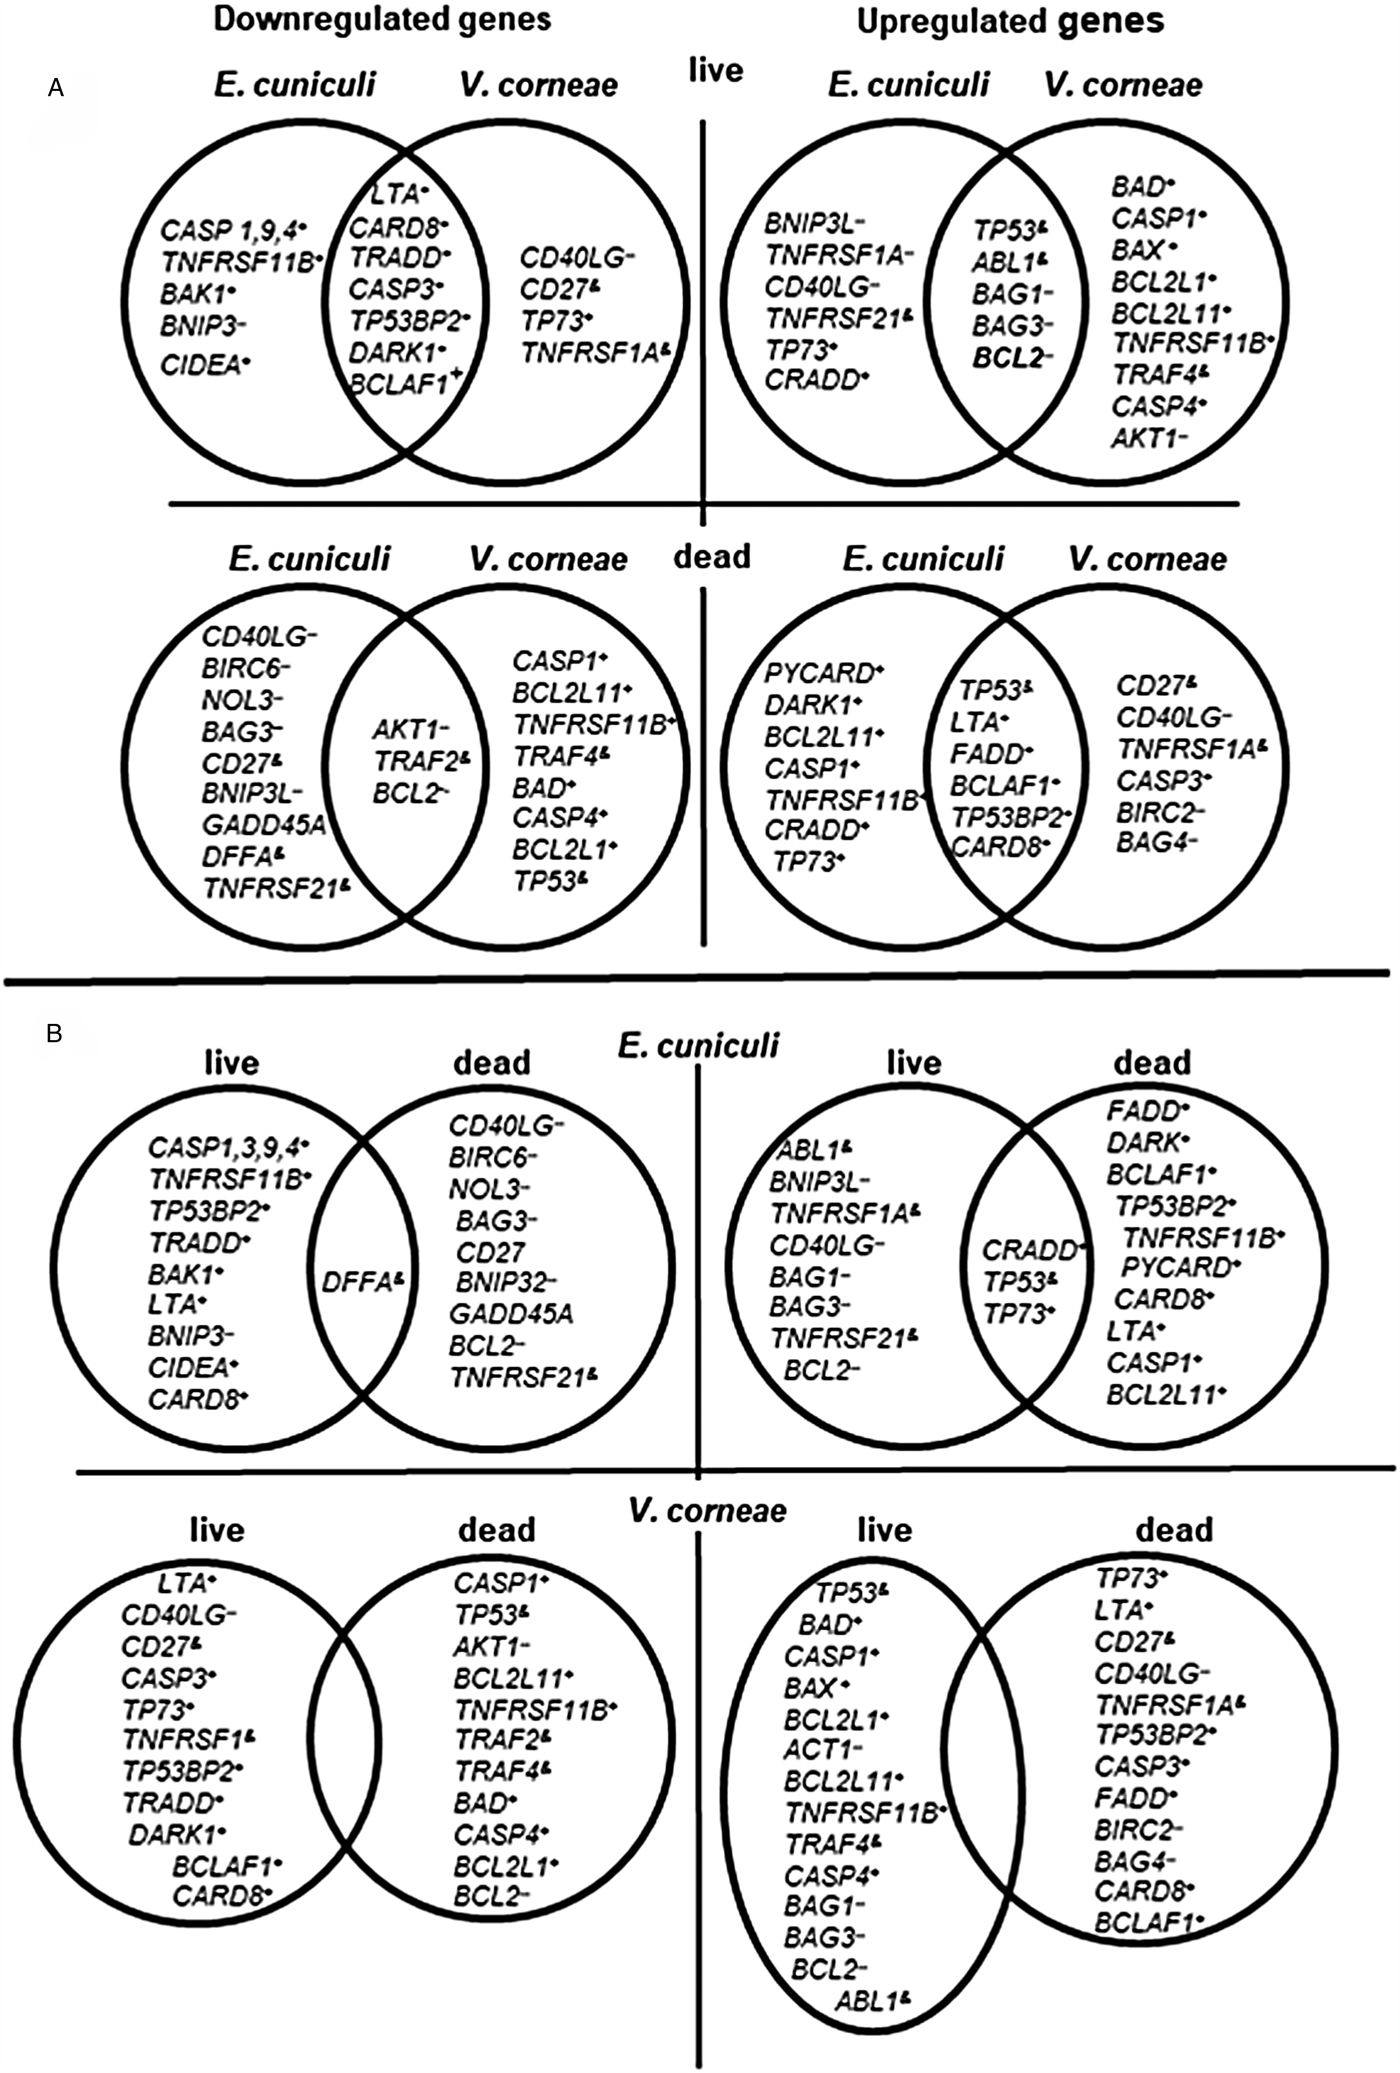
Spores of both species studied here affected the expression of the anti-apoptosis Bcl2 gene similarly; live spores of both species upregulated its expression while dead spores downregulated Bcl2 expression. Interestingly, the gene for the pro-apoptotic Bax protein, known as Bcl2 antagonist, was slightly upregulated by live ( + 1.75) and dead E. cuniculi ( + 1.04) spores, as well as by dead V. corneae spores ( + 1.10), whereas live V. corneae spores induced its upregulation 7.67-fold. Furthermore, Bax expression was the fourth highest upregulated gene in cells treated with live V. corneae after genes for tumour protein p53 ( + 100), Bad, another pro-apoptotic member of Bcl2 family ( + 10.72), and Casp1 ( + 8.17). After exposure of macrophages to live E. cuniculi, however, Bad and Casp1 were downregulated. Overall, exposure to live E. cuniculi resulted in downregulation of most pro-apoptosis members of Bcl2 family that conversely were upregulated after introduction of macrophages to dead E. cuniculi spores, but this was more variable after macrophages were exposed to live or dead V. corneae spores (Table S2, Fig. 5).
Venn diagrams indicating independent and overlapping apoptosis-related gene expression in THP-1 macrophages incubated with live and dead E. cuniculi and V. corneae spores. Gene expression was measured in macrophages 4 days after incubation with microsporidia (or medium controls) and 4 h after staurosporine treatment as described in ‘Materials and methods’ section. Results were averaged from triplicate cultures. (A) Comparisons between species of microsporidia affecting apoptosis-related gene expression in macrophages. (B) Comparisons between live and dead spores for each microsporidia species affecting apoptosis-related gene expression in macrophages. +, pro-apoptosis genes; --, anti-apoptosis genes; &, regulatory genes.
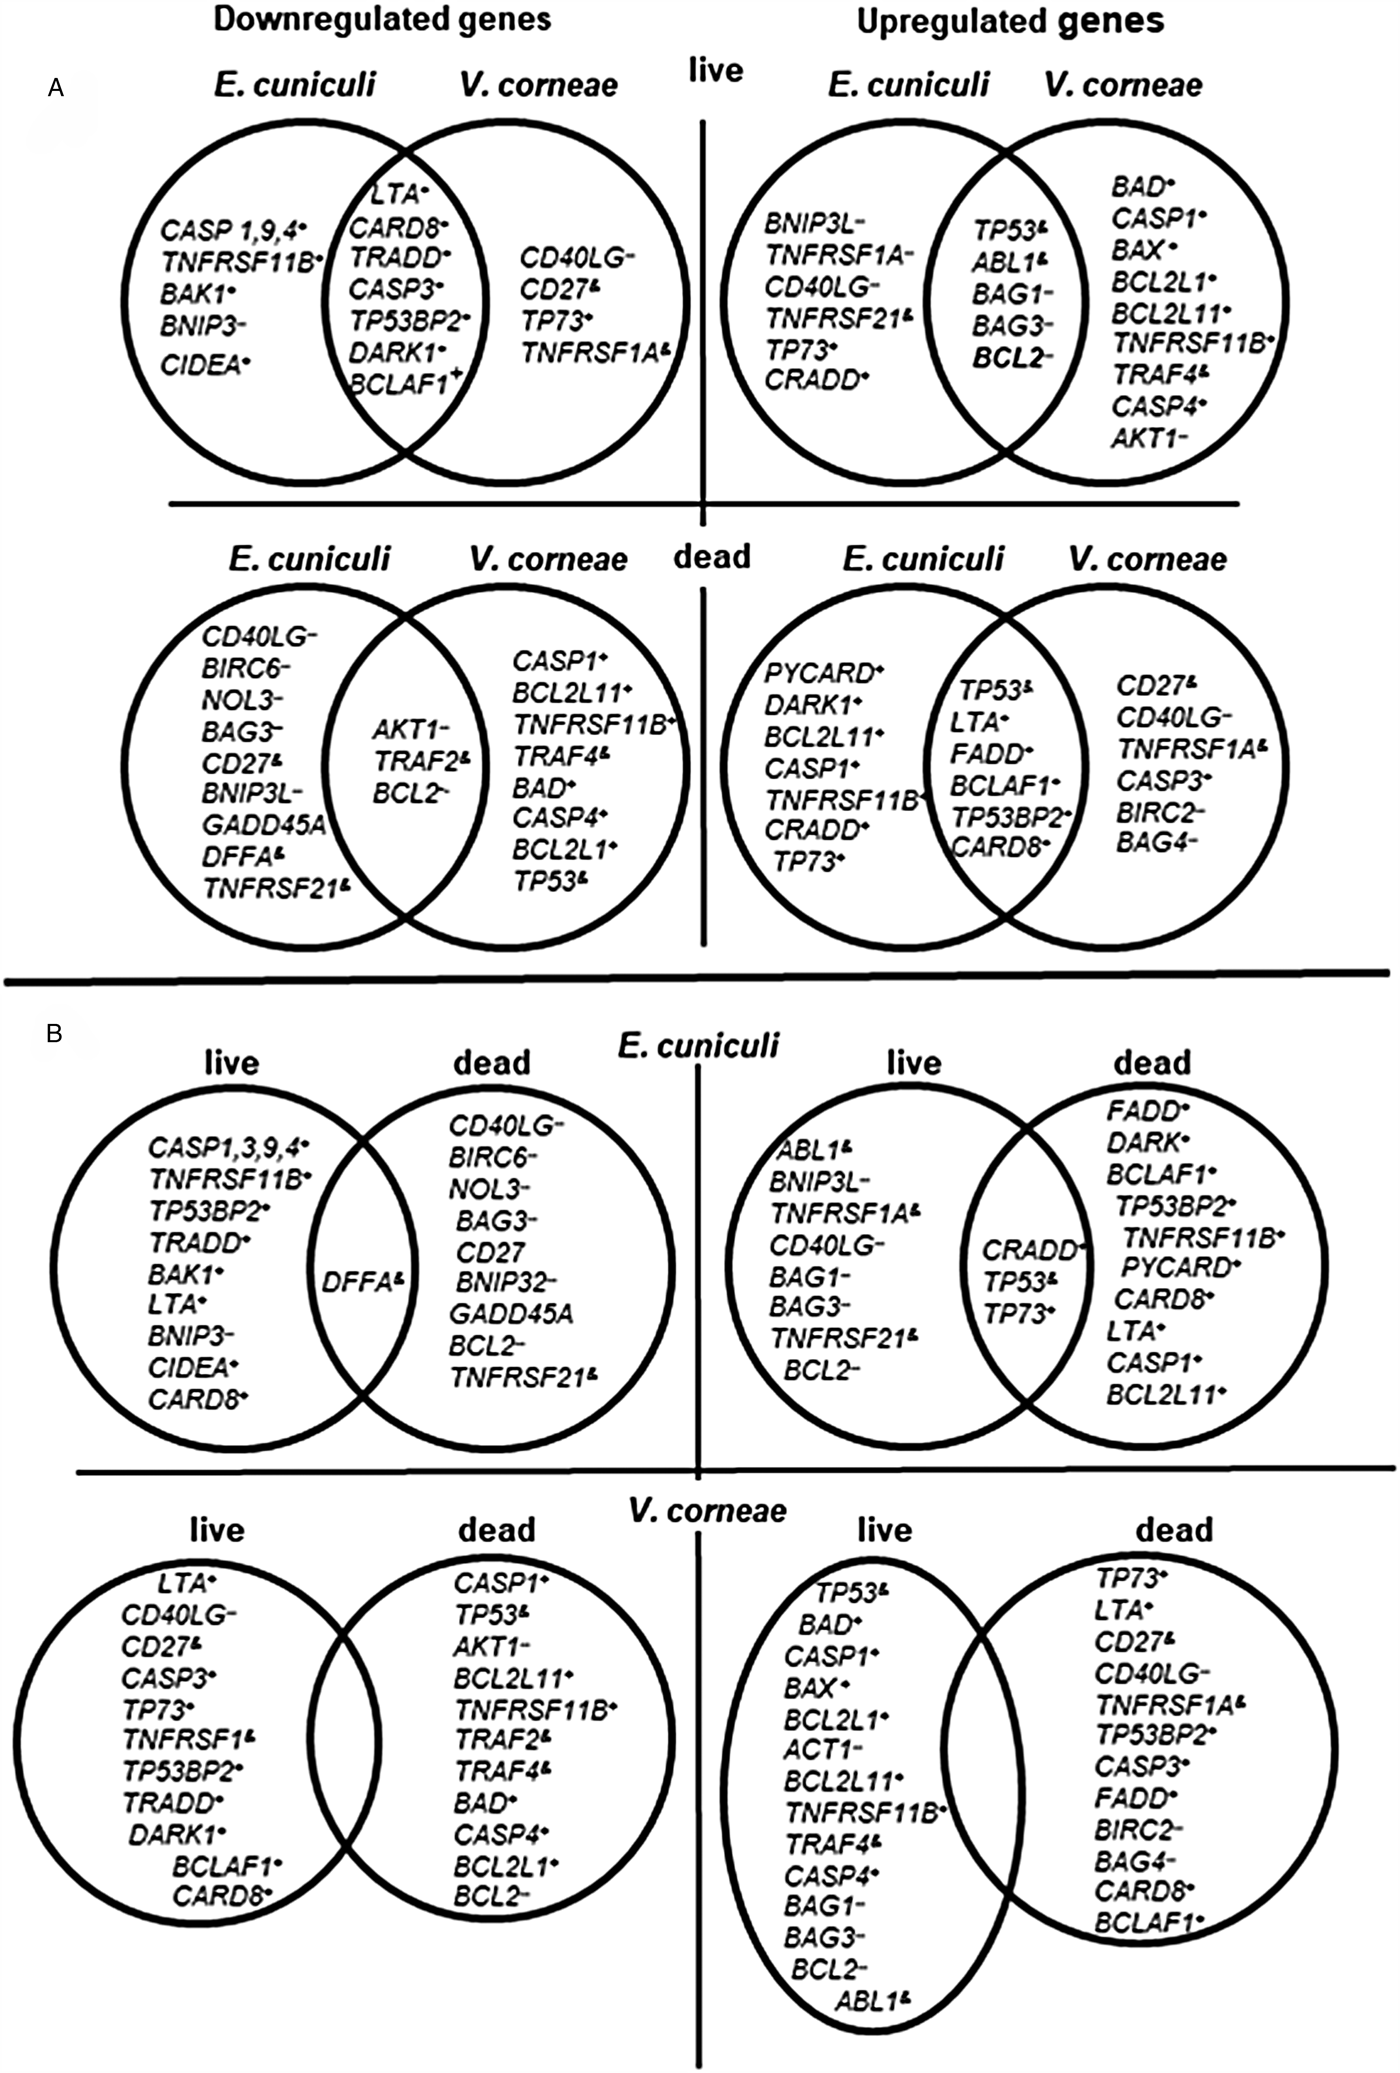
Genes of the caspases Casp1, Casp3, Casp4 and Casp9 that were among the 10 most affected (Table S2) were downregulated by exposure to live E. cuniculi spores. Of these, exposure to live V. corneae spores induced upregulation of Casp1 and Casp4 that encode ‘inflammatory caspases’ involved in inflammasome activation (Sollberger et al., Reference Sollberger, Strittmatter, Kistowska, French and Beer2012). Dead V. corneae spores, unlike dead E. cuniculi spores, downregulated these genes. Casp9 was the most significantly downregulated gene after introduction of live E. cuniculi (−5.33, Table S2) but was only slightly affected by live V. corneae (−0.66). Live V. corneae downregulated Casp3 (−3.83), as did E. cuniculi, but to a lesser extent (−1.88).
Live spores of both species noticeably suppressed macrophages expression of the gene for LTA (lymphotoxin-α) that encodes TNF-β (E. cuniculi, −2.66; V. corneae, −5.85). In contrast, exposure to dead spores induced LTA expression (E. cuniculi, +2.29; V. corneae, +5.85). Pro-apoptosis genes for Fas, FADD, TNFRSF11B, TRADD and the genes for cytokine receptors of the TNFR superfamily and associated proteins were downregulated by live E. cuniculi spores and upregulated by dead E. cuniculi. However, live spores of V. corneae upregulated TNFRSF11B ( + 3.94) and slightly Fas ( + 0.30), whereas dead V. corneae spores downregulated both of these genes. Genes for anti-apoptotic and regulatory TNFR family members, CD40LG and CD27, were upregulated by live E. cuniculi spores (Table S2). The most dramatic effect was the 100-fold upregulation of the gene for tumour protein TP53 by live spores of V. corneae, and conversely, its 46-fold downregulation after exposure to dead spores. In comparison, live and dead spores of E. cuniculi only moderately increased TP53 expression (2.5- and 1.59-fold after exposure to live and dead spores, respectively).
Discussion
Suppression of cysteine aspartic acid protease (caspase) 3 activity in THP-1 macrophages after application of live, but not dead spores of E. cuniculi and V. corneae suggested microsporidia infections contributed to the arrest of the final stages of the cell death apoptosis pathways. The data presented here corroborate previously published results that E. cuniculi infection arrested Caspase 3 cleavage in infected Vero cells using Western blot immunodetection (del Aguila et al., Reference del Aguila, Izquierdo, Granja, Hurtado, Fenoy, Fresno and Revilla2006). Immunocytochemistry results demonstrated the depletion of Caspase 3 in the ventricular epithelial cells of honeybees infected with N. ceranae (Higes et al., Reference Higes, Juarranz, Dias-Almeida, Lucena, Botias, Meana, Garcia-Palencia and Martin-Hernandez2013). In addition, blockade of Caspase 3 activation was demonstrated in cells infected with Toxoplasma gondii and other intracellular protists (Payne et al., Reference Payne, Molestina and Sinai2003).
Activation of Caspase 3 by Caspases 8, 9 or 10 at the ‘execution’ stage of apoptosis leads to degradation of nuclei and other organelles via autophagy and proteasomal digestion. All three apoptosis signalling pathways, mitochondrial (intrinsic), death receptor (extrinsic) and perforin/granzyme pathways converge at the level of Caspase 3 (Bruchhaus et al., Reference Bruchhaus, Roeder, Rennenberg and Heussler2007). TUNEL staining allows for visualization of DNA strand breaks characteristic for degrading nuclei. A significant reduction in the number of TUNEL-positive nuclei was previously shown in gut epithelial cells of honey bees in response to N. apis and N. ceranae infections (Kurze et al., Reference Kurze, Le Conte, Dussaubat, Erler, Kryger, Lewkowski, Muller, Widder and Moritz2015; Huang et al., Reference Huang, Chen, Wang, Cheng and Evans2016; Martin-Hernandez et al., Reference Martin-Hernandez, Higes, Sagastume, Juarranz, Dias-Almeida, Budge, Meana and Boonham2017). Results shown in the present study now demonstrate that human THP-1 macrophages exposed to live E. cuniculi also were inhibited from expressing TUNEL-positive nuclei after induction of apoptosis suggesting that the arrest of the final stages of apoptosis may be a common signature of microsporidia pathogenesis, even in phagocytic cells of the innate immune system. Interestingly, however, live V. corneae spores failed to demonstrate a substantial decrease in TUNEL-positive macrophages. Moreover, studies using both fluorescent TUNEL staining in combination with immunostaining of spores revealed that >20% of macrophages containing V. corneae spores displayed TUNEL-positive nuclei suggesting they were undergoing apoptosis while none of the macrophages infected with E. cuniculi expressed TUNEL staining.
The variable approaches these microsporidia species use for controlling host cell death pathways may reflect their differences in biology and mechanisms of infection (Cali and Takvorian, Reference Cali, Takvorian, Weiss and Becnel2014). Encephalitozoon cuniculi develops within a membrane-bound PV within a host cell and may infect neighbouring cells through polar filament extrusion while still located within the initial host cell PV. In addition, infected macrophages traffic into multiple organs to disseminate infections in new loci (Didier and Weiss, Reference Didier and Weiss2006). Thus, inhibition of host cell apoptosis or programmed cell death would be beneficial for maintaining E. cuniculi infection. In contrast, V. corneae infection and replication occurs in direct contact within the host cell cytoplasm, and the replicating and differentiating organisms eventually fill the entire host cell cytoplasm. V ittaforma corneae spores must exit the host cell and then triggered by environmental stimuli before they can extrude their polar filaments to infect new host cells. Another distinguishing feature about V. corneae infection has been the formation of bi- and multi-nucleated cells (Leitch et al., Reference Leitch, Shaw, Colden-Stanfield, Scanlon and Visvesvara2005; Cali and Takvorian, Reference Cali, Takvorian, Weiss and Becnel2014) which does not occur during E. cuniculi infections. Thus, host cell death and destruction after a period of V. corneae infection and replication may be a means for spores to escape and infect new host cells, especially after the entire host cell cytoplasm becomes laden with organisms. As such, protection from programmed cell death or apoptosis appears more beneficial to E. cuniculi than to V. corneae after initial infection is established.
Analysis of expression profiles of apoptotic-related genes further revealed profound differences between two species. Infection with E. cuniculi and V. corneae often induced different modulations in apoptosis-related gene expression. Among the 42 most affected genes (Table S2, Fig. 5), 12 were affected in opposite directions by E. cuniculi and V. corneae. After introduction with live E. cuniculi, pro-apoptosis genes such as Bad (−1.6), Bcl-2L1 (−1.5) and BclL-2L11 (−1.8) were downregulated in the THP-1 macrophages, and anti-apoptosis genes such as Birc2 ( + 0.52) and CD40LG ( + 2.74) were slightly upregulated. Alternatively, the same pro-apoptosis genes were essentially upregulated including Bad ( + 10.72), Bcl-2L1 ( + 4.4) and Bcl-2L11 ( + 4.1) in macrophages treated with V. corneae spores, while the anti-apoptosis genes such as Birc2 (−2.4) and CD40LG (−4.33) were downregulated (Fig. 5; Table S2). Thus, the spectrum of up or downregulated genes suggests that infection with E. cuniculi more strongly protects macrophages from apoptosis at the 4-day post-infection time point assayed here (which is within the first infection cycle prior to secondary host cell infection). Vittaforma corneae infection, in contrast, caused upregulation of many pro-apoptotic genes suggestive of some positive signalling or induction of apoptosis at this same time point that may favour its mechanism of dissemination (Table S2, Fig. 5).
A few genes, however, were regulated similarly by live spores of both species. For example, the anti-apoptotic Bcl-2 gene was upregulated, whereas pro-apoptosis LTA, CARD8 TP53BP2, DARC1 and BCLAAF 1 genes were downregulated. Given that dead spores of E. cuniculi and V. corneae modulated expression of these genes in the opposite manner from live spores (Fig. 5), it is likely that some aspects of apoptosis inhibition are actively induced by both microsporidia during the course of their intracellular developmental stages. In the case of V. corneae infection, conspicuous upregulation of Bad ( + 10.7), a BH3-only protein among the key regulators of mitochondrial signalling pathway, together with elevated expression of the protein kinase Akt1 ( + 4.38) may indicate that infection triggers phosphorylation of Bad as a means to inhibit apoptosis. Increased phosphorylation of Bad, for example, correlated with inhibition of apoptosis associated with Trypanosoma cruzi and Leishmania spp. infections, and the activity of pro-apoptotic Bad was shown to be negatively regulated via Akt/PKB-mediated phosphorylation (Aoki Mdel et al., Reference Aoki Mdel, Cano, Pellegrini, Tanos, Guinazu, Coso and Gea2006; Ruhland et al., Reference Ruhland, Leal and Kima2007).
That these microsporidia would affect the expression of the Bcl2 proteins was expected based on previous studies. This family includes pro- and anti-apoptotic regulators of the intrinsic apoptosis pathway via modulated release of cytochrome C and other pro-apoptotic factors from the intramembrane space of mitochondria (Luo et al., Reference Luo, Budihardjo, Zou, Slaughter and Wang1998). Bcl2 proteins are deregulated also by many intracellular infectious agents (Faherty and Maurelli, Reference Faherty and Maurelli2008; Graumann et al., Reference Graumann, Hippe, Gross and Luder2009). Specifically, infections with T. gondii (Goebel et al., Reference Goebel, Gross and Luder2001; Channon et al., Reference Channon, Miselis, Minns, Dutta and Kasper2002; Orlofsky et al., Reference Orlofsky, Weiss, Kawachi and Prystowsky2002; Molestina et al., Reference Molestina, Payne, Coppens and Sinai2003; Graumann et al., Reference Graumann, Hippe, Gross and Luder2009), Theileria parva (Dessauge et al., Reference Dessauge, Lizundia, Baumgartner, Chaussepied and Langsley2005), Cryptosporidium parvum (Liu et al., Reference Liu, Deng, Lancto, Abrahamsen, Rutherford and Enomoto2009) each induced expression of anti-apoptotic Bcl2 family proteins. Also, upregulation of the pro-survival ‘buffy’, a Drosophila Bcl2 protein, has been recently reported in ventricular epithelium cells infected with microsporidia, N. ceranae and N. bombycis (Martin-Hernandez et al., Reference Martin-Hernandez, Higes, Sagastume, Juarranz, Dias-Almeida, Budge, Meana and Boonham2017).
Caspase 9 that was shown here to be noticeably downregulated (−5.53) by E. cuniculi also has been linked to intrinsic apoptosis pathway by triggering pro-caspase 3 cleavage and the downstream cascade resulting in cell disintegration and death (Bratton and Salvesen, Reference Bratton and Salvesen2010). Downregulation of Caspase 3 and Caspase 9 along with the activation of anti-apoptotic Bcl2 indicated that E. cuniculi as well as V. corneae infections influenced the mitochondrial apoptosis pathway (Fig. S1). This signalling pathway was demonstrated to be negatively regulated by many other intracellular parasites (Graumann et al., Reference Graumann, Hippe, Gross and Luder2009), including several microsporidia species such as A. algerae (Scanlon et al., Reference Scanlon, Leitch, Shaw, Moura and Visvesvara1999), N. ceranae, N. apis (Huang et al., Reference Huang, Chen, Wang, Cheng and Evans2016; Martin-Hernandez et al., Reference Martin-Hernandez, Higes, Sagastume, Juarranz, Dias-Almeida, Budge, Meana and Boonham2017) and N. bombycis (He et al., Reference He, Fu, Li, Liu, Cai, Man and Lu2015).
In addition to their role in modulating apoptosis, Bcl2 proteins can function as crucial regulators of inflammatory responses such as those associated with infections by various pathogens (Luder et al., Reference Luder, Gross and Lopes2001; Hay and Kannourakis, Reference Hay and Kannourakis2002; James and Green, Reference James and Green2004; Faherty and Maurelli, Reference Faherty and Maurelli2008). For example, infection of mice with T. gondii results in an increase in inflammatory neutrophils and macrophages coinciding with upregulation of the pro-apoptotic Bcl2 family protein, A1 (Orlofsky et al., Reference Orlofsky, Weiss, Kawachi and Prystowsky2002). Similarly, upregulation of pro-apoptotic Bcl2L1 and Bcl2L11 after V. corneae, but not E. cuniculi infection suggests that V. corneae may elicit a stronger inflammatory response through Bcl2 family signalling. Regulating inflammatory responses is necessary for enabling parasite infection and replication, and the results presented here indicate that microsporidia may modulate apoptosis-related genes affecting inflammation to secure their survival albeit through different mechanisms. Here, we found that genes for Caspase 1 and Caspase 4 were downregulated by live E. cuniculi (−4.78 and−2.24, respectively) but strongly upregulated by live V. corneae spores ( + 8.17 and + 3.32). Caspase 1 may serve as a substrate for Caspase 4, and their formation of immune complexes or inflammasomes thereby activate secretion of cytokines IL-1β and IL-18 from mammalian macrophages (Sollberger et al., Reference Sollberger, Strittmatter, Kistowska, French and Beer2012). Encephalitozoon cuniculi naturally infects macrophages and thus may have evolved mechanisms to suppress inflammatory caspases, whereas V. corneae is not typically observed to infect macrophages. On the other hand, E. cuniculi infection was associated with the overexpression of genes for CD27, CD40LG, TNFRSF1A and TNFRSF21, which were downregulated in macrophages infected in vitro with V. corneae. These TNFR superfamily members exhibit pro-inflammatory effects (Locksley et al., Reference Locksley, Killeen and Lenardo2001; Hehlgans and Pfeffer, Reference Hehlgans and Pfeffer2005). Positive regulation of these genes by E. cuniculi may contribute to increased trafficking or recruitment of immune competent cells such as macrophages, leucocytes and mononuclear inflammatory cells that provide new host cells for infection or to form the multifocal granulomas that can protect the microsporidia in vertebrate hosts (Snowden and Shadduck, Reference Snowden, Shadduck, Wittner and Weiss1999; Weiss, Reference Weiss, Weiss and Becnel2014; Sokolova et al., Reference Sokolova, Sakaguchi and Paulsen2016).
A striking observation in these results was that more than 100-fold increased expression of the p53 gene induced in macrophages incubated with live V. corneae. In contrast, exposure to live or dead E. cuniculi only moderately induced upregulation of the p53 family proteins (p53 and p73). Previously, it was demonstrated that Encephalitozoon spp. infections of Vero cells blocked p53 phosphorylation and translocation to the nucleus, thus inhibiting its transcriptional functions (del Aguila et al., Reference del Aguila, Izquierdo, Granja, Hurtado, Fenoy, Fresno and Revilla2006). The p53 pathway, along with the NF-Kβ pathway, are evolutionarily conserved and contribute to ensure genome stability, inhibit neoplastic processes and provide overall cell homoeostasis (Fridman and Lowe, Reference Fridman and Lowe2003; Cooks et al., Reference Cooks, Harris and Oren2014). Functions of p53 as a transcriptional factor and modulator of innate immune responses date back to early invertebrates. For example, p53 was shown to activate TLR genes in T lymphocytes and alveolar macrophages (Menendez et al., Reference Menendez, Shatz, Azzam, Garantziotis, Fessler and Resnick2011). Many stress signals activate the expression of p53 which is further affected by numerous post-translational modifications including ubiquitination, phosphorylation and acetylation that then influence outcomes and targets of p53 induction. One role of p53 is to protect the cell and organism from inflammatory stress associated with pathogen infections and for reducing development of cancers. Conversely, some oncogenic viruses and bacteria such as Helicobacter pylori have evolved mechanisms to inactivate or modulate inhibitory effects of p53 (Cooks et al., Reference Cooks, Harris and Oren2014). The elevated expression of p53 in the macrophages incubated with live V. corneae may reflect this stress response. Noticeably, two other genes, Bax, a transcriptional target of p53 in the apoptosis pathway, and Akt, the kinase that potently phosphorylates p53, were significantly upregulated, as well. It is therefore possible that the overexpression of p53 and activation of p53 pathway might be more predominant for V. corneae than E. cuniculi given the biology that this microsporidium affects the host cell cycle for promoting multinucleation and cell cycle arrest (Leitch et al., Reference Leitch, Shaw, Colden-Stanfield, Scanlon and Visvesvara2005) not observed for E. cuniculi infection.
Overall, the results of this study demonstrated that two species of microsporidia infecting humans modulated apoptosis of host cell macrophages. Under natural conditions, E. cuniculi readily infects macrophages and epithelial cells while V. corneae is less likely to infect macrophages. However, macrophages function in innate immune responses and would likely encounter both species under natural infections, either during initial stages of infection, during the course of immune responses or for phagocytizing organisms killed by immune responses. Also, macrophages are key regulators of inflammation, and thus, it was not surprising that the live E. cuniculi spores generally suppressed pro-apoptosis genes and upregulated anti-apoptosis genes on a broader and more consistent basis than did V. corneae in an effort to facilitate infection, host cell parasitism and cell-to-cell infection. However, while more common to Encephalitozoon spp., V. corneae also may produce disseminated infections which most likely occurs via trafficking monocytes/macrophages (Deplazes et al., Reference Deplazes, Mathis, van Saanen, Iten, Keller, Tanner, Glauser, Weber and Canning1998; Didier and Weiss, Reference Didier and Weiss2006). In addition, V. corneae may benefit from earlier host cell death to allow release of mature spores into the environment for infecting new host cells and may not have evolved as a strong anti-apoptosis modulation since it does not routinely infect macrophages. Conversely, incubation of macrophages with dead organisms seemed to promote or induce host cell apoptosis, perhaps as a means to induce phagocytosis of residual organisms.
Supplementary material
The supplementary material for this article can be found at https://doi.org/10.1017/S0031182018001968.
Author ORCIDs
Elizabeth S. Didier 0000-0002-8343-7202
Acknowledgements
We gratefully acknowledge Mr. Chris Monjure and Mr. Coty Tatum of the Pathogen Detection and Quantification Core at the Tulane National Primate Research Center for assistance with the RT-PCR assay.
Financial support
This work was supported by the Tulane University Research Enhancement Fund and the National Institutes of Health for the Tulane National Primate Research Center (OD 011104).
Conflict of interest
None.
Ethical standards
Not applicable.