Introduction
In this paper, we present the results from the first representative financial literacy survey in Finland and examine their connections to retirement planning. The questions used in the Finnish survey are similar to those of surveys conducted in a number of other countries, which enables cross-country comparisons. A particularly interesting issue is retirement planning, which this paper investigates to add to a large and growing body of international research. We use three core questions that are used in much of the literature. We further contribute to this literature by using an extended measure of financial literacy. We also investigate whether the results differ by gender.Footnote 1
Finland is an interesting case for at least two reasons. First, the educational level of Finns is high, evidenced, for instance, in the PISA surveys. Second, the levels of social security and especially the statutory predetermined component in pensions are high, which could reduce the incentives for pension planning. As such, the often-found relationship between financial literacy and pension planning may be weaker in Finland.
Furthermore, the Finnish pension system is currently under some pressure to change. Finland has a partially funded defined benefit scheme. This scheme involves private insurance firms, and the employer, not the employee, selects the pension provider. Employees can make very few choices in the statutory system; basically, they can only decide whether they want to complement their pension arrangement with voluntary pension insurance. Although the pressure to change is not immediate, in the long run, the system may not be sustainable, and some changes, such as an increase in the retirement age, can be expected. It is also likely that there will be a shift toward increased responsibility of individuals to ensure the sufficiency of their pension arrangements.
We find that the overall level of financial literacy in Finland is relatively high, though it is unequally distributed, as some groups (e.g., the elderly, women, and the less educated) clearly have lower levels of financial literacy. In univariate comparisons, we find that those who plan for retirement also have higher levels of financial literacy. However, the differences are relatively small and not always consistent. In regression models that include several control variables, the three core questions (i.e., the interest rate, inflation, and risk) do not have much predictive power regarding who plans and who does not plan. Instead, the eight-item extended measure of financial literacy has a positive and statistically significant connection with retirement planning. Furthermore, when we split the sample between males and females, we find that the relationship between financial literacy and planning is statistically significant for females but not for males.
Institutional background
Finland, along with other Nordic countries, can be characterized as a welfare state, where the traditional approach has been to insulate ordinary citizens from the risks emanating from labor and financial markets. The model has been based on the extensive public provision of social benefits (Kautto et al., Reference Kautto, Heikkilä, Hvinden, Marklund, Ploug, Kautto, Heikkilä, Hvinden, Marklund and Ploug1999), which has mitigated a wide range of personal and financial risks, mainly via statutory solutions. For example, an extensive earnings-related occupational pension system and a universal national pension system cover cases in which the occupational pension falls below certain threshold.Footnote 2 The Finnish pension system has been based on defined benefits and mandatory contributions. The system has been partly funded by a ‘Pay as You Go’ system and partly paid by the current cohort of workers. The pension funds are mutually owned and administered by the employers’ representatives. In the mid-2000s, the ratio of pension benefits to the population's income was approximately 75%, somewhat lower than the Organisation for Economic Co-operation and Development (OECD) average (Barr, Reference Barr2013: 33–34). In 2014, the normal retirement age was 63, and the mandatory retirement age was 68.
In recent years, the Finnish economy has been forced to cope with an adverse business cycle and formidable structural challenges. Although Finland's financial sector was only moderately affected by the financial crisis of 2008, subsequent troubles in the euro area, the decline in exports and the dramatic decrease in sales in the electronics sector have driven the economy into a prolonged recession. Because of the recession, increasing unemployment, combined with challenges emanating from the ageing population and an increasingly adverse dependence ratio, has undermined the government's ability to sustain previous levels of benefits. Before the crisis, fiscal challenges had already been predicted to put pressure on the pension system, and there were calls for reforms that cut the level of benefits, thus shifting more responsibility onto individual consumers (Kangas, Reference Kangas, Immergut, Anderson and Schulze2006). In 2014, the statutory occupational pension system was reformed, resulting in less generous benefits for the working population born in the 1960s or 1970s (Kautto and Risku, Reference Kautto, Risku, Kautto and Risku2015). In addition, a demographic multiplier was introduced in the 2005 pension reform to adjust the level of pension benefits based on increased life expectancy (Börsch-Supan, Reference Börsch-Supan2005). To sustain a desired level of retirement income, households are under more pressure to engage in private solutions for savings and investments, which has drawn attention to the need for financial literacy in the population at large.
Additional factors have contributed to the increased interest in financial literacy in Finland. The country has previously prided itself on its very low level of income inequality. However, since 1995, income inequality has markedly increased (Jäntti et al., Reference Jäntti, Riihelä, Sullström, Tuomala, Atkinson and Piketty2010). The level of household assets has increased, but much of the wealth is concentrated in a small number of households. Financial deregulation has simultaneously increased the size and scope of the financial services industry. Between 2006 and 2011, the number of households owning shares increased from 23% to 29%. In 2011, more than half (54%) of Finnish households owned some kind of financial saving instrument, such as stocks, bonds, or mutual funds (Pörssisäätiö, 2011).
The widening income inequality has also increased the number of people experiencing payment problems. At the end of April 2015, over 8% of the adult population had a registered payment default entry (Suomen Asiakastieto, 2015). Therefore, the need for financial literacy has increased in vulnerable segments of the population.
Jappelli (Reference Jappelli2010) and Jappelli and Padula (Reference Jappelli and Padula2013, Reference Jappelli and Padula2015) have predicted (and have shown) that a high level of social security will be inversely related to financial literacy because the citizens do not have sufficient incentives to invest in financial literacy. For these reasons, Finland provides an interesting setting in which to study financial literacy – one that is quite different from that of the USA. Comparing the results in Finland with those in countries with similar institutional features, especially Sweden, will be interesting (Almenberg and Säve-Söderbergh, Reference Almenberg and Säve-Söderbergh2011a).
Even though the high level of social security may mean that Finnish citizens have fewer incentives to invest in financial literacy, the generally high level of educational outcomes may work in the opposite direction. The math scores from the OECD PISA studies have been found to be important predictors of financial literacy (Jappelli and Padula, Reference Jappelli and Padula2013). The Finnish students’ math scores were the highest in all the countries studied; even though their relative position had fallen in the 2012 study, their scores were still well above the average and among the highest in European countries (OECD, 2014).Footnote 3
Data
This paper uses the first nationally representative survey on the financial knowledge, behavior and attitudes in Finland. This survey was conducted in 2014 as a joint research project between the University of Vaasa and the University of Tampere. It was primarily funded by the Academy of Finland and various financial sector trusts and institutions. The OECD questionnaire (Atkinson and Messy, Reference Atkinson and Messy2012) formed the basis of the Finnish questionnaire; however, certain changes were made, and numerous questions were added. The questions are also comparable with those in the FLat World project – in some cases, they were closer to FLat World questions than to OECD questions (as discussed below). The questionnaire was delivered both in Finnish and Swedish, as Finland is a bilingual country.
The data collection was performed by a series of face-to-face interviews. Face-to-face interviews were preferred because they are often regarded as the ‘gold standard’ in financial literacy studies (Kempson, Reference Kempson2011; Lusardi and Mitchell, Reference Lusardi and Mitchell2014). Internet- or mail-based surveys might provide the respondents with the opportunity to improve their knowledge, thereby overstating their true knowledge. The response rates and representativeness of the sample may also be problematic. Moreover, many questions may be difficult to answer in telephone interviews. Hence, face-to-face questionnaires were chosen, despite the higher costs.Footnote 4
After testing the questionnaire via pilot interviews in early February 2014, the final interviews were conducted by TNS Gallup from February to April 2014. A cross-sectional sample consisting of 1,477 valid observations was collected.Footnote 5 The sample was weighted by the population and included respondents aged 18–92. The interviewed person was selected randomly; he/she could also be someone who was not the head of the household or the most knowledgeable person on financial matters. The mean duration of the interview was 33 min (median of 30 min). The interviews were delivered by experienced interviewers from TNS Gallup. The responses were based on this survey only, so the data were cross-sectional. The respondents answered anonymously. Because they did not need to worry about confidentiality, their responses may be more reliable.
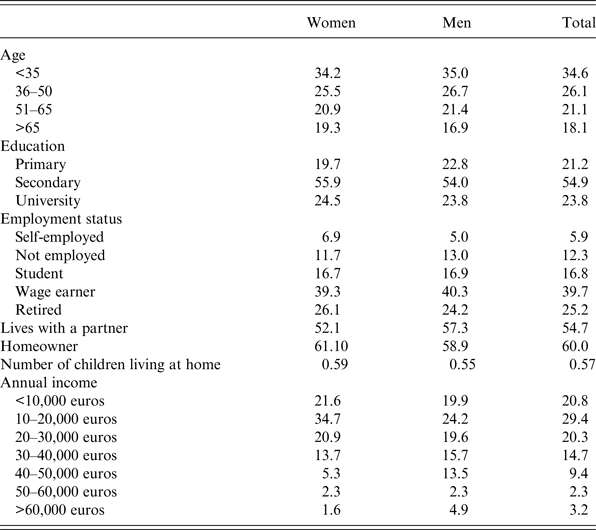
In Table 1, we provide the summary statistics for a number of demographic variables separately for men and women. This table shows that with respect to key variables such as age, education, and occupation, there are no pronounced differences between men and women, although women are slightly more present in the older age groups and have slightly higher education levels on average. Men also tend to have a higher presence in higher income categories.
Proportion of women and men in various demographic groups

Note: Sample weights have been taken into account in the calculation of the frequencies.
Financial literacy in Finland
Financial literacy measures
In this section, we present the results from our survey to enable a comparison with other countries. We start by analyzing the three core questions identified by Lusardi and Mitchell (Reference Lusardi and Mitchell2011: 511). They use the set of questions found in the 2009 U.S. National Financial Capability Survey (NFCS) to assess the extent of financial literacy among the US population. These questions measure the interest rate, inflation, and risk. The survey instrument toolkit produced by the OECD in 2013 includes similar questions with small notational differences (OECD, 2013). The Finnish questions resemble both of these sets of questions. To make comparing questions with the exact wording found in the OECD easier, the U.S. NFCS and Finnish Financial Literacy Survey are reproduced in Appendix 1. The questions in the Finnish Survey were as follows:
Understanding the interest rate (Numeracy)
(a) Suppose you put €100 into a savings account with a guaranteed interest rate of 2% per year. You do not make any further payments into this account, and you do not withdraw any money. How much would be in the account at the end of the first year, once the interest payment is made? [Assume no taxes are paid on interest] Correct answer: €102.
(b) In addition, how much would be in the account at the end of 5 years, remembering that no fees and taxes exist and that the interest rate is 2% per year? More than €110/Exactly €110/Less than €110/Do not know. Correct answer: More than €110.
Understanding inflation
Suppose that you put €1000 into a savings account with a guaranteed interest rate of 1% per year. The inflation is 2% annually. You do not make any further payments into this account, and you do not withdraw any money. In 1 year's time, will you be able to buy more than you can buy today/the same amount/less than you can buy today/do not know? Correct answer: Less than you can buy today.
Understanding risk and diversification
When you invest in a wide range of stocks, you usually have a higher risk of decreasing the value of your investment than when you invest only in one stock. True/False/Do not know. Correct answer: False.
The interest rate and inflation questions represent a very basic knowledge of savings. The risk and diversification question is a more advanced question, as it requires the respondent to understand some investment-related concepts.
The interest rate question has a two-stage structure in the OECD survey and in the Finnish survey. The first part of the question asks about the savings balance after 1 year, and the second part asks about the situation after 5 years. Therefore, the question is more complicated than those that resemble the structure of the U.S. NFCS.Footnote 6 The U.S. question measures the respondents’ understanding of the interest rate only, whereas the Finnish question also measures the respondents’ understanding of compound interest. In our analysis, we focus on the second part of the interest rate question to produce results that are more comparable with those of the US survey.
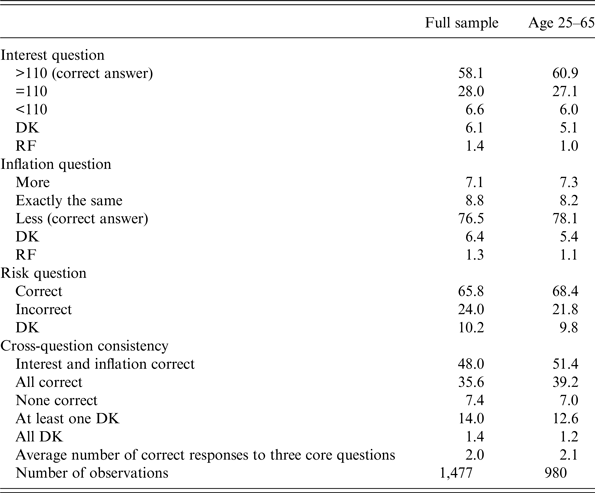
The results for all the respondents and for those between the ages of 25 and 65 are presented in Table 2.Footnote 7 Concerning the interest rate question, for the entire population, 58% of the respondents provided the correct answer. Of those between the ages of 25 and 65, 61% provided the correct answer. These results are lower than those reported in the USA (65% and 68%, respectively); however, compared with other countries in the OECD study, Finland is in the upper quartile (Atkinson and Messy, Reference Atkinson and Messy2012).Footnote 8 However, the share of ‘do not know’ responses in Finland is much lower than that in the USA for the 25-to-65 age bracket – only 5.1% compared with 11.1% in the USA (Lusardi and Mitchell, Reference Lusardi and Mitchell2011).Footnote 9
Summary statistics for three financial literacy questions in the Finnish Financial Literacy Study: frequencies of responses (in percentages)

Note:
(1) Sample weights have been taken into account in the calculation of the frequencies.
(2) DK, do not know.
The active population (25–65) is shown to have higher levels of financial knowledge than those who are younger or older, which is consistent with other studies (e.g., Lusardi and Mitchell, Reference Lusardi and Mitchell2011). This result is also consistent with recent theoretical models based on human capital accumulation, which show that the level of financial knowledge has an inverse-U-shape with regard to age (Jappelli and Padula, Reference Jappelli and Padula2013).
The question about inflation was answered correctly by 77% of the entire population and 78% of those ages 25–65. These percentages again fall in the upper half (median 70%, maximum 86%) when compared with other countries that participated in the OECD study. US respondents had a lower overall score for the inflation question: 64% for the entire population and 68% for those ages 25–65. In the USA, the share of ‘do not know’ answers was more than twice the share in Finland.
The question about risk and diversification was answered correctly by 66% of Finns overall and 68% of Finns between the ages of 25 and 65. Although the Finnish question had a reverse pattern of the correct answer (i.e., false was the correct response), the Finns scored highest of any country in the OECD comparison. In the USA, 52% of the entire sample and 56% of the respondents between the ages of 25 and 65 provided the correct answer. In the USA, approximately one-third said that they did not know the answer, whereas the figure was around 10% for the Finnish Survey.
The responses to the core questions are intercorrelated. Answering one question correctly tends to increase the probability of answering other questions correctly. In the Finnish survey, more than one-third of the respondents answered all the questions correctly (36% for entire sample and 39% for those ages 25–65). In addition, the questions regarding savings, i.e., interest and inflation, were both answered correctly by 48% of the entire sample and by 51% of the narrower age bracket. These figures are very close to those reported in the USA by Lusardi and Mitchell (Reference Lusardi and Mitchell2011). Approximately 10% did not answer any questions correctly. However, the share of respondents with at least one ‘do not know’ answer was much higher in the USA than in Finland (42% and 14%, respectively, for the total population).
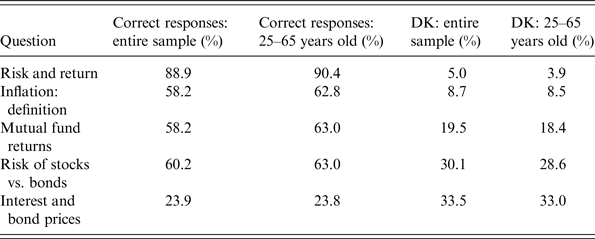
To extend the scope of the analysis, we also added numerous questions to the survey. These questions were largely based on previous literature, and they appear in Appendix 2. The questions related to the relationship between risk and return, as well as the definition of inflation, were based on the OECD questionnaire from the pilot exercise in 2010/2011 (reported in OECD, 2013). However, in the question about the definition of inflation, the statement was changed, such that the correct answer to the question was false instead of true, as in the OECD questionnaire. The questions that relate to mutual fund returns, the riskiness of stocks vs. bonds, and the impact of interest rate changes on bond prices are inspired by those in Van Rooij et al. (Reference Van Rooij, Lusardi and Alessie2011a, Reference Van Rooij, Lusardi and Alessieb), although small changes have been made to the wording. The last three questions are more related to stock market investments and thus require more sophisticated knowledge than the core questions. We call this enlarged set of questions the ‘extended financial literacy index.’
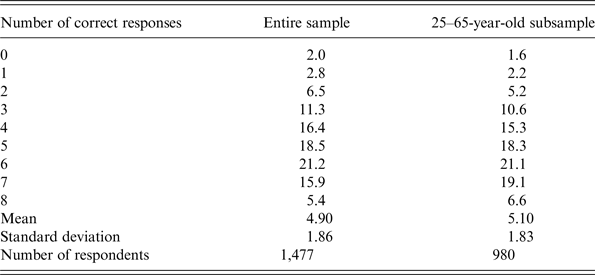
The responses to the additional questions are reported in Table 3. The number of correct responses for these questions and for the core questions is rather similar, except for the last one (bond pricing). The number of ‘do not know’ responses is also markedly higher for the investment-related questions than for the core questions. Table 4 presents the distribution of the index values. The mean value of the index is 4.9 for the entire sample and 5.1 for the 25-to-65 age group. For both groups, the median is 5, and the mode is 6. A rather small proportion of respondents (5.4%) answers all eight questions correctly.
Responses to additional financial literacy questions (percentages)

Note:
(1) Sample weights have been taken into account in the calculation of the frequencies.
(2) Number of observations=1477.
(3) DK, do not know.
Frequencies of the responses to the extended financial literacy index (percentages)

Note: Sample weights have been taken into account in the calculation of the frequencies.
Who are the financially illiterate?
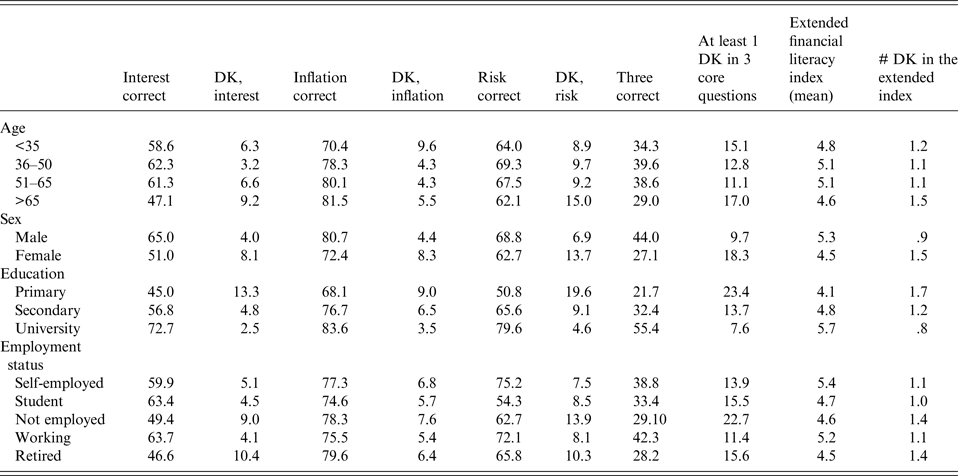
Mounting evidence shows that the levels of financial literacy are unequally distributed, and this distribution depends on the observable characteristics of individuals. In what follows, we examine who is financially literate and who has more problems in this regard. In Table 5, the answers to the three core financial literacy questions have been broken down by respondents’ different socio-economic characteristics. We also include the means of the extended financial literacy index in the table. When observing the differences between age groups on a more detailed level, with regard to both the interest rate and the risk questions, the highest share of correct answers are among those between 36 and 50 years of age. This finding is again in line with the predictions from Jappelli and Padula's (Reference Jappelli and Padula2013) model. Respondents younger than 35 and older than 65 clearly have a lower level of knowledge.
Distribution of responses to financial literacy questions by age, sex, education, and employment status (percentages)

Note:
(1) Sample weights have been taken into account in the calculation of the frequencies.
(2) Total number of observations is 1,477.
(3) DK, do not know.
The inflation question provides an interesting exception to the overall pattern. The share of correct answers is the highest among those older than 65, of whom 82% answer correctly. As inflation was a common phenomenon when Finland had its own currency, being well over 10% on average in the 1970s and early 1980s, the older population has more knowledge about it, as reflected in the age distribution of correct answers to the inflation question. Since joining the Euro in 1999, the inflation rate in Finland has hovered around 2–3% on average.
When we observe gender differences, we see that women clearly have a lower level of financial knowledge than men in Finland, both in core questions and in the extended index. This finding is in line with the situation in other countries that report female respondents’ lower level of financial knowledge. In the 2011 OECD study, this gender disparity was observed in 13 countries, with Hungary being the only exception (Atkinson and Messy, Reference Atkinson and Messy2012). Bucher-Koenen et al. (Reference Bucher-Koenen, Lusardi, Alessie and van Rooij2017) review the evidence for a number of countries and note that with the exceptions of Russia, Romania and East Germany, there is a notable gender gap in financial knowledge in various countries.
In the Finnish survey, the share of those who answered all three questions correctly was markedly higher for men (44% of men vs. 27% of women). In addition, 18% of women had at least one ‘do not know’ answer in the three core questions, whereas only 10% of men had at least one ‘do not know’ answer. The average number of ‘do not know’ answers in the extended financial literacy indicator was 1.54 for women and only 0.85 for men.
The Finns’ educational attainment was broken into three levels: primary, secondary, and university education. Consistent with other studies, this study shows a strong correlation between the level of education and financial knowledge. Among those with university education, 55% answered all three questions correctly, but the figure was just 22% among those with primary education. In addition, 23% of those with primary education had at least one ‘do not know’ answer. The figure for those with university education was 8%. The results are similar when observing the answers for the extended index.
Employment status also produces differences in financial knowledge. With regard to the interest and risk questions, the self-employed have the highest share of correct answers. However, the inflation question mirrors the age profile; 82% of retirees answer the inflation question correctly. Across all the questions, the lowest level of financial knowledge is consistently among those who are unemployed or those who are retired. These results are in line with the US results. The OECD survey did not measure employment status; however, using income as a proxy, we find that higher levels of income indicate higher levels of financial knowledge in almost all countries (Atkinson and Messy, Reference Atkinson and Messy2012).
Self-assessed financial literacy level
A person's self-assessment of his/her capability to understand financial issues can overstate or understate his/her actual level of financial knowledge. High confidence with low actual knowledge can lead to erroneous behavior in financial markets (Glaser and Weber, Reference Glaser, Weber, Baker and Nofsinger2010). To study the possible discrepancy between a person's self-reported ability and his/her actual knowledge, the Finnish Survey asked respondents to evaluate their level of financial ability using the following question.Footnote 10
Self-assessment question
‘How do you estimate your own ability to make good financial decisions? Evaluate your ability on a scale of one to five. A score of five is ‘fully adequate,’ and a score of one is ‘totally inadequate.’’
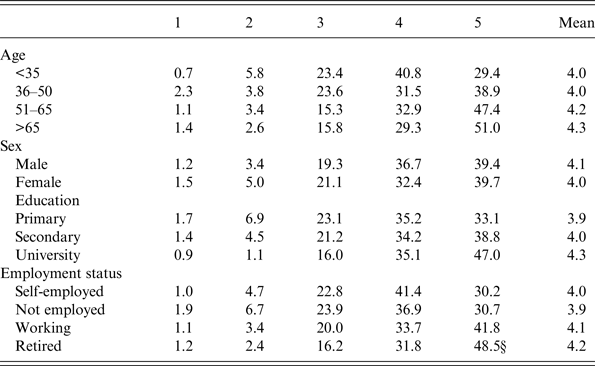
The results are reported in Table 6. On average, when people assess their ability to make good decisions, they give themselves high scores. The average score is 4.1 out of 5. Females give themselves an average score of 4.0, whereas males give themselves an average score of 4.1. Moderate variability exists across different socio-economic groups. For example, marked differences exist in the self-reported financial decision making between those with primary education and those with university education. Those with only primary education have an average self-assessment of 3.9, while the mean score of those with university education is 4.3. The self-assessment score also increases with age and those older than 65 rate themselves highest (4.3/5). The highest discrepancy between actual knowledge and self-assessed ability is found in retired persons.
Distribution of responses to self-reported financial decision-making capability questions by age, sex, education, and employment status (percentages)

Note:
(1) Sample weights have been taken into account in the calculation of the frequencies.
(2) Total number of observations is 1,477.
In other studies, indirect evidence shows that a gap exists between actual and perceived financial literacy (Lusardi and Tufano, Reference Lusardi and Tufano2015). In Finland, markedly low correlations exist between actual financial literacy and perceived financial ability: the correlation between the number of correct answers to the three core questions and perceived financial ability is only 0.08. The correlation between extended financial literacy and perceived financial ability is also low at 0.10. This low correlation may indicate that in Finland, where social security provisions are extensive, respondents perceive that high financial literacy is not required to make good financial decisions.
Financial literacy and retirement planning
Planning for retirement
Whether to plan and save for retirement is arguably one of the key variables in sound long-term financial behavior. An important question is whether this decision is influenced by the person's level of financial literacy.
The question regarding the relationship between financial literacy and behavior is a pertinent one. Contradictory evidence exists about whether a higher level of financial knowledge leads to more sustainable financial behaviors, even if enforced with financial education (Ambuehl et al., Reference Ambuehl, Bernheim and Lusardi2014). Other factors in the human psyche, such as emotions, might influence financial decision making more than rational thought (Taffler and Tuckett, Reference Taffler, Tuckett, Baker and Nofsinger2010). An area that seems to have an impact on financial behavior is attitudes toward money and consumption. Evidence from behavioral economics also shows that people might have problems with long-term financial planning, regardless of their level of financial knowledge (Wilkinson, Reference Wilkinson2008).
Jappelli and Padula (Reference Jappelli and Padula2013) develop a human capital model for financial literacy. In their model, people decide how much to invest in financial literacy. The incentive to invest concerns the possibility of earning higher returns on wealth. The cost of acquiring financial literacy skills is the current consumption lost, and the stock of financial literacy depreciates over time. The model predicts that different individuals have different levels of financial literacy and that financial literacy and wealth are positively correlated over the life cycle.
Their model implies that people have little incentive to invest in financial literacy in countries that provide extensive social security – such as public pensions; however, in less generous states, in which people are more responsible for their financial affairs, the incentives are stronger. Jappelli (Reference Jappelli2010) notes that the type of social security system should be considered when comparing different countries and their levels of financial literacy and saving decisions.
In a subsequent paper, Jappelli and Padula (Reference Jappelli and Padula2013) derived a human capital model to explain the incentives for investing in financial literacy. When testing their model with IMD World Competitiveness Yearbook indicators, they found support that states with generous pension systems have lower levels of financial literacy.
Numerous country-specific studies on the effect of financial literacy on retirement planning provide contradictory results. Therefore, in line with the Jappelli and Padula (Reference Jappelli and Padula2013) model, the structure of the pension system arguably influences people's willingness to learn financial literacy skills. Some supporting evidence can also be found in the studies concerning financial literacy and retirement.
In the USA (Lusardi and Mitchell, Reference Lusardi and Mitchell2011), a relationship seems to exist between financial literacy and retirement planning. Further support for the relationship has also been found in Japan (Sekita, Reference Sekita2011), Italy (Fornero and Monticone, Reference Fornero and Monticone2011; Ricci and Caratelli, Reference Ricci and Caratelli2017), Germany (Bucher-Koenen and Lusardi, Reference Bucher-Koenen and Lusardi2011), the Netherlands (Alessie et al., Reference Alessie, Van Rooij and Lusardi2011; Van Rooij et al., Reference Van Rooij, Lusardi and Alessie2011b), Chile (Garabato Moure, Reference Garabato Moure2016), and Canada (Boisclair et al., Reference Boisclair, Lusardi and Michaud2017). However, another study using German data (Pahnke and Honekamp, Reference Pahnke and Honekamp2010) finds that financial literacy leads to greater retirement planning only in high-income households.
In contrast with these studies, the results for Sweden (Almenberg and Säve-Söderbergh, Reference Almenberg and Säve-Söderbergh2011a) and New Zealand (Crossan et al., Reference Crossan, Feslier and Hurnard2011) show that the basic financial literacy questions do not explain retirement planning. Both states have extensive public pension systems in place.
One additional complication in comparing these results is the nature of the question used to measure ‘retirement planning.’ The most commonly used question asks whether the person has tried to estimate how much to save or has been planning to save for retirement (Almenberg and Säve-Söderbergh, Reference Almenberg and Säve-Söderbergh2011a; Bucher-Koenen and Lusardi, Reference Bucher-Koenen and Lusardi2011; Crossan et al., Reference Crossan, Feslier and Hurnard2011; Lusardi and Mitchell, Reference Lusardi and Mitchell2011).
Depending on the structure of social benefits, special groups might exist within a country that need to engage in retirement planning more than other groups. For example, in Finland, two groups need to estimate their contributions. First, the self-employed have to declare their earned income each year to calculate the required statutory pension contribution according to Entrepreneurs Pension Act. Second, those who have short or broken work histories might need to top-up their statutory pensions with voluntary pension policies. Usually, these women have been out of the labor force for family reasons.
To study the impact of financial literacy on retirement planning, the Finnish Survey included a standard question that is also found in the U.S. NFCS:
Planning for retirement
‘Have you ever tried to determine how much you should save for retirement?’ Responses: Yes/No/Cannot say.
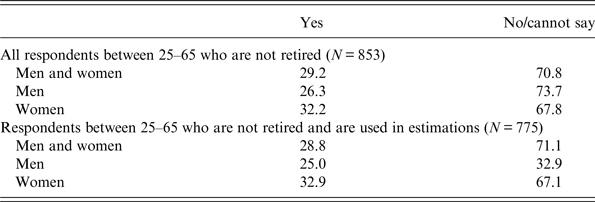
Out of 861 non-retired respondents between the ages of 25 and 65, 853 answered the question. Those who said that they had attempted to determine how much they should save for retirement were clearly in the minority (only around 29%). In the U.S. NFCS, this figure was markedly higher (43%). Finland has a national pension system and a statutory occupational pension system, which, to a certain extent, reduces the need for detailed planning. In Table 7, we present the distribution of planners and non-planners separately by gender. Regardless of whether we look at all 853 respondents who answered this question or the 775 observations that we were able to use in the estimations, there is a clear gender difference, with women being more likely than men to respond affirmatively to the retirement planning question.
Retirement planning: Have you ever tried to determine how much you should save for retirement?: percentages of respondents

Note:
(1) The number of observations used in estimations is smaller than the number of all eligible persons responding to this question because of missing values in some explanatory variables.
(2) Sample weights have been taken into account in the calculation of frequencies.
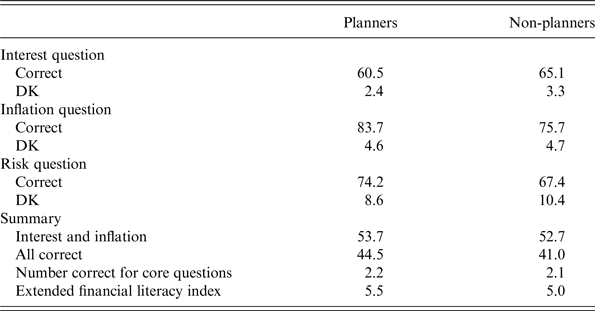
In Table 8, the responses of planners and non-planners to financial literacy questions are presented, using the 775 observations we use in the regression analysis.Footnote 11 Planners have a higher share of correct responses to the risk and inflation questions, but non-planners have a higher share of correct responses to the interest question. Planners tend to have a somewhat lower share of ‘do not know’ answers, and they have a higher score for the extended financial literacy index. When compared with similar data reported in Lusardi and Mitchell (Reference Lusardi and Mitchell2011), the differences between planners and non-planners are far less pronounced in Finland than in the USA.
Financial literacy of planner and non-planners: ages 25 to 65 (percentages)

Note:
(1) Sample weights have been taken into account in the calculation of the frequencies.
(2) Number of observations = 775.
(3) DK, do not know.
Regression model of planning and financial literacy
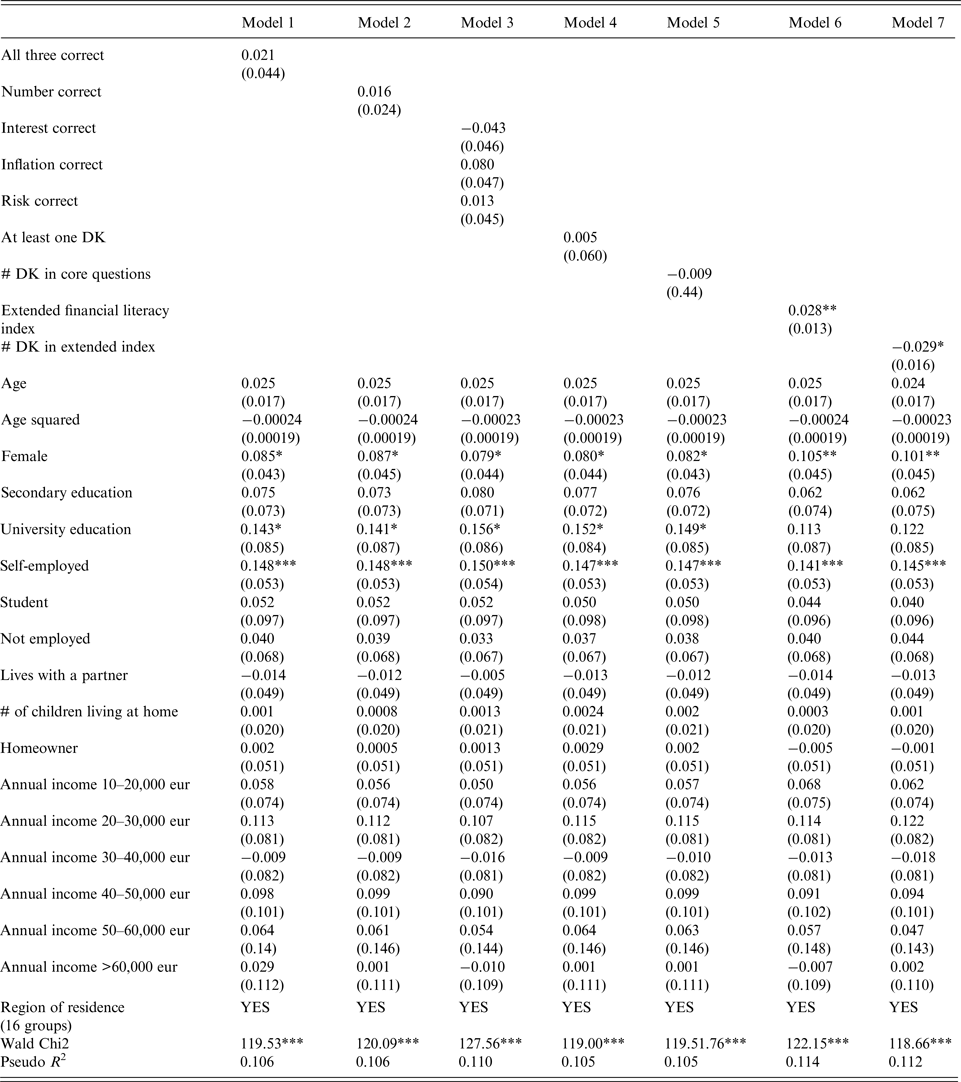
In Table 9, we present results from a set of probit regression using the survey weights and concentrating on respondents that were between 25 and 65 years of age.
Retirement planning and financial literacy: probit estimates for the age group 25–65

Notes:
(1) The dependent variable takes a value of one if the respondent reports to have planned for retirement savings, and zero otherwise. The reported coefficients are marginal effects on the probability of the dependent variable taking a value of one.
(2) The reference categories are male, primary education, wageearner, single (including widowed and divorced), and having an annual income below 10,000 euros.
(3) Sample weights have been taken into account in the estimations.
(4) The number of observations is always 775. The estimations include respondents in the age group 25–65 years who have not retired.
(5) DK, do not know.
(6) Levels of significance: *** 1%; ** 5%; * 10%.
In these estimations, retirement planning is used as a dependent variable, and different combinations of financial literacy questions and various socio-demographic explanatory variables are used as explanatory variables. Table 9 presents the coefficients for the full set of control variables (except for the 16 regional controls).
Models 1–5 rely on the use of the three core questions. Model 1 examines whether correct answers for all three core questions are statistically significant in explaining retirement planning. In Model 2, the number of correct answers to these three questions is analyzed; in Model 3, each question is evaluated independently. In Models 4 and 5, we change our strategy concerning the explanatory variable and use the number of ‘Do not know’ responses as (reverse) measures of financial literacy. In particular, in Model 4, we use the presence of at least one ‘Do not know’ response to the three core questions as the explanatory variable. In Model 5, the dependent variable is the number of ‘Do not know’ responses to the three core questions.
Finally, in Models 6 and 7, we rely on the extended index of financial literacy. In Model 6, we use the number of correct answers to the extended index as the main explanatory variable, and in Model 7, we use the number of ‘Do not know’ responses to the extended index.
From Models 1–3, we find that the three core financial literacy questions do not appear to explain retirement planning after the set of control variables is taken into account. The same applies to Models 4 and 5, where ‘Do not know’ responses are used as the dependent variable. The absence of evidence in support of the relationship between financial literacy and retirement planning conflicts with the results of Lusardi and Mitchell (Reference Lusardi and Mitchell2011) and numerous other studies (e.g., Bucher-Koenen and Lusardi Reference Bucher-Koenen and Lusardi2011; Sekita Reference Sekita2011). However, the results are in line with similar types of estimations performed in Sweden by Almenberg and Säve-Söderbergh (Reference Almenberg and Säve-Söderbergh2011a) and in New Zealand by Crossan et al. (Reference Crossan, Feslier and Hurnard2011), in which no statistically significant relationship is found between correctly answering all or some of the questions and retirement planning.
However, in Model 6 we find a statistically significant relationship between the extended financial literacy index and retirement planning. A one-point increase in the index increases the probability of planning for retirement by an estimated 3 percentage points. In addition, the number of ‘Do not know’ responses to the extended index is related to retirement planning at the 10% level of statistical significance (negatively, as fewer ‘do not know’ responses are associated with a higher propensity to plan for retirement savings). The result of having a statistically significant relationship between the extended index and retirement planning – though not between the core questions and retirement planning – is similar to the results found in Sweden by Almenberg and Säve-Söderbergh (Reference Almenberg and Säve-Söderbergh2011b).Footnote 12 Van Rooij et al. (Reference Van Rooij, Lusardi and Alessie2011b) also find a positive relationship between a similar index and relationship planning; however, in the Netherlands, the result is also robust using the three core questions (Alessie et al., Reference Alessie, Van Rooij and Lusardi2011).
Only a few coefficients are statistically significant. However, the variables are jointly highly significant (based on the Wald Chi-squared test); as such, the reason for the lack of significance is likely to be the multicollinearity among the variables. One variable that is consistently significant and positive is being female. Women often have more atypical employment relationships and thus need to be more attentive on pensions, which may explain this finding. The self-employed dummy is also positive and highly significant. Compared with wage earners, the self-employed are more responsible for their pension decisions in Finland. Having a university degree is also mostly positively associated with retirement planning.
Financial literacy, retirement planning, and gender
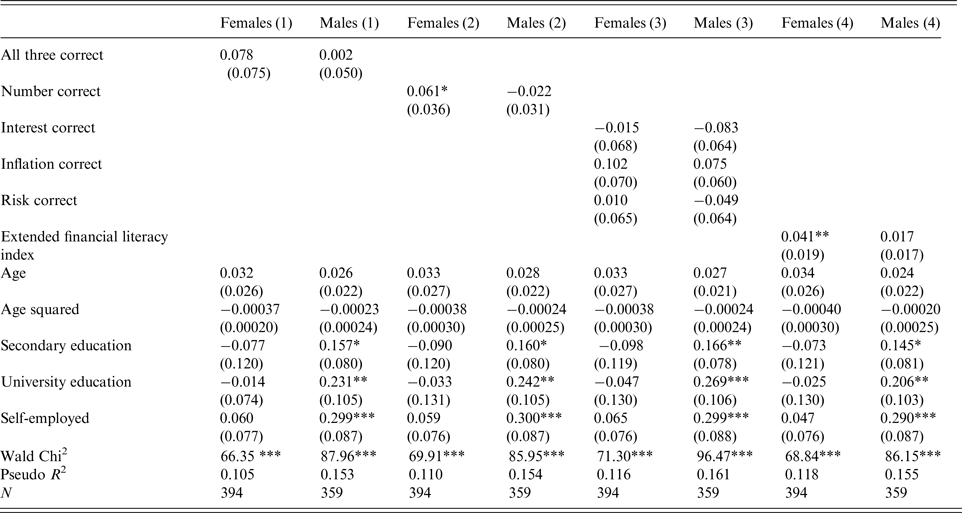
Next, we continue by testing whether the relationship between financial literacy and retirement planning differs by gender. Bucher-Koenen et al. (Reference Bucher-Koenen, Lusardi, Alessie and van Rooij2017) suggest that, even though women in most countries have lower financial literacy than men, they might actually need higher levels of financial literacy. Women live longer than men and thus have longer retirements. Barr (Reference Barr2013) shows that, in Finland, the pensioners who are most likely to be living in poverty are women who live alone (single, widowed, or divorced). In addition, women have, on average, lower labor market attachment than men. In Finland, family leave is relatively generous, and a parent can stay at home caring for a child for up to 3 years (per child) without losing employment. This option is usually taken by the mother (instead of the father); therefore, the system contributes to the shorter and more interrupted careers of women compared with those of men.Footnote 13 For all these reasons, the role of financial literacy in pension planning might be more pronounced in women than in men.
In Table 10, we present the results from a model in which we separately estimate the determinants of retirement planning for men and for women. The point estimates of the effect of financial literacy on retirement planning are consistently higher for women than for men. The coefficients are statistically significant for women in the case of the number of correct responses to core questions and to questions in the extended financial literacy index; however, for men, financial literacy measures are never significant. These results support the hypothesis that financial literacy is more important for women's retirement planning, possibly because women have lower attachment in labor markets and thus may face more retirement problems than men do.
Retirement planning and financial literacy: separate estimates for women and men

(1) The dependent variable takes a value of one if the respondent reports to have planned for retirement savings, and zero otherwise. The reported coefficients are marginal effects on the probability of the dependent variable taking a value of one.
(2) The model includes controls for living with partner, student status, being not employed, the number of children living at home, home ownership, income groups (6 indicator variables), and region of residence (16 indicator variables). The reference categories are male, primary education, wage earner, single (including widowed or divorced), and having an annual income below 10,000 euros. The full specification is similar to the one presented in Table 9.
(3) Sample weights have been taken into account in the estimations.
In addition, being self-employed is associated with more retirement planning only among men; for women, this result is not statistically significant. The self-employed may be a rather unusual group in many ways. For instance, earlier research has shown that the savings behavior of the self-employed might be rather different from that of the rest of the population (Hurst et al., Reference Hurst, Lusardi, Kennickell and Torralba2010). Therefore, including the self-employed in the regressions might bias the results. As a robustness check, we estimate the regressions presented in Table 9 by exclusion the self-employed. Their exclusion does not change the results in any way: the core questions remain insignificant in specifications (1)–(3), while the extended financial literacy measure continues to be significant and positive.Footnote 14
Conclusions
A Finnish Financial Literacy Survey from 2014 was used to measure the level of financial literacy among Finns and to compare their financial literacy to that in other countries. The level of financial literacy is shown to be relatively high among the Finns. In addition, the respondents felt confident about their self-assessed amount of knowledge. Women, the unemployed, low-income earners, and people with only primary education had problems in answering the questions correctly.
We analyzed the relationship between pension planning and financial literacy. In Finland, the statutory element in the pension system is pronounced, and private pension arrangements play a complementary role. In such an environment, the proportion of people who plan for their pensions can be expected to be lower than in countries in which individuals are more responsible for their pensions. The link between financial literacy and pension planning may be more elusive, as is the case with our data. Regression estimation using three core financial literacy questions failed to find a connection between financial literacy and retirement planning. However, a wider set of financial literacy questions showed a clear positive association between financial literacy and retirement planning.
We also find that the association between financial literacy and retirement planning is stronger for women than for men, a finding that is consistent with the idea that, due to their lower labor market attachment, women need to plan for their retirement more carefully than men do. Other evidence from Finland shows that women are especially vulnerable to poverty as retirees. The positive association between financial literacy and retirement planning found in women may be good news, as it suggests that improving financial literacy may be effective in promoting retirement planning for an especially susceptible group. On the other hand, we also found that women are much less financially literate than men; as such, the gender gap in financial literacy may also leave at least some women in a rather vulnerable position.
Many of the additional financial literacy questions were related to investments. Therefore, persons who have made sufficient human capital investments to become familiar with financial investment products are seemingly more likely to contemplate how to financially manage themselves during retirement. However, the direction of causality cannot be conclusively established due to the nature of the data.
The implications of generous social security benefits for the incentive to develop financial literacy skills are an area that calls for further research. If welfare states are cutting back on benefits and transferring responsibilities to the private sector, the citizens in these countries may be inadequately prepared to adapt to this kind of change. Therefore, developing financial literacy in these countries should be a high priority.
Acknowledgements
We thank Annamaria Lusardi for her support and mentoring when writing this paper and two anonymous referees for their helpful comments. We thank the Academy of Finland, the OP Research Foundation, the Foundation for Economic Education, the Finnish Financial Ombudsman Bureau, the Wage Earner Foundation, the Vaasa Aktia Foundation, and the Finnish Foundation for Share Promotion for their financial support, which has made this research possible.
Appendix 1: Alternative wording for the three core questions in the Finnish survey, the OECD survey and the U.S. NFCS.
1. Understanding the interest rate
The Finnish financial literacy survey
Suppose you put €100 into a savings account with a guaranteed interest rate of 2% per year. You do not make any further payments into this account, and you do not withdraw any money. How much would be in the account at the end of the first year, once the interest payment is made? In addition, how much would be in the account at the end of 5 years? Suppose no taxes are paid out of the interest and the interest rate is 2%. More than €110/Exactly €110/Less than €110/Do not know.
The OECD INFE survey
Suppose you put €100 into a <no fee> savings account with a guaranteed interest rate of 2% per year. You do not make any further payments into this account, and you do not withdraw any money. How much would be in the account at the end of the first year, once the interest payment is made? In addition, how much would be in the account at the end of the 5 years?
The U.S. NFCS
Suppose you had 100€ in a savings account, and the interest rate was 2% per year. After 5 years, how much do you think you would have in the account if you left the money to grow more than 102€/exactly 102€/less than 102€?
2. Understanding of inflation
The Finnish financial literacy survey
Suppose you put €1000 into a savings account with a guaranteed interest rate of 1% per year. The inflation is 2% annually. You do not make any further payments into this account, and you do not withdraw any money. In 1 year's time, will you be able to buy more than you can buy today/the same amount/less than you can buy today/do not know?
The OECD INFE survey
Imagine that five brothers are given a gift of €1,000. If the brothers have to share the money equally, how much does each one get? Now imagine that the brothers have to wait for 1 year to obtain their share of the €1,000 and that inflation stays at x%. In 1 year's time, will they be able to buy more/the same/or less?
The U.S. NFCS
Imagine that the interest rate on your savings account was 1% per year and that inflation was 2% per year. After 1 year, would you be able to buy more than/exactly the same as/or less than today with the money in this account?
3. Understanding risk and diversification
The Finnish financial literacy survey
When you invest in a wide range of stocks, you usually have a higher risk of decreasing the value of your investment than when you invest only in one stock. True/false/do not know.
The OECD INFE survey
Reducing the risk of investing in the stock market is usually possible by buying a wide range of stocks and shares. True/false/do not know.
The U.S. NFCS
Do you think that the following statement is true or false? ‘Buying a single company stock usually provides a safer return than a stock mutual fund.’
Appendix 2: Additional questions in the Finnish financial literacy survey (correct answer in bold).
An investment with a high return is likely to be a high-risk investment. True/false/do not know.
High inflation means that the cost of living is decreasing rapidly. True/false/do not know.
Mutual funds have a sure yield that depends on their previous yield. True/false/do not know.
In the long term, the value of stocks is more volatile than the value of bonds. True/false/do not know.
When the general level of interest increases, the value of bonds increases as well. True/false/do not know.