


Introduction
Consequences of changes in the climate system for the cryosphere at a regional scale are of special interest to people living in mountain areas. Indeed, changes in mountain cryospheric processes lead to massive landscape changes: not only permafrost and glaciers are involved, but also the water balance, snow-cover characteristics and growth conditions of the vegetation which are affected directly as well as indirectly through various feed-back mechanisms. There is a corresponding impact on the socio-economic conditions of people living in mountain areas, especially concerning tourism, one of the major sources of income in such areas. In addition, reduced slope stability could increase the hazard potential from rock slides and debris flows. Spatial modelling of glacier and permafrost occurrence in mountain areas as a function of climatic parameters could contribute to the early recognition of sensitive and sometimes dangerous areas.
Despite the still limited understanding of the complex processes involved, especially concerning the interactions between the atmosphere and mountain permafrost, an attempt is made to model permafrost distribution and glacier size in high mountain areas. The applied parameterization is built on a combination of empirical knowledge and physical considerations.
Investigations of the impact of atmospheric warming on permafrost should consider all the complex interactions between climate, microclimate and surface temperature. Regions in the discontinuous permafrost, with ground temperatures close to melting point, can be very sensitive to climate change (Reference Thie.Thie, 1974). A climate change not only results in an increase of air temperature; precipitation, especially variations in snow-cover thickness and duration, can also lead to considerable changes in permafrost distribution. At depth, or if thick ice is present, the thermal reaction of the ground is strongly delayed with respect to changes in the atmosphere so that the response of permafrost is slow. Especially important is the ice content in the ground which delays the warming through latent heat of fusion involved with the melting or freezing process (Reference Smith and Riseborough.Smith and Riseborough, 1983). Simple models and scenarios can nevertheless help to locate areas where near-surface changes in permafrost conditions may lead to such problems as thaw settlement, rock slides or debris flows.
In the area of the Upper Engadin (eastern Swiss Alps), discontinuous mountain permafrost and (mainly temperate, but in the ablation area slightly cold) glaciers exist in close proximity. An attempt to estimate roughly the change of both phenomena is made by assuming step changes between steady-state conditions as a first approximation.
Basic Assumptions
The parameterizations are based on available knowledge about the relation between climate and permafrost distribution in the Alps and on continuity considerations for glaciers. Equilibrium conditions are assumed throughout, i.e., non-stationary transitions were disregarded. A simulated perturbation was introduced with the change of one parameter only, in this ease the mean annual air temperature. Full adjustment to such a perturbation is reached after a certain response time. The response time for mountain glaciers as given by the ratio between maximum ice depth and ablation at the terminus is typically a few decades (Reference Haeberli. and Hoelzle.Haeberli and Hoelzle, 1995). The response time for permafrost, on the other hand, depends on the thermal conductivity, ice content and thickness of frozen ground (Reference OsterkampOsterkamp, 1983); for relatively warm and thin discontinuous permafrost it is typically measured in decades to centuries (Reference Haeberli.Haeberli, 1990). The models used in the present study take into account neither such long-term response at greater depth below surface nor any feed-back mechanisms, and all climatic and surface parameters other than air temperature are kept unchanged. Such assumptions are quite unrealistic in nature. The corresponding model calculations nevertheless furnish important information about the sensitivity of the system and give interesting hints of especially sensitive areas.
Scenarios and Database
Four different steady-state conditions are used in this study: two for the future, one for today and one for the past. The future scenarios are based on scenario A of the Intergovernmental Panel on Climate Change (Reference Houghton, Jenkins and EphraumsHoughton and others, 1990; cf. Swiss National Science Foundation, unpublished) which assumes mean annual air temperature in the years 2025 and 2100 to be 1.3° and 3°C higher than today. For the past scenario, a mean annual air temperature 0.6°C lower than today is assumed. Precipitation changes are not included at this stage.
The database for the regional existence of permafrost contains a large sample (Reference Hoelzle, Haeberli and Keller.Hoelzle and others, 1993) of bottom temperatures of the winter snow cover (BTS), which can be used as a good indicator of permafrost distribution (Reference Haeberli. and Patzelt.Haeberli and Patzelt, 1983; Reference Keller. and Gubler.Keller and Gublcr, 1993). For the glaciers the database is taken from a glacier inventory in this region recently updated by Reference Maisch.Maisch (1992; cf. Reference Müller, caflisch and Müller.Müller and others, 1976).
Modelling Permafrost Distribution and Glacier Size
Permafrost
Models developed in the Swiss Alps to estimate distribution patterns of discontinuous mountain permafrost are based on empirical considerations (Reference Haeberli.Haeberli, 1975; Reference Keller.Keller, 1992). In order to improve the physical basis for such estimates, the following new model was developed (Reference Hoelzle, Haeberli and Keller.Hoelzle and others, 1993) to simulate supposed permafrost distribution as a function of digital terrain information.
The more than 700 regionally available BTS measurements, representing the occurrence or absence of permafrost, are related to climatic factors. Therefore, mean annual air temperature was estimated for each BTS point using climate-station records together with a lapse rate of 0.56°C per 100 m for the Upper Engadin and 0.6°C per 100 m for the other areas (Reference GenslerGensler, 1978). In the same way, potential direct solar radiation (average daily means for the snow-free season, July-October) was calculated (Reference Funk. and Hoelzle.Funk and Hoelzle, 1992) on the basis of a digital terrain model (DTM). The BTS measurements were then grouped into eight temperature classes from −8° to 0°C with steps of 1°C. In this way, a correlation between BTS and potential direct solar radiation (r 2 – 0.86), but not between mean annual air temperature and BTS (r 2 = 0.002). was found (Reference Hoelzle.Hoelzle, 1992). This result emphasises the importance of short-wave direct solar radiation as the main variable local-scale energy source (Reference Hoelzle.Hoelzle, 1994) and also means that permafrost can exist at low-altitude sites as well, even at places where mean annual air temperature is positive if solar radiation is strongly reduced. From ground temperature measurements in shallow boreholes, BTS measurements, DC resistivity and seismic soundings (Reference BächlerBächler, 1930; Reference Pancza.Pancza, 1988; Reference Vonder MühllVonder Mühll, 1993; paper in preparation by G. Wegmann), such low-altitude permafrost sites are, indeed, known to exist in the northern Swiss Alps and the Jura mountains. Inclusion of such low-altitude permafrost sites considerably enlarged the altitude range of documented permafrost occurrence and enabled the limit of permafrost existence (BTS between −2°C and −3°C) to be described as a function of the two most important climatic factors, i.e. potential direct solar radiation and mean annual air temperature (Reference Hoelzle, Haeberli and Keller.Hoelzle and others, 1993; cf. Fig. 1). Although the relation may, in reality, be nonlinear, a linear model is used as a first approach in the investigated area. It should be kept in mind that the statistical relation used is locally calibrated and needs further testing for application in other areas.
Relation between potential direct solar radiation (PR) and mean annual air temperature (MAAT) al the limit of permafrost existence (BTS between −2° and -3°C: possible permafrost). The numbers represent the count of measurements. The symbols indicate mean values (PR and MAAT) in the given BTS class for altitude intervals of 100 m. Double bars represent the range where indications of permafrost presence (BTS < −3°C) and absence (BTS > −2°C) overlap.

The uncertainty with respect to estimates of mean annual air temperature is about +0.5° to +0.6°C. The model obviously works well for steep slopes, but is less reliable at the foot of slopes because the effects from long-lasting accumulations of avalanche snow are not considered. The error range of the BTS measurements is about +0.5°C. All BTS values are corrected for a standard snow-cover thickness of 1 m (Reference Haeberli. and Epjfani.Haeberli and Epifani, 1986) so that the influence of the snow-cover variability existing in Nature is essentially eliminated in the model. Areas with snow-cover thicknesses of less than 0.8 m, such as, for example, rock walls, are thus probably colder than indicated by the applied relation. The simulations are highly sensitive with respect to the resolution of the DTM Tor calculating potential direct solar radiation. Higher resolution of the DTM with more precise determination of the surface topography leads to considerable improvements (see below).
For the different scenarios, the following changes in mean annual air temperature and local limit of permafrost occurrence were used:
Scenario I = -0.6°C = -100 m (decrease)
Scenario II = 0.0°C = 0 m
Scenario III = +1.0°C = + 170m (increase)
Scenario IV = +3.0°C = + 500 m (increase)
DTMs with two different mesh widths exist for the investigated area. One DTM was digitized from a 1: 25 000 map and interpolated to a regular 25 m grid. The other one is taken from a DTM for the whole of Switzerland (Rimini) with a mesh width of 100 m. For both DTMs, four simulations were made with the above-described scenarios. A comparison of the simulations with the different grid resolutions gives differing results. Considering permafrost distribution as a percentage of the whole investigation area, the DTMs with 100 and 25 m mesh width show differences between each scenario, which can reach up to 19% of the total permafrost area (see Table 1). These rather large differences can be explained by the quite different precision of the calculated potential direct solar radiation. Surface topography is much better represented in the 25 m than in the 100 m grid. More than 200 BTS measurements in the area show that results based on the 25 m grid are much more precise and give a quite realistic approach for present-day conditions (Reference Hoelzle.Hoelzle, 1994). Permafrost distribution modelled with the 100 m grid generally tends to overestimate permafrost occurrence.
Areas with and without supposed permafrost for different scenarios and digital terrain models. PF, supposed permafrost; NP, no permafrost supposed; GL, glacier area. 100% means the whole area of the investigated region

Figure 2 shows the results of model simulations in the Corvatsch-Furtschellas area for the above-described scenarios I–IV based on the DTM with 25 m mesh width. The investigated area spans an altitude range of 1800–3500 m a.s.l. and has an area extent of 16 km2 with supposed permafrost underlying about 29% of the total area today. Table 1 lists the results for the different scenarios and the corresponding percentages of the supposed permafrost and permafrost-free areas. In Figure 2 and Table 1 an interesting point can be seen: it is possible that, although increased air temperature induces both glacier and permafrost melt, new permafrost can develop in formerly glacierized areas. For example, Table 1 indicates that the area with supposed permafrost is about 33% of the total area for scenario I; in scenario II the corresponding area is 29%, i.e. a reduction of only 4%. On the other hand, there is a decrease in glacier area of about 6% and most of this originally glacier-covered terrain will change now into permafrost area. Such a phenomenon can exist in reality as tested in one area with BTS measurements; permafrost can indeed be detected, but the permafrost aggradation could be due to the maintenance of a ski-run, inducing increased heat loss through compacted snow. Subglacial permafrost may exist beneath the margins of smaller vanishing glaciers which can be partly cold in the ablaiiton area (Reference Haeberli.Haeberli, 1975), but such occurrences are thought to be of limited extent. Concerning the region of the Upper Engadin, the change in permafrost area is calculated as −65% between scenarios II and IV.
Supposed area without permafrost (light grey) and supposed permafrost distribution (dark grey) in the Corvatsch-Furtschellas area, Upper Engudin, after a. scenario I (1850), with glacier area 1850 (black) reconstructed by Reference Maisch.Maisch (1992); b. scenario II (1990), with glacier area 1973 (black) close to the glacier extent of 1990 after Reference Maisch.Maisch (1992); c. scenario III (2025) showing glacier area 2025 (black), with glacier length calculated as described in the text, the area adjusted by hand; d, scenerio IV (2100), with no glaciers.

Glaciers
On the basis of a parameterization scheme (Reference Hoelzle.Hoelzle, 1994; Reference Haeberli. and Hoelzle.Haeberli and Hoelzle, 1995) for a database of 62 glaciers in the Upper Engadin region (catchment of the river Inn), different glacier characteristics are estimated. The database to which the parameterization is applied consists of the following data: area in 1850, area in 1973; length in 1850, length in 1973; altitude: maximum, median, minimum in 1850, minimum in 1973 (see Table 2). As a first step, volume decrease between 1850 and 1973 is assessed by deriving a step change in mass balance (δb) between two steady-state conditions, i.e. alter full dynamic response, from the incurred cumulative length change (δl) between 1850 and 1973 as determined from aerial photography, field investigations and available maps (Reference Maisch.Maisch, 1992), the mass balance at the terminus (b
t) and glacier length (L): δb ≈ δl · b
t/L. Values for δl of the investigated glaciers balance range between 0.5 and 2.0 km. The mass balance (ablation) at the tongue b
t, is determined by assuming a mass-balance gradient db/dh in the ablation area of 0.75 m a−1 per 100 m and considering the vertical extent between median and minimum altitude (dh
M): b
t, ≈ (db/dh) · dh
M, This parameter (b
t) induces the largest uncertainty of the estimation, because Alpine mass-balance gradients may vary within a range of 0.4–1.0 m a−1 per 100 m. The error range of mass-balance changes calculated for individual glaciers may, therefore, exceed ±30%. For the volume change, mean annual mass balance is calculated as
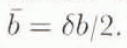 . The response time t
T, for each glacier is derived from the ratio between maximum thickness of the glacier (d
Max) and b
t: t
T ≈ d
Max (Reference Jóhannesson, Raymond and Waddinugton.Jóhannesson and others, 1989). One problem concerns the fact that the response time of each glacier does not exactly correspond for the mean mass interval. Therefore, two estimates for the mean mass balance
 were calculated (see Table 3). The first one
 is based on a theoretical count of response times for each glacier since 1850. This number probably represents the maximum number of full dynamic responses each glacier could have had since 1850. In reality, most glaciers had only one near-steady-state condition between 1890 and 1920. Hence, the second mean mass balance
 is based on two response times only. Determination of mean mass balance with these two approaches probably gives more or less the possible range of realistic mean secular mass balances for each glacier.
Selected glacier data from the inventory of Reference Maisch.Maisch (1992), which are the basis for the glacier parameterization in the Upper Engadin region.

Geotic–photogrammetric measurements covering long time periods show that the mean mass balance since about 1880 for six Alpine glaciers varies between −0.19 and −0.57 m w.e. a−1 (Reference Finsterwalder. and Renisch.Finsterwalder and Rentsch, 1981; Hacberli, 1991). Reference Assier.Assier (1993) reports a value for the secular mean mass balance for glaciers in the Southern Alps of −0.22 m w.e. a−1. The mean value from the present investigation of 62 glaciers in the Upper Engadin is
 and
 . For the larger glaciers in the area, where overall mass losses are less limited by glacier size, the range is slightly higher, i.e.
 and
 (Table 3). These calculated results agree quite well with the measured data. With the so-estimated mean mass balance and a mean area between 1850 and 1973, glacier mass loss in the Upper Engadin is estimated at −55% to −65% for the larger glaciers (Table 4), which in fact clearly dominate the sample of all glaciers: more than 90% of the estimated total volume in 1973 (62 glaciers) is contained in the nine selected larger glaciers.
Parameters calculated for the reconstruction concerning some larger glacier in the investigated area of the Upper Engadin.

Reconstruction of the volume change since 1850 with the estimation of two different mean mass balances

Looking into future glacier behaviour as a reaction to potential climate change, Reference Kuhn.Kuhn (1990) investigated different parameters and their influence on a possible ELA shift. This author concluded that the influence of air temperature, considering also feed-back mechanisms, on the shift of ELA for a temperature increase of ±1°C is about ± 170 m. Concerning the sensitivity of each glacier with respect to such an ELA shift, a rough distinction can be made between a climatic-regional- and a local-topography (hypsography)-caused part. The climatic-regional sensitivity is given by the mass-balance change, which can be expressed as the product of the mass-balance gradient db/dh and an ELA shift δELA δb ≈ δELA. (db/dh) (Reference Kuhn.Kuhn, 1981). With regard to the future existence/extinction of glaciers, the questions must be considered whether (1) anticipated length change for a given mass-balance forcing exceeds the present length, and/or (2) the ELA may shift over the highest altitude of the giacier. With ELA shifting upwards by 500 m, for instance, 59 of the 62 glaciers in the Upper Engadin region would disappear and only the higher parts of the three largest glaciers (Tschierva, Roseg and Morteratsch) could survive the 21st century, assuming scenario IV as defined above.
Conclusions
The new model for simulating permafrost occurrence enables more detailed calculations as well as the inclusion of low-altitude permafrost sites. However, parameterization of the inventoried glaciers is still based on better knowledge than exists with regard to mountain permafrost. A simple parameterization can be realised with some restrictions for large glacier-inventory data sets. As an example, mean annual mass losses of the glaciers in the Upper Engadin region are estimated at about −0.17 to −0.23 m w.e. a−1 for all glaciers, with a tendency to higher values for larger glaciers (−0.26 and −0.46 m w.e.a−1). Such values compare favourably with results from long-term measurements.
The sensitivity of the mountain cryosphere with respect to potential changes is investigated by applying Reference Houghton, Jenkins and EphraumsHoughton and others’ (1990) scenario A with respect to mean annual air temperature. The simulations show that important local-scale changes can occur in the mountain cryosphere: from 1990 to 2100, 65% of the permafrost area could start degrading and possibly only three out of 62 presently existing glaciers would survive this warming scenario.
The basis of such simulations needs considerable improvement. In particular, the relation between the atmosphere and the permafrost in mountain areas should be better understood. This can only be achieved with an intensive measurement programme concerning the energy-balance components involved.
Acknwledgements
The present study was carried out as part of the Swiss National Research Programme on Climate Change and Natural Catastrophes through project No. 4031-34232 with funds from the National Science Foundation. Special thanks are due to many colleagues of the Laboratories of Hydraulics, Hydrology and Glaciology at ETH Zürich for reviewing the manuscript.



