One of the most commonly referenced generalizations about congressional elections is attributed to Speaker of the House Thomas P. “Tip” O’Neill. According to the venerable Speaker, “All politics is local.” Of course, in the broad sense, this is far from the case. A vast body of research and evidence indicates that national political conditions greatly shape congressional vote decisions and election outcomes. Footnote 1 But in a strict sense, it and its companion generalization— all politics is short-term— are difficult to argue with. At least formally, elections are decided by the actions of individual voters expressed at the ballot box on Election Day (or thereabouts). To be of consequence, national and long-term considerations must influence the political decisions made in the here and now—local and current.
A HYBRID MODEL
This perspective on elections led me to develop the seats-in-trouble congressional election forecasting model. While national factors generally associated with the surge and decline of national political climates (A. Campbell Reference Campbell, Campbell, Converse, Miller and Stokes1966; J. Campbell Reference Campbell1997) and the impact of the referendum-like evaluations of presidential performance (Tufte Reference Tufte1975) substantially determine the broad outcome of midterm elections, many local considerations (candidates and issues) also come into play. These local factors are not always merely conduits for national conditions and, in any particular election (and forecasts are of particular election outcomes), they do not necessarily neatly cancel out with a party advantage in some districts offsetting the other’s advantage elsewhere. In the long run, these idiosyncratic local factors might be safely ignored as random noise, but forecasts are not of the long run.
The seats-in-trouble forecasting model is a hybrid model using an aggregate of expert ratings of individual congressional races and the statistical relationship of these aggregated ratings to the historical net seat swings for the parties. The premise of the model is that the expert ratings, although subjective, offer the most accurate reading of local political prospects for the parties. All of the various influences on congressional races, from presidential surge and decline effects to presidential referendum and policy-balancing effects to decisions of strategic politicians to biases in the electoral system’s conversion of votes into seats and anything else, should ultimately come together and be reflected in the assessment of individual races. These factors can then be accumulated into a big picture of how the election is shaping up.
The seats-in-trouble forecasts draw on The Cook Political Report’s ratings of House and Senate races from 1984 to 2012 in both on-year and midterm elections. The Cook Political Report, assembled by Charlie Cook and his team of congressional election experts, is one of the most highly regarded nonpartisan handicappers of congressional elections in the nation. Cook and his associates draw information from a wide array of sources to rate the election prospects of both parties’ candidates in every election at various points in each election cycle. Each race is rated on an eight-point scale: solid, likely, leaning, or a toss-up for each of the parties. To provide an adequate lead time for the forecasts, the target date for the ratings used in the forecast is in late August when they were available. Because The Cook Political Report’s ratings have been released on an irregular schedule over the years, ratings as early as late July and as late as the first day of September are used. Because ratings were not released within this time frame during the 1986 and 1990 midterms, those two elections were excluded from the forecast estimation.
My analysis of these individual ratings of House races in or around August of election years and their later election outcomes found that seats held by a party before the election were quite vulnerable to being lost in the election if they were rated as only “leaning” to the current party or worse (a toss-up or leaning, likely or solid for the opposing party). A party’s “solid” seats were nearly certain to be held by the expected party. A party’s “likely” seats were nearly as safe (typically 94% to 96% won by the expected party)(Campbell 2010a).
THE SEATS-IN-TROUBLE INDEX
An aggregate index of “seats in trouble” was constructed based on this evaluation of the individual district ratings (Campbell Reference Campbell2010b). The central elements of the index are the number of Democratic seats and the number of Republican seats (won by the party in the last election) that were rated as leaning to their current party, toss-ups, or actually favored to flip to the opposite party. These are each party’s number of seats that are vulnerable or “in trouble.” The index is the difference between the number of Democratic seats in trouble and the number of Republican seats in trouble. The seats-in-trouble model could easily be regarded as an extension of the exposure model developed by Oppenheimer, Stimson, and Waterman (Reference Oppenheimer, Stimson and Waterman1986). The exposure thesis examines the net number of seats that may be in trouble (the number above or below each party’s normal base). The seats-in-trouble index goes beyond the number of seats that may be in trouble to the number that are actually in trouble, at least as determined by The Cook Political Report. Footnote 2
This seats-in-trouble index was successfully used in models of House seat change to forecast the outcomes of the 2010 midterm and 2012 on-year elections. In 2010, a pair of forecast models using this index, one with a presidential approval measure and another with the number of seats already held by the party, predicted that Democrats would lose 51 or 52 seats, on the same order of their losses in the 1994 Republican breakthrough election. Democratic seat losses in that election actually extended a dozen seats beyond this, but the forecast was at the outer limit of losses in recent decades and, in that sense, was essentially correct in predicting the midterm landslide (Campbell Reference Campbell2010c, Reference Campbell2011). It along with only one other model (Bafumi, Erikson, and Wlezien 2010) predicted Democrats to lose more than 50 seats. In 2012, the two versions of the seats-in-trouble forecast model bracketed the eight-seat Democratic gain, each missing the mark by only five or six seats (Campbell Reference Campbell2012).
If the public thought that the president was not doing a good job, his party should have more seats rated as being in trouble. Similarly, if the potentially greater vulnerability of having to defend more seats exposes a party to greater losses or makes gains more difficult, this too should be reflected in the number of seats rated as being in trouble.
THE 2014 FORECASTS
For this year’s forecast, although the seats-in-trouble index is itself unchanged, there are two other changes. The first change simplifies the model to use only the index as a predictor. In reflecting on the earlier versions of the model, the equations appeared to have been over-specified by including the presidential approval measure or the current number of seats held by a party. There is no apparent reason to suspect that the effects of evaluations of a president’s job performance or the difficulty of gaining or losing seats because of the number already held would not already be reflected in Cook’s ratings. If the public thought that the president was not doing a good job, his party should have more seats rated as being in trouble. Similarly, if the potentially greater vulnerability of having to defend more seats exposes a party to greater losses or makes gains more difficult, this too should be reflected in the number of seats rated as being in trouble.
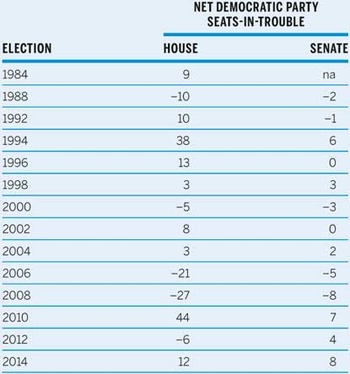
The second change to the seats-in-trouble forecast is the extension of the analysis to the Senate elections. The seats-in-trouble forecast approach in using expert evaluations would seem especially well suited to predicting high-profile contests in which candidates and local issues can make a big difference to the outcome. In Senate elections, I found that an index that counted only a party’s toss-up seats or worse was a more accurate gauge of vulnerability at the start of the campaign than one that also included seats leaning to the party currently holding the seat. This slightly more restrictive definition of seats in trouble is used for the Senate model. Table 1 presents the seats-in-trouble index value for the 14 elections since 1984 (excluding 1986 and 1990 as already noted. Only 12 elections are available for the Senate model since the Cook Report did not release Senate ratings in 1984 within the July to Labor Day time frame. In House elections, the index ranges from a high of 44 net seats in trouble for Democrats in 2010 to a low of -27 indicating that Republicans had 27 more seats in trouble than Democrats had in the 2008 election. In previous Senate elections, the index ranged from a high of 7 in 2010 to a low of −8 in the 2008 election.
Seats-in-Trouble Index for House and Senate Elections, 1984–2014

Note: The seats-in-trouble index counts a party’s seats as vulnerable if they are rated as leaning to the current party or worse in House races and toss-ups or worse in Senate races.
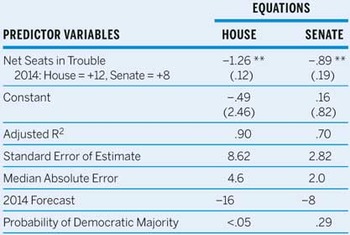
The seats-in-trouble forecast equations for both House and Senate elections are estimated in table 2. For House elections, the estimated equation indicates that for every four additional seats of a party evaluated as being “in trouble,” the party typically loses five seats. It is unclear whether this greater than one-to-one conversion of seats in trouble to seats lost reflects a dynamic that carries forward to the election (seats in trouble indicate more problems brewing), or losses in the categories that fall short of being judged as being in trouble in August, or a cautious streak in the Cook Report’s ratings. What is clear is that the index based on Cook’s ratings fits well with the history (albeit a relatively short history) of House seat change. The index accounts for 90 percent of the variance in House seat change during this period and the median error has been only about five seats. For Senate elections, using the slightly more restrictive measure, the seats-in-trouble equation indicates that a party typically loses about one seat for every seat judged as being particularly vulnerable in August. The Senate equation accounts for 70% of the variance in Senate seat swings. The median error in the Senate model was two seats. Footnote 3
The Seats-in-Trouble Forecasting Equations of Democratic Party Seat Change in the US House and Senate, 1984–2012

N=13 for House, 12 for Senate. **p<.01, one-tailed. Standard errors are in parentheses. The equations are estimated using data from 1988 and the 11 national elections from 1992 to 2012. Data availability permitted 1984 to be included in the House forecast, but not in the Senate. The median absolute errors are from within sample estimates.
In 2014, the seats-in-trouble forecasts indicate that Democrats are likely to lose about 16 seats in the House and 8 seats in the Senate. A gain of 16 for Republicans in the House would bring their numbers to 250 members, their largest majority since 1931. The forecasts are based on the Cook Report’s House ratings of August 8, 2014 that indicated that 26 Democratic seats and 14 Republican seats were vulnerable, a net of 12 favoring the Republicans. The Senate ratings of August 15 indicate 10 Democratic seats and 2 Republican seats were in trouble, giving Republicans a net advantage of 8 seats. Based on past errors in the forecasting equations, there is no realistic chance that Democrats will gain control of the House as a result of the 2014 midterm elections. Examining the strength of the Senate election, Republican prospects of being in the majority after the election are roughly 71%.