

Introduction
Arsenic is a commonly assumed or proven culprit of environmental problems, and therefore is a subject of anxious monitoring by public authorities and scientists. Indeed, arsenic has been shown to be abundant at mine sites and in contaminated soil profiles (e.g. Hebbard et al., Reference Hebbard, Wilson, Jowitt, Tait, Turvey and Wilson2017; Rahman et al., Reference Rahman, Clark, Yee, Comarmond, Payne, Kappen and Mokhber-Shahin2017; Drahota et al., Reference Drahota, Kulakowski, Culka, Knappová, Rohovec, Veselovský and Racek2018; Akopyan et al., Reference Akopyan, Petrosyan, Grigoryan and Melkomian2018; Gamble et al., Reference Gamble, Givens and Sparks2018; Cui et al., Reference Cui, Zhao, Li, Beiyuan, Tsang, Poon, Chan, Wang and Li2018), or in aquifers and rivers (e.g. Bozau et al., Reference Bozau, Licha and Ließmann2017; Shen et al., Reference Shen, Guo, Jia, Cao and Zhang2018; Bhowmick et al., Reference Bhowmick, Pramanik, Singh, Mondal, Chatterjee and Nriagu2018). There is less appreciation (by the public) of the fact that the mere presence of arsenic does not automatically present an acute health danger. It is the solubility and bioavailability of the arsenic that determines the level of threat, not just its presence. Solubility, at equilibrium with an aqueous solution, is a variable that can be determined and predicted from thermodynamic data. Arsenic is not only of interest because it raises a red flag due to its toxicity. The crystal chemistry of arsenic is particularly rich; even today, new arsenate structures are being synthesized and solved (e.g. Đorđević et al. Reference Đorđević, Gerger and Karanović2017; Schwendtner and Kolitsch Reference Schwendtner and Kolitsch2017; Alcantar et al. Reference Alcantar, Ledbetter and Ranmohotti2017; Krivovichev et al., Reference Krivovichev, Zhitova, Ismagilova and Zolotarev2018).
An integral component of the quest for better options for long-term disposal of arsenic-bearing waste, soils and sediments is the measurement and evaluation of thermodynamic data for various arsenates of common metals, such as iron or aluminium. If some of these could be shown to have lower solubility than the currently used options – i.e. scorodite (FeAsO4·2H2O) and As-bearing ferrihydrite (Riveros et al., Reference Riveros, Dutrizac and Spencer2001) – the practical sides (e.g. ease and economic viability of synthesis, kinetic inertness, filtration and dewatering) could be considered to utilize such a phase or phases for large-scale applications.
The thermodynamic properties of arsenic oxides, aqueous species and arsenates have been reviewed by Nordstrom et al. (Reference Nordstrom, Königsberger, Majzlan, Bowell, Alpers, Jamieson, Nordstrom and Majzlan2014). They prove that scorodite indeed is the phase with the lowest As solubility in most chemical systems. Other phases with low solubilities are mimetite and mimetite–pyromorphite solid solutions (Flis et al., Reference Flis, Manecki and Bajda2011), but they require the presence or addition of lead to the polluted sediments or waste form. Substitution of arsenic into common sulfates, such as jarosite (Savage et al., Reference Savage, Bird and O'Day2005; Johnston et al., Reference Johnston, Burton, Keene, Planer-Friedrich, Voegelin, Blackford and Lumpkin2012, Forray et al., Reference Forray, Smith, Navrotsky, Wright, Hudson-Edwards and Dubbin2014) or alunite/natroalunite (Vinals et al., Reference Vinals, Sunyer, Molera, Cruells and Llorca2010, Luo et al., Reference Luo, Zhou, Jia, Chen, Tao and Liu2015, Sunyer et al., Reference Sunyer, Currubi and Vinals2016) has also been considered, and may be applicable in systems with low pH and high sulfate concentrations (Welham et al., Reference Welham, Malatt and Vukcevic2000). Kocourková et al. (Reference Kocourková, Sracek, Houzar, Cempírek, Losos, Filip and Hršelová2011) argued against jarosite/alunite as an arsenic-storage medium, stating that “beudantite and scorodite represent a long-term option for immobilization of arsenic, but arsenic stored in jarosite can be mobilized relatively easily”. In cementitious or ash systems with alkaline pH, calcium arsenates, sulfate-arsenates, or adsorption of arsenic on C-S-H phases plays the dominant role (e.g. Kumarathasan et al., Reference Kumarathasan, McCarthy, Hasset and Pflughoeft-Hassett1990, Cornelis et al., Reference Cornelis, Johnson, van Gerven and Vandecasteele2008, Prasanna and Kamath, Reference Prasanna and Kamath2009). In systems dominated by arsenic, secondary arsenates precipitate under oxidizing conditions, and their bulk chemistry is dictated by the primary composition and the properties of the fluids, especially their pH.
In this work, for the first time, the thermodynamic properties of the minerals mansfieldite, kamarizaite and angelellite were measured by a combination of high-temperature oxide-melt calorimetry, relaxation calorimetry and solubility measurements. Limited chemical data on the natural mansfieldite–scorodite solid solution are also presented. The samples, either synthetic or natural, were characterized by powder X-ray diffraction and electron microprobe analysis. For mansfieldite, solid state 27Al nuclear magnetic resonance (NMR) spectroscopy was used to check the sample purity with respect to a possible amorphous admixture.
Materials
Synthetic samples
The mansfieldite was synthesized hydrothermally. A solution made by mixing 0.57 g of AlCl3 and 15 mL of deionized water was mixed with a solution of 1.00 g Na2HAsO4·7H2O dissolved in 15 mL of deionized water. The resulting clear liquid was poured into a 125 mL Teflon container, inserted into a Paar stainless steel autoclave, sealed, and heated at 180°C for four days. Afterwards, the autoclave was allowed to slowly cool to room temperature, and the suspension was filtered and dried. A white powder was obtained.
A sample that mostly contained angelellite was synthesized after a modified procedure of Wright et al. (Reference Wright, McLaughlin and Attfield2000). Briefly, 4.182 g (18.2 mmol) of anhydrous As2O5 and 29.943 g (74.1 mmol) Fe(NO3)3·9H2O were dissolved in 500 mL of 2 M nitric acid (HNO3) (65%) and boiled under a fume hood to dryness. The residue was ground and heated at 700°C for 36 h. After cooling, the dark reddish-brown powder obtained was washed with 500 mL of deionized water and air-dried.
To remove an FeAsO4 impurity (cf. Wright et al., Reference Wright, McLaughlin and Attfield2000), the dried sample was mixed with 200 mL of 18% (by mass) hydrochloric acid (HCl), and the suspension was stirred at room temperature for 2 h. The solution turned increasingly yellow, indicating liberation of Fe3+ from the sample. After 2 h, the suspension was filtered and washed with 500 mL of deionized water and air-dried. As the impurity could still be detected by powder X-ray diffraction, although its quantitative proportion was reduced, the extraction procedure with HCl was repeated two more times. After a total of 6 h of HCl extraction, the angelellite yield was reduced by more than 50%, but no further reflections of the impurity were detected.
For the synthesis of scorodite, a modified procedure of Baghurst et al. (Reference Baghurst, Barrett and Mingos1995) was used, as in our previous work on this phase (Majzlan et al., Reference Majzlan, Drahota, Filippi, Grevel, Kahl, Plášil, Woodfield and Boerio-Goates2012). Each of the chemicals: FeCl3·6H2O (6.758 g, 25.0 mmol), As2O5 (2.873 g, 12.5 mmol) and NaOH (1.000 g, 25 mmol) were dissolved in a separate batch of 50 mL deionized H2O. After dissolution, the solutions were mixed. In contrast to Majzlan et al. (Reference Majzlan, Drahota, Filippi, Grevel, Kahl, Plášil, Woodfield and Boerio-Goates2012), the pH of the final solution was not adjusted. Solution was added to make a volume of 250 mL, and a portion thereof poured into a Teflon-lined steel autoclave. The autoclave was closed tightly and kept at 145°C for three days. After cooling, the precipitate was filtered and washed with deionized H2O.
Natural samples
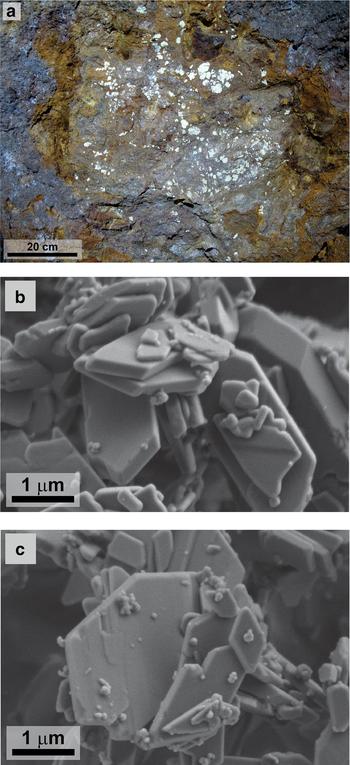
A natural kamarizaite sample was used, because no synthesis protocol has been reported for this phase so far. The sample was collected in situ by one of the authors (U.K.) underground from the 3rd level of the Hilarion Mine at Agios Konstantinos (Kamariza), Lavrion District, Greece; a site known for its rich secondary mineralogy (Skarpelis and Argyraki, Reference Skarpelis and Argyraki2009, Kolitsch et al., Reference Kolitsch, Rieck, Brandstätter, Schreiber, Fabritz, Blass and Gröbner2014). The samples consist of aggregates (up to 1.5 cm in diameter, Fig. 1a) of fine-grained kamarizaite (platy crystals 1–2 µm large, but <0.2 µm thick; Fig. 1b,c) embedded in a heterogeneous matrix of fine-grained jarosite [KFe3(SO4)2(OH)6], scorodite and iron oxides. The crystallography of these and other kamarizaite samples from Lavrion was described in detail by Kolitsch et al. (Reference Kolitsch, Lengauer and Giester2016). In the vicinity of the kamarizaite-bearing sites, somewhat larger crystals of scorodite grow on quartz relics in the gossan. Primary ore minerals have not been found here, but it could have been dominated by arsenopyrite, a fairly common ore mineral in Lavrion (Voudouris et al., Reference Voudouris, Melfos, Spry, Bonsall, Tarkian and Solomos2008). The underground stope with the kamarizaite aggregates had previously been primarily known for its excellent specimens of lavendulan [NaCaCu5(AsO4)4Cl·5H2O]. This mineral is thought to form here because the stope, located at the second lowest level of the mine, is close to sea level (currently at the fourth and lowest level). The current oxidation front at Kamariza is located at sea level (Skarpelis and Argyraki Reference Skarpelis and Argyraki2009).
(a) Aggregates of pale beige, fine-grained kamarizaite, embedded in a dark brown limonite-jarosite(-scorodite) matrix, the result of complete weathering of primary ores. Photo of a wall in the kamarizaite-containing stope on the 3rd level of the Hilarion Mine, Kamariza. Photo by Stefan Moser. (b and c) Back-scattered electron images of kamarizaite crystals.

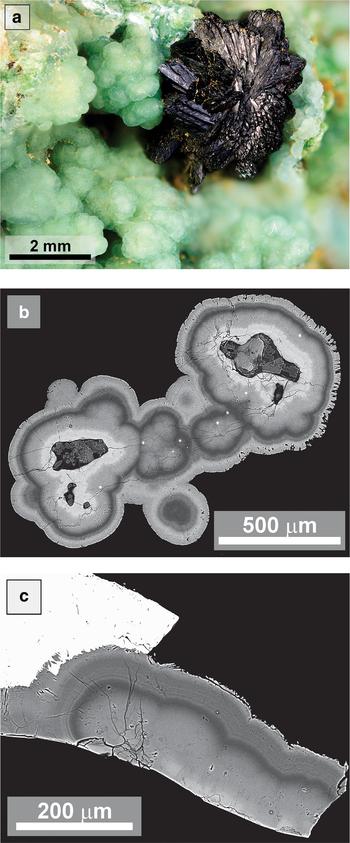
The samples of the scorodite–mansfieldite solid solution were collected by one of the authors (M.Š.) at Ľubietová-Svätodušná, Slovakia. These samples were collected on the dumps, as the old mining works are now inaccessible. There are three historically mined deposits at Ľubietová, but only Podlipa has been the subject of modern systematic research (Luptáková et al., Reference Luptáková, Milovská, Jeleň, Mikuš, Milovský and Biroň2016, Števko et al., Reference Števko, Sejkora and Malíková2016, Reference Števko, Sejkora and Súľovec2017). Svätodušná and Kolba received limited attention, apart from the identification of secondary minerals. Svätodušná is the type locality, and is still known particularly for its excellent crystals of euchroite [Cu2(AsO4)(OH)·3H2O], which are a product of the weathering of tennantite [Cu6[Cu4(Fe,Zn)2]As4S13], as well as other primary As minerals (arsenopyrite and Co–Ni–sulfides/sulfosalts) (Majzlan et al., Reference Majzlan, Števko, Dachs, Benisek, Plášil and Sejkora2016). Aggregates of scorodite and mansfieldite are rare. The Fe-dominated members (scorodite) are chemically homogeneous, but the Al-dominated members (mansfieldite) show strong zonation, with variations in the ratio of Fe/(Fe + Al) (Fig. 2a). They either occur separately or are overgrown by younger olivenite [Cu2(AsO4)(OH)] (Fig. 2b) on the fractures of the host rocks (gneisses and granite porphyries) or in the vugs of deeply weathered tennantite (also see Borčinová Radková et al., Reference Borčinová Radková, Jamieson, Lalinská-Voleková, Majzlan, Števko and Chovan2017).
Images of minerals from Ľubietová-Svätodušná. (a) Photograph of a botryoidal mansfieldite crust (light green) with a younger olivenite (dark green) crystal aggregate. Photo by Pavel Škácha. (b) Back-scattered electron (BSE) image of zoned aggregate of mansfieldite, with pronounced variations in the Fe/(Fe + Al) ratio. (c) BSE image of a mansfieldite aggregate (shades of grey), overgrown by a crystal of olivenite (white).

Methods
Characterization of the solids
Powder X-ray diffraction (PXRD) analyses were conducted using a Bruker D8 Advance diffractometer in the angular range of 5–90°2θ at room temperature. The step size was set to 0.01°2θ and the dwell time to 1 s per step. In order to reduce the noise of the Fe fluorescence, excited by the Cu emission radiation from the Fe-rich samples, the energy window of the Lynxeye detector was set to 0.18–0.25 V.
The images of selected carbon-coated samples were acquired with a Zeiss Ultra Plus field-emission gun scanning electron microscope (SEM) with an accelerating voltage of 2 kV. Semiquantitative energy-dispersive (EDX) analyses were carried out with the same instrument using an acceleration voltage of 20 kV.
Thermogravimetric (TG) and differential thermal (DT) analyses were carried out with a TG 92 Setaram TG/DTA instrument. The samples were heated from room temperature to 900°C in a flow of argon using a 10°C/min heating rate. The samples were also analysed for their water content with a Karl-Fischer NC2/66 titration system (University of Bochum, Germany). The samples were heated to 600°C, the escaping water was absorbed by water-free methanol, and determined quantitatively by titration with I2 and SO2.
The solid-state 27Al MAS NMR experiments were performed on a 600 MHz Agilent NMR spectrometer using a 3.2 mm triple resonance MAS NMR probe, and spinning speeds of 15 and 18 kHz. The 27Al NMR spectra are referenced to 1 M aqueous solution of Al3+ chloride (δiso(27Al) = 0 ppm).
The compositions of the minerals in thin sections were determined by electron microprobe analysis using a JEOL JXA-8230 at the University of Jena. The operating conditions were set to: an accelerating voltage of 15 kV, a beam current of 15 nA and a spot size of 10 µm. The wavelength-dispersive X-ray spectrometers were used to measure the elements and X-ray lines of MgKα, AlKα, SKα, CaKα, FeKα, ZnKα, MnKα and AsLα. To improve the count-rate statistics, the counting times were 30 s on each peak and 15 s on the background. The standards were MgO for Mg; Al2O3 for Al; apatite for Ca; baryte for S; Fe2O3 for Fe; ZnS for Zn; rhodonite for Mn; and InAs for As. Peak-overlap correction was used to avoid peak interference between the lines of Mg and As. The detection limits, calculated from the peak and background counts, the measurement time, the current, and the standard material concentration were (in wt.%): Mg 0.03, Ca 0.04, Al 0.02, Fe 0.01, S 0.04, Mn 0.04, As 0.02 and Zn 0.02.
Solubility experiments
For the solubility experiments, from 10 to 25 mg of synthetic mansfieldite was placed in 15 mL polypropylene centrifugation tubes. The tubes and two procedural blanks were filled with solutions made of 12 mL ultrapure water (resistivity < 18 MΩ·cm–1) and HNO3 solutions (Suprapur, Merck), with different HNO3 molarities (between 1 mM and 1 M). The tubes were then capped with paraffin sheets and sealing screw caps. The solutions were shaken moderately (100 rpm) and continuously for a period of 20 weeks at constant room temperature (24 ± 1°C). At the end of the experiments the suspensions in the tubes were centrifuged for 10 min at 4000 rpm, and the pH values were measured. The supernatant was filtered through nylon filters with a pore size of 0.2 µm (ProFill).
The pH values of the solutions were measured by a SenTix®41 and pH/ION 3310 multimeter (WTW, Germany). Calibration WTW solutions 1.679 ± 0.02 (25°C) and 4.006 ± 0.02 (25°C) were used before the measurements to calibrate the instrument. The samples were submitted for elemental analysis (As, Al) by inductively coupled plasma mass spectrometry (ICP-MS, ThermoScientific XSeries II quadrupole). The NO3 was analysed by high-performance liquid chromatography (HPLC; Dionex ICS-2000). The residual solids were analysed by PXRD using a PANalytical X'Pert Pro diffractometer (settings: CuKα radiation, 40 kV and 30 mA, 2θ range 5–80°, step size 0.02°, and counting time of 150 s using an X'Celerator multichannel detector).
Thermodynamic modelling of the aqueous solutions was performed with the PHREEQC software suite (Parkhurst and Appelo, Reference Parkhurst and Appelo1999). The log K values for the As(V) species were taken from Nordstrom et al. (Reference Nordstrom, Königsberger, Majzlan, Bowell, Alpers, Jamieson, Nordstrom and Majzlan2014); the values for the Al(III) and the Al(III)-As(V) species were retained from the original database.
Calorimetry
High-temperature oxide melt calorimetry has been described in detail by Navrotsky (Reference Navrotsky1997, Reference Navrotsky2014). The evaluation of experimental data requires empirical calibration, using ~15 mg pellets of α-Al2O3 (Alfa Aesar, 99.997 wt.% metals basis). The samples, in the form of ~15 mg pellets, were dissolved in the calorimetric solvent (3Na2O·4MoO3) at 975 K. The measured heat effect is the heat of drop solution (ΔdsolH); that is, the sum of heat content (H975–H298) and heat of solution (ΔsolH) at 975 K. To expel the water vapour evolved from the sample during dissolution in the calorimetric solvent, the calorimetric assembly was flushed with argon (65 mL/min). The accuracy of the calorimetric measurements with the molten solvent inside the setup was checked by frequent measurements of ΔdsolH for hematite, α-Fe2O3. Majzlan (Reference Majzlan2017) showed that the value of 95.63 ± 0.50 kJ·mol–1 satisfies the constraints of an appropriate closed thermochemical cycle. In this work, the measured ΔHdsol(α-Fe2O3) value was 95.10 ± 0.73 kJ·mol–1, in good agreement with the previous number.
The heat capacity of mansfieldite between 2 and 300 K was measured by relaxation calorimetry using a commercial Physical Properties Measurement System (PPMS, from Quantum Design, San Diego, California, USA) at the University of Salzburg, Austria. With due care, the accuracy can be within 1% from 5–300 K, and 5% from 0.7–5 K (Kennedy et al. Reference Kennedy, Stancescu, Marriott and White2007). Powdered samples were wrapped in a thin Al foil and compressed to produce a pellet ~0.5 mm thick, which was then placed onto the sample platform of the calorimeter for measurement. The heat capacity between 280 and 300 K was measured by differential scanning calorimetry (DSC) using a Perkin Elmer Diamond DSC. Details of the method are described in Benisek et al. (Reference Benisek, Kroll and Dachs2012).
Results
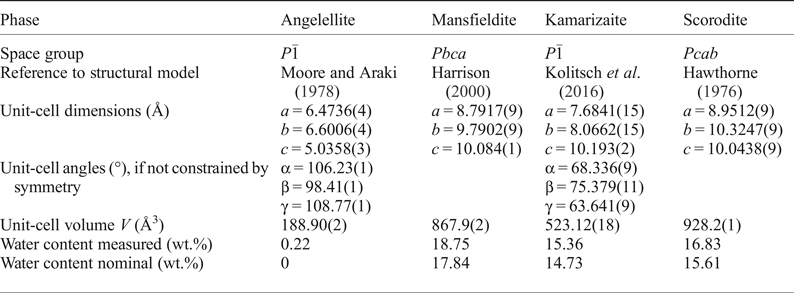
The samples were screened for their phase purity with PXRD. All samples used for calorimetry were found to be pure, their unit-cell parameters are listed in Table 1. For the synthetic samples (mansfieldite, angelellite), the chemical content on the cationic (Fe, Al) and the anionic (As) sites was assumed to correspond to the nominal formula. Cursory EDX analyses did not show the presence of any other cations or anions.
Space group, unit-cell parameters and water content of the phases investigated in this work*.

*Water content was determined by Karl-Fischer titration and is reported in wt.%.
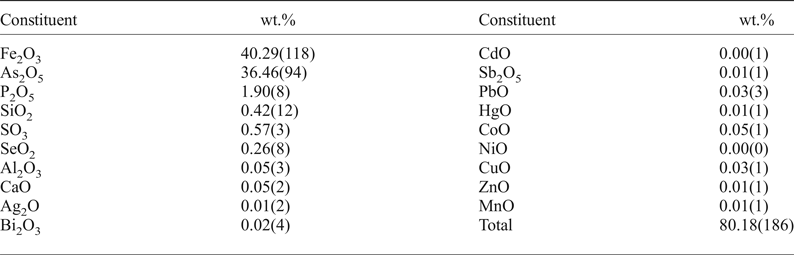
For kamarizaite, the composition was determined by electron microprobe, and is listed in Table 2. The only metal in any substantial concentration was Fe. Kolitsch et al. (Reference Kolitsch, Lengauer and Giester2016) also reported minor Al in their kamarizaite samples and samples of related minerals. In our case, the Fe/(Fe + Al) ratio was always >99.4%. On the tetrahedral sites, As dominates, however the concentration of P is not negligible, with an average As/(As + P) ratio of 92.2%. The elements S, Se and Si could also be present at this site, but their concentrations are deemed too low to influence the calorimetric results; therefore, they are ignored in the evaluation of the calorimetric data.
Composition of the natural kamarizaite sample (in wt.%), determined by electron microprobe*.

*Average of 25 spot analyses; one standard deviation in parentheses.
In terms of water content of the samples, no assumptions were made. High-temperature oxide-melt calorimetry is particularly sensitive to the variations in H2O content; therefore, significant effort was expended for its precise determination. Thermogravimetric (TG) analyses did not always lead to satisfactory results. The TG analyses for scorodite and angelellite (Fig. 3a) show a plateau at high temperatures and allow for a precise determination of the volatile content in these samples. Similar behaviour was observed for angelellite (Fig. 3b) although, as expected, the mass loss was very small. The TG results for kamarizaite (Fig. 3c) show the loss of volatiles, probably in the form of H2O gas; but with steady mass loss at higher temperatures (>400°C). The high-temperature changes could perhaps be attributed to either O2 loss (during reduction of As2O5 to As2O3) or volatilization of arsenic species. These changes, however, interfered with the loss of H2O and precluded precise determination of the water content of the sample. Our results are in broad agreement with the TG data for type kamarizaite by Chukanov et al. (Reference Chukanov, Pekov, Möckel, Mukhanova, Belakovsky, Levitskaya and Bekenova2010) who observed, using a heating rate of 4°C/min, complete dehydration and dehydroxylation in a vacuum in the 110–420°C temperature range, with a weight loss of 15.3(1)%. The TG measurements of Kolitsch et al. (Reference Kolitsch, Lengauer and Giester2016), conducted in N2 and using a heating rate of 5°C/min, were also similar. They revealed a one-step weight loss of 14.6 wt% in the 99–500°C range for kamarizaite; in very good agreement with the calculated value of 14.73 wt%. After T max (900°C) of the thermal treatment, the decomposition products of kamarizaite were hematite, arsenolite and an unknown FeAsO4 phase (ICDD 21-910) (Kolitsch et al., Reference Kolitsch, Lengauer and Giester2016).
Thermogravimetric (TG) and differential thermal (DT) traces for the samples used for high-temperature oxide-melt calorimetry in this work. TG traces are shown as solid lines, with the corresponding mass loss on the left-hand side vertical axis. DT traces are shown as dashed lines.

The water contents of the samples were determined by Karl-Fischer titration, a technique that measures H2O content chemically, and therefore is not influenced by other volatile species (Table 1).
A common problem with the calorimetry of aluminium oxides and oxysalts is the presence of an amorphous impurity. Such impurities, in small to moderate amounts, can escape the detection by PXRD, but can introduce significant systematic errors into the calorimetric results. Hence, we applied solid state 27Al MAS NMR to screen the mansfieldite sample for amorphous substances. The 27Al MAS NMR spectrum of mansfieldite contains a single 27Al NMR resonance in the region for octahedral Al [(δiso(27Al) = 0.6(5) ppm]. The resonance has a distinct line shape, which could either originate from a single site with a second order quadruple line shape, or two 27Al sites with similar chemical shift and relative intensity. To distinguish between these two possibilities, a 27Al 3QMAS NMR spectrum was recorded (Fig. 4). This experiment removes the second order quadrupole line broadening in the F1 dimension, and for each site gives a featureless line shape. A single 27Al resonance is observed, confirming the presence of one crystallographic Al site in mansfieldite, and thus the sample purity. It is characterized by a moderate quadrupole coupling interaction [δiso(27Al) = 0.6(5) ppm, CQ = 2.7(2) MHz, η = 0.15(5)], as obtained from analysis of the 27Al single pulse and 3QMAS NMR spectra.
27Al MAS NMR spectrum of synthetic mansfieldite with projection showing the single pulse 27Al MAS NMR spectrum (F2, above) and the single resonance in the indirect dimension (F1, left), where the second order quadrupole interaction is removed. The spectrum was recorded at 14.1 T using 18 kHz spinning and the three pulse z-filtered sequence.

Calorimetric determination of enthalpies of formation
None of the phases studied in this work dissolved in 5 N HCl, the calorimetric solvent routinely used in our laboratory (Majzlan, Reference Majzlan2017). However, the iron arsenates dissolve rapidly in a high-temperature oxide melt, and are therefore suitable for high-temperature oxide-melt calorimetry. Mansfieldite presents a set of specific difficulties which will be discussed briefly later; these difficulties precluded any solution calorimetry work on this phase.
High-temperature oxide-melt calorimetry of arsenical compounds
The high-temperature oxide-melt calorimetry of arsenical compounds was tested and shown to be feasible by Forray and Navrotsky (Reference Forray and Navrotsky2005) and Forray et al. (Reference Forray, Smith, Navrotsky, Wright, Hudson-Edwards and Dubbin2014). These authors performed a set of experiments with the well characterized As2O3 and As2O5 to show that reliable enthalpies of formation can be obtained if the dissolution enthalpies of these two phases in a calorimetric solvent (a near-eutectic mixture of Na2MoO4 and MoO3, Navrotsky and Kleppa, Reference Navrotsky and Kleppa1968) are measured. They also tested the experimental system for arsenic that may escape the high-temperature zone of the calorimeter, concluding that arsenic is completely retained in the melt. Later, Majzlan (Reference Majzlan2017) showed that the oxidation state of arsenic in the melt is predominantly maintained as As5+; the sodium molybdate melt has a tendency to oxidize most elements into their highest oxidation state and tolerate such oxidation processes without parasitic reactions (Navrotsky, Reference Navrotsky1997).
Hence, it may seem that high-temperature oxide-melt calorimetry on arsenical compounds is an established technique, working flawlessly and yielding good results. Yet, the enthalpy of formation of As2O3 from Forray et al. (Reference Forray, Smith, Navrotsky, Wright, Hudson-Edwards and Dubbin2014), –652.6 kJ·mol–1, deviates greatly from other recommended values, with the exception of the datum of –653.9 kJ·mol–1 in SGTE (Reference Martienssen1999). All the other values cluster around –657 kJ·mol–1. Contrary to the statement of Forray et al. (Reference Forray, Smith, Navrotsky, Wright, Hudson-Edwards and Dubbin2014) that the origin of these values is unclear because they can be traced to Wagman et al. (Reference Wagman, Evans, Parker, Halow, Bailey and Schumm1968), who gave no references, these thermodynamic data can be tracked back to a set of solubility and heat capacity studies with excellent mutual agreement and tight errors. The derivation of the last recommended value, –657.06 kJ·mol–1, was detailed in Nordstrom et al. (Reference Nordstrom, Königsberger, Majzlan, Bowell, Alpers, Jamieson, Nordstrom and Majzlan2014). Hence, there is a difference of 4.46 kJ·mol–1 between the value derived by Forray et al. (Reference Forray, Smith, Navrotsky, Wright, Hudson-Edwards and Dubbin2014) and that recommended by Nordstrom et al. (Reference Nordstrom, Königsberger, Majzlan, Bowell, Alpers, Jamieson, Nordstrom and Majzlan2014). Such a discrepancy is not satisfactory.
Selection of reference compounds for high-temperature oxide-melt calorimetry: Scorodite and KH2AsO4
In this work, we carried out additional tests to judge the feasibility of high-temperature oxide-melt calorimetry on arsenical compounds. Instead of using As2O5, a strongly hygroscopic and difficult-to-control compound, scorodite (FeAsO4·2H2O) was chosen for these tests. Scorodite appears, in relation to thermodynamic data, to be the best known As(V) phase. The solubility studies (Langmuir et al., Reference Langmuir, Mahoney and Rowson2006) and calorimetric work (Majzlan et al., Reference Majzlan, Drahota, Filippi, Grevel, Kahl, Plášil, Woodfield and Boerio-Goates2012) on scorodite converge almost perfectly (cf. Nordstrom et al., Reference Nordstrom, Königsberger, Majzlan, Bowell, Alpers, Jamieson, Nordstrom and Majzlan2014). Scorodite is easy to prepare, maintain and handle – and therefore is an excellent reference compound.
Chemical analyses of the synthetic scorodite sample used in this study showed that the composition is FeAsO4·2.19H2O. This information is important in that the high-temperature oxide-melt calorimetry (in contrast to the acid-solution calorimetry) is very sensitive to the H2O content of the samples. The heat effect due to 1 mole of H2O is 69 kJ·mol–1 for the high-temperature calorimetry, but only –0.54 kJ·mol–1 for the acid-solution calorimetry (for both types of calorimetry experiments with temperature and solvents were as outlined in Majzlan, Reference Majzlan2017). As the nominal composition of scorodite is FeAsO4·2H2O, and its crystal structure (Hawthorne, Reference Hawthorne1976) has no free or exchangeable H2O molecules (such as in zeolites, for example), it can be assumed that the excess water is adsorbed physically onto the surfaces of the particles or occluded within them. Therefore, the excess water can be thermodynamically handled as bulk water.
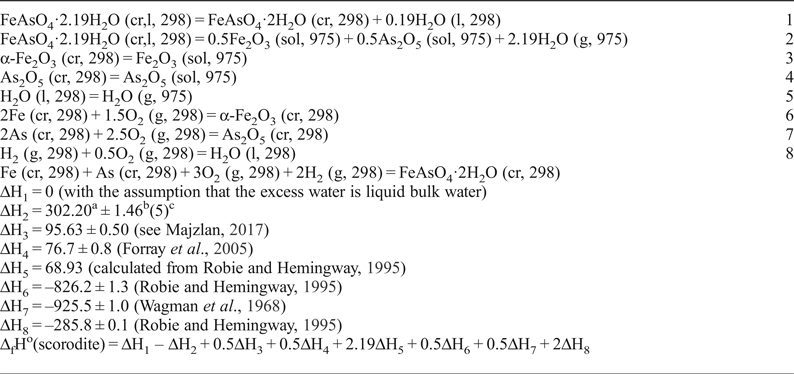
A thermodynamic cycle for scorodite with the composition FeAsO4·2.19H2O is listed in Table 3. Assuming that the excess water is loosely bound liquid water, the calculated enthalpy of formation for FeAsO4·2H2O is –1512.7 ± 1.8 kJ·mol–1, differing by 3.8 kJ·mol–1 from the calorimetrically determined value of –1508.9 ± 2.9 kJ·mol–1 (Majzlan et al., Reference Majzlan, Drahota, Filippi, Grevel, Kahl, Plášil, Woodfield and Boerio-Goates2012) and is recommended by Nordstrom et al. (Reference Nordstrom, Königsberger, Majzlan, Bowell, Alpers, Jamieson, Nordstrom and Majzlan2014). This difference is also not any reason for excessive rejoicing, but it shows the true magnitude of the discrepancies if many crosschecks are performed.
Thermochemical cycle for scorodite*.

*All enthalpy values in kJ·mol–1. Abbreviations of phases: cr = crystalline, l = liquid, g = gas, sol = solution in the calorimetric solvent. Temperature of each participating reactant or product is specified in K.
a Mean; b two standard deviations of the mean; c number of measurements.
Another test was carried out with KH2AsO4, a simple compound presumably with a nominal composition. The data, already collected and briefly discussed by Majzlan et al. (Reference Majzlan, Drahota, Filippi, Grevel, Kahl, Plášil, Woodfield and Boerio-Goates2012), lead to an enthalpy of formation for this phase of –1184.9 ± 2.8 kJ·mol–1; differing by 3.7 kJ·mol–1 from the acid-solution calorimetric value of –1181.2 ± 2.0 kJ·mol–1 (cf. Majzlan, Reference Majzlan2017).
These tests show that in both cases, the values determined by high-temperature oxide-melt calorimetry deviate by 3.7–3.8 kJ·mol–1 from the better constrained thermochemical data. This difference hints that there may be a systematic error of this magnitude included in the data for As2O5, either in the drop solution enthalpy or the enthalpy of formation. Therefore, in this work, the thermochemical cycles for the arsenates are not constructed with As2O5 as the reference compound.
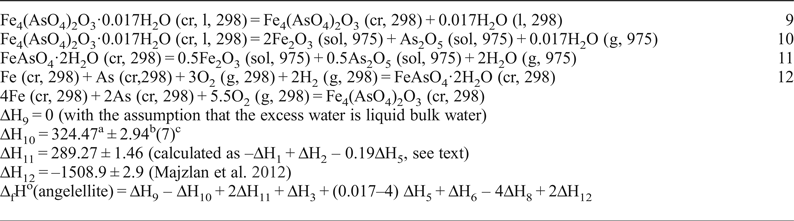
It seems that the most accurately known enthalpy of formation of the arsenates is that for scorodite. Therefore, this phase was chosen as the reference phase for arsenic in the thermochemical cycles for the other iron arsenates investigated. A proper combination of the enthalpies of reactions 1, 2 and 5 (–ΔH1 + ΔH2 – 0.19ΔH5, see Table 3) gives the enthalpy of drop solution of stoichiometric FeAsO4·2H2O in molten 3Na2O·4MoO3 at 975 K, as + 289.27 ± 1.46 kJ·mol–1. This value will be used in the following thermochemical cycles.
Angelellite
The enthalpy of formation of angelellite was determined via the thermochemical cycle in Table 4. Chemical analysis gave the formula Fe4(AsO4)2O3·0.017H2O. The small amount of water is certainly physisorbed, but even this small amount accounts for a correction of 1.2 kJ·mol–1. The possibility of structural OH groups was entertained by Moore and Araki (Reference Moore and Araki1978), but rejected by detailed neutron diffraction studies (Wright et al., Reference Wright, McLaughlin and Attfield2000). The calculated enthalpy of formation from the elements at standard conditions is –2625.7 ± 7.3 kJ·mol–1 for the composition Fe4(AsO4)2O3.
Thermochemical cycle for angelellite*.

*All enthalpy values in kJ·mol–1. Abbreviations of phases: cr = crystalline, l = liquid, g = gas, sol = solution in the calorimetric solvent. Temperature of each participating reactant or product is specified in K. The reactions 3, 5, 6, and 8 are listed in Table 3, together with their enthalpies. Note that the enthalpy of formation of scorodite (reaction 12) is not that calculated from the thermochemical cycle in Table 3 but that reported by Majzlan et al. (Reference Majzlan, Drahota, Filippi, Grevel, Kahl, Plášil, Woodfield and Boerio-Goates2012); for explanation, see text.
a mean; b two standard deviations of the mean; c number of measurements.
Kamarizaite
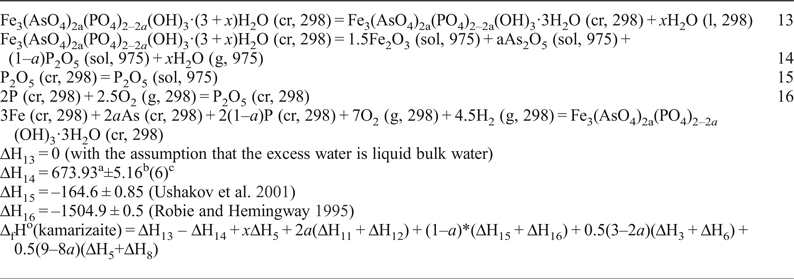
The enthalpy of formation of kamarizaite was determined via the thermochemical cycle in Table 5. Chemical analysis gave the formula Fe3[(AsO4)0.922(PO4)0.078]2(OH)3·3.159H2O. As with scorodite and angelellite, the small amount of excess H2O (0.159H2O) is treated as physisorbed water in the thermochemical cycle (Table 5). Thermodynamic properties are therefore reported for the composition Fe3[(AsO4)0.922(PO4)0.078]2(OH)3·3H2O. The enthalpy of formation for this composition is –3640.4 ± 7.9 kJ·mol–1.
Thermochemical cycle for kamarizaite (natural sample with composition Fe3[(AsO4)0.922(PO4)0.078]2(OH)3·3.159H2O)*.

*For this composition, the variables in reactions 13, 14, and the formation reaction for kamarizaite are: x = 0.159 and a = 0.922. Note that the thermochemical cycle generates the enthalpy of formation for the composition Fe3[(AsO4)0.922(PO4)0.078]2(OH)3·3H2O, treating the excess H2O (0.159H2O) as physisorbed water (reaction 13). All enthalpy values in kJ·mol–1. Abbreviations of phases: cr = crystalline, l = liquid, g = gas, sol = solution in the calorimetric solvent. The reactions 3, 5, 6, 8, 11, and 12 are listed in Tables 3 and 4, together with their enthalpies.
a Mean; b two standard deviations of the mean; c number of measurements
Mansfieldite
The dissolution of mansfieldite in 5 N HCl was so slow that a calorimetric determination of a reliable dissolution enthalpy was unattainable. Mansfieldite may dissolve in the molten 3Na2O·4MoO3, but corundum, the reference phase of choice for aluminium, does not. Corundum dissolves readily in molten lead borate (2PbO·B2O3), but this solvent has never been tested as an alternative for calorimetry on arsenical compounds. An alternative approach was chosen, specifically the experimental determination of the solubility product and measurement of low-temperature heat capacity. These data sets also allow for derivation of the enthalpy of formation.
Determination of solubility product of mansfieldite
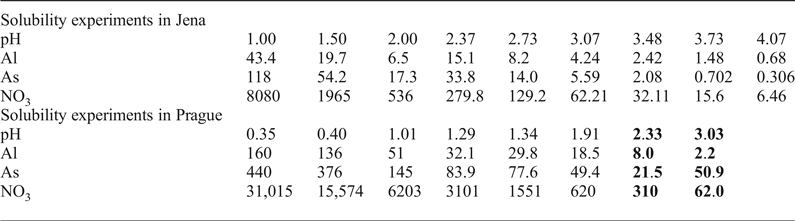
To obtain the thermodynamic data for mansfieldite, its solubility was studied directly in aqueous solutions. Two sets of experiments were performed, under similar conditions, in Jena and Prague, and the results are summarized in Table 6.
Results of mansfieldite solubility measurements in Jena and Prague*.

*pH in standard units, chemical species in mg/L. Two experiments marked in bold were used to estimate the log Ksp for mansfieldite.
The aqueous concentrations of Al(III), As(V),  ${\rm NO}_{\rm 3}^\ndash $, together with the pH (Table 6), served for the calculation of the solubility product, using the software package PHREEQC. The data are shown graphically in Fig. 5 as an apparent saturation index for an assumed value of the solubility product (log K sp = –21.4, see below) of mansfieldite. In a well-conducted experiment, the data over a certain pH range would plot as a plateau whose mean defines the solubility product. However, in the case of mansfieldite, as the pH decreases, the data progressively deviate from such a plateau. Nevertheless, because of the hydrolysis of metals such as Fe or Al, solubility data for Al or Fe arsenates are preferably taken at low pH (cf. Langmuir et al., Reference Langmuir, Mahoney and Rowson2006). At higher pH, the dissolution tends to be incongruent, as is also documented in our data (Table 6).
Calculated apparent saturation indices for assumed log K sp (mansfieldite) = –21.4. Circles: mansfieldite dissolution, this work (experiments in Jena); diamonds: mansfieldite dissolution, this work (experiments in Prague); triangles: dissolution of amorphous AlAsO4·3.5H2O (Pantuzzo et al., Reference Pantuzzo, Santos and Ciminelli2014).

The systematic changes of the apparent solubility product at low pH values are difficult to comprehend. They could be caused if another phase, Al hydroxide or arsenate, becomes the solubility-controlling phase. However, the PXRD data after the solubility experiments show no additional crystalline impurity at all. Amorphous material, in turn, cannot be considered because its solubility is higher than the solubility of crystalline mansfieldite.
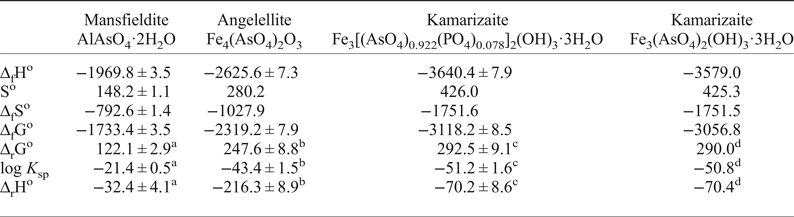
In this situation, we tentatively chose log K sp = –21.4 ± 0.5 as the best value for mansfieldite for the dissolution reaction AlAsO4·2H2O (cr) = Al3+ (aq) + As ${\rm O}_{\rm 4}^{3\ndash} $ (aq) + 2H2O (aq). This datum is derived as the mean of two data points with congruent dissolution, which belong to the plateau in Fig. 5. These two experiments are highlighted in bold in Table 6. For data at higher pH, the dissolution is clearly incongruent. At lower pH, a systematic change of the ion activity product with pH is observed. The choice of this value is also to some extent supported by thermodynamic data from other studies, as discussed below. Using the appropriate thermodynamic data for the aqueous ions and liquid water, the Gibbs free energy of formation of mansfieldite at standard conditions is –1733.4 ± 3.5 kJ·mol–1.
Determination and estimation of the standard entropies
Having measured ΔfHo or log K sp (and hence, also ΔfGo) of the studied phases, a complete thermodynamic data set for each phase can be obtained if the standard entropies are known. Two approaches were followed for this purpose. For the iron arsenates, the entropies were estimated. Estimates of entropies are relatively robust, especially if entropies of similar phases have been previously measured. This is the case with arsenates of ferric iron (e.g. Majzlan et al., Reference Majzlan, Drahota, Filippi, Grevel, Kahl, Plášil, Woodfield and Boerio-Goates2012). For mansfieldite, the low-temperature heat capacity was measured experimentally, and the entropy calculated from these data.
The basis for the estimation of entropies is Kopp's rule which states that the entropy of a phase is simply a linear combination of the entropies of its components, if these components are crystal-chemically comparable to that phase. For example, this means that the entropy of FeAsO4·2H2O could be estimated as the linear combination of entropies of 0.5Fe2O3, 0.5As2O5 and 2H2O; the latter not in the form of liquid water but of metastable ice instead. Our results (e.g. Majzlan et al., Reference Majzlan, Drahota, Filippi, Grevel, Kahl, Plášil, Woodfield and Boerio-Goates2012) show that the experimental entropies of the oxides (Fe2O3, As2O5, P2O5), in combination with the entropy of metastable ice at T = 298.15 K, yield good results. The numerical values are So(α-Fe2O3) = 87.4 J·mol–1·K–1, So(P2O5) = 114.4 J·mol–1·K–1 (Robie and Hemingway, Reference Robie and Hemingway1995), So(As2O5) = 105.44 J·mol–1·K–1 (Nordstrom and Archer, Reference Nordstrom, Archer, Welch and Stollenwerk2003) and So(H2O,cr) = 41.94 J·mol–1·K–1 (Majzlan et al., Reference Majzlan, Drahota, Filippi, Grevel, Kahl, Plášil, Woodfield and Boerio-Goates2012). Taking these values, the estimated standard entropy for angelellite [for the composition Fe4(AsO4)2O3] is 280.2 J·mol–1·K–1. For kamarizaite, with the nominal composition Fe3(AsO4)2(OH)3·3H2O, the estimate is 425.3 J·mol–1·K–1; and for the natural kamarizaite [Fe3[(AsO4)0.922(PO4)0.078]2(OH)3·3H2O] it is 426.0 J·mol–1·K–1.
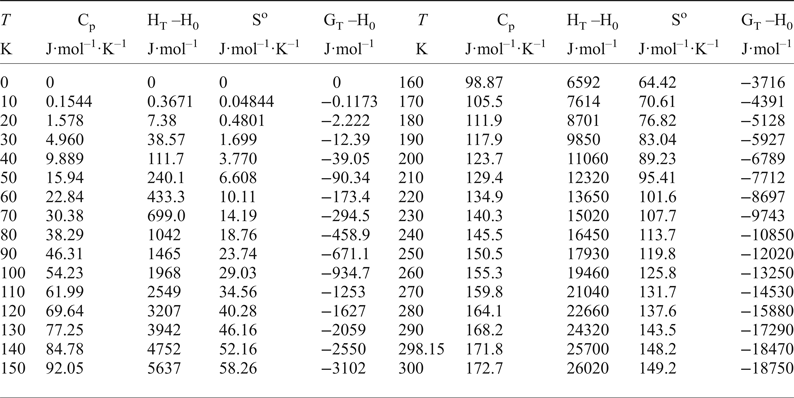
Low-temperature heat-capacity data for mansfieldite, measured by relaxation calorimetry from 2–300 K, are shown in Fig. 6 and also listed in Supplementary Table S1. At the low-temperature end, heat capacity was extrapolated to 0 K by an extended Debye polynomial Cp = A3T 3 + A5T 5. The remaining data were fitted with orthogonal polynomials. The differential scanning calorimetry data, measured between 280–300 K, compared very well with the relaxation data (Fig. 6). As expected, no anomalies or phase transitions are detectable in the data. Thermodynamic functions, calculated from smoothed polynomials that fit the data, are listed in Table 7. The standard entropy at T = 298.15 K is 148.2 ± 1.1 J·mol–1·K–1.
Low-temperature heat capacity data for synthetic mansfieldite, AlAsO4·2H2O, molecular mass 201.931 g·mol–1. The lines are the fits for integration and calculation of molar thermodynamic functions (Table 7).

Thermodynamic functions for mansfieldite, AlAsO4·2H2O (molecular mass 201.931 g·mol–1).

Discussion
Critical evaluation of the thermodynamic data and estimates for nominal compositions
A complete thermodynamic data set for each phase studied in this work is listed in Table 8. The solubility products (log K sp) can be inserted directly into common geochemical codes such as PHREEQC or The Geochemists’ Workbench (https://www.gwb.com/). Variation of the solubility products with temperature (over a limited temperature range) can be calculated with the enthalpies of dissolution reactions (ΔrHo), which are also given in Table 8.
Summary of thermodynamic data for the phases studied. All enthalpies and Gibbs free energies in kJ·mol–1, entropies in J·mol–1·K–1. The estimated values for the nominal composition of kamarizaite are given without uncertainties, because they are not known.

a for reaction AlAsO4·2H2O (cr) = Al3+ (aq) + As ${\rm O}_{\rm 4}^{3\ndash} $ (aq) + 2H2O (l)
b for reaction Fe4(AsO4)2O3 (cr) + 6H+ (aq) = 4Fe3+ (aq) + 2As ${\rm O}_{\rm 4}^{3\ndash} $ (aq) + 3H2O (l)
c for reaction Fe3[(AsO4)0.922(PO4)0.078]2(OH)3·3H2O (cr) + 3H+ (aq) = 3Fe3+ (aq) + 1.844As ${\rm O}_{\rm 4}^{3\ndash} $ (aq) + 0.156PO43– (aq) + 6H2O (l)
d for reaction Fe3(AsO4)2(OH)3·3H2O (cr) + 3H+ (aq) = 3Fe3+ (aq) + 2As ${\rm O}_{\rm 4}^{3\ndash} $ (aq) + 6H2O (l)
The calculated solubility over a wide pH range is displayed graphically in Fig. 7. Note that the solubility curves were calculated by ignoring the other intervening phases, such as Fe oxides (cf. Langmuir et al., Reference Langmuir, Mahoney and Rowson2006; Majzlan et al., Reference Majzlan, Drahota, Filippi, Grevel, Kahl, Plášil, Woodfield and Boerio-Goates2012). The incongruent nature of dissolution of the phases investigated will be discussed later.
Calculated solubility for the phases studied, compared to the solubility of scorodite. Note that in this figure no other phases are considered. All of the phases shown, however, dissolve incongruently at mildly acidic to alkaline pH. The solubility curves for the natural kamarizaite and the nominal-composition kamarizaite essentially overlap. Therefore, only that for the natural kamarizaite is shown.

Mansfieldite
The solubility product of mansfieldite was estimated from the solubility data generated in this work (Fig. 5). A more precise determination would be desirable; however, several lines of evidence show that the accuracy, even for such an estimate, was not compromised greatly.
Solubility of a crystalline phase is expected to be lower than its amorphous counterpart. In other words, the amorphous counterpart imposes an upper limit on the solubility of the crystalline phase. Pantuzzo et al. (Reference Pantuzzo, Santos and Ciminelli2014) measured the solubility of amorphous AlAsO4·3.5H2O and determined it as log K sp = –18.06 ± 0.05. The value was calculated from a single point at pH = 2.7, measured in triplicate. Another measurement at pH = 3.5 was not used because the dissolution was found to be incongruent. Hence, there are no data at lower pH, and it is not clear if the solubility of this material would also show the behaviour observed in our samples. The tight error on the result is the consequence of using a triplicate of a single point, not an excellent agreement over a pH range. Despite this, the solubility of the amorphous AlAsO4·3.5H2O is, as expected, several orders of magnitude higher than the solubility of mansfieldite from this work.
A lower limit on the solubility of mansfieldite can be found by comparison with the isostructural scorodite. Le Berre et al. (Reference Le Berre, Cheng, Gauvin and Demopoulos2007) have carried out a series of syntheses and leaching experiments on mansfieldite, scorodite, and the solid-solution members between them. They found that the leachability systematically increases from scorodite to mansfieldite. They reported that mansfieldite has “at least 10 times higher solubility than that of scorodite”. Although kinetic and thermodynamic arguments are mixed in their work (because the U.S. Environmental Protection Agency Toxicity Characterization Leaching Procedure cannot determine solubility, but only leachability over a certain time), our data support their conclusion. Calculated solubility curves (Fig. 7) are in agreement with their statement. At pH = 4, the solubility of mansfieldite is ~10 times higher than that of scorodite. At pH = 6, their solubilities are similar, but this pH region is irrelevant because both phases undergo incongruent dissolution. Congruent dissolution and efficient arsenic retention at this pH cannot be reached, either in the laboratory or in the field.
Older datum of log K sp = –15.8 for AlAsO4·2H2O (Chukhlantsev, Reference Chukhlantsev1956) seems to complicate matters. However, the synthesis product was not characterized in that case, and it is not clear what was actually measured. These early measurements have been discussed and questioned in the literature, not only with respect to the Al arsenate but also to the arsenates of other metals (e.g. Pantuzzo et al., Reference Pantuzzo, Santos and Ciminelli2014 and references therein).
Kamarizaite
In this work, we derived the thermodynamic properties of a natural sample of kamarizaite, with the composition Fe3[(AsO4)0.922(PO4)0.078]2(OH)3·3H2O. Even though the currently used geochemical codes easily operate with such mixed compositions, it would be desirable to have a log K sp value for the end-member composition Fe3(AsO4)2(OH)3·3H2O. The reason is the ability to calculate a saturation index for this mineral from routine chemical analyses of aqueous samples. In our work, we have seen countless chemical analyses of natural and contaminated waters with the Fe and As concentration reported, but without measured P concentrations. From such analytical data, a saturation index for the composition of our natural sample cannot be calculated.
In the absence of additional thermodynamic data for the solid solution of kamarizaite and tinticite (its phosphate analogue), we turn to the chemically similar and crystal-chemically related solid-solution series scorodite–strengite (FeAsO4·2H2O–FePO4·2H2O). The log K sp for scorodite (Langmuir et al., Reference Langmuir, Mahoney and Rowson2006, Majzlan et al., Reference Majzlan, Drahota, Filippi, Grevel, Kahl, Plášil, Woodfield and Boerio-Goates2012) was recalculated by Nordstrom et al. (Reference Nordstrom, Königsberger, Majzlan, Bowell, Alpers, Jamieson, Nordstrom and Majzlan2014) to be –25.68. The log K sp of strengite was determined by Nriagu (Reference Nriagu1972) and re-evaluated by Iuliano et al. (Reference Iuliano, Ciavatta and De Tommaso2007) as –28.4. Hence, the difference is 2.72 log units per one As/P site. For a 7.8% PO4 substitution for AsO4 in natural kamarizaite and 2 As/P sites, the difference in log K sp between our natural composition and end-member composition for kamarizaite would be 0.4 log units. Using this datum and the thermodynamic functions of the natural kamarizaite, the solubility product (log K sp) for the nominal composition of kamarizaite [Fe3(AsO4)2(OH)3·3H2O] is estimated as –50.8.
Solid solution between mansfieldite and scorodite
Scorodite is the most common secondary arsenate, but mansfieldite is rare. Intermediate compositions are seldom found. The abundance of scorodite could be a consequence of the fact that the primary minerals that weather to produce arsenates are dominated by pyrite (FeS2) and arsenopyrite (FeAsS). On the other hand, there are no aluminium sulfides in nature, owing to their instability in contact with water. Yet, acidic mine drainage solutions commonly mobilize a large amount of aluminium by chemical attack of phyllosilicates (e.g. Lintnerová et al., Reference Lintnerová, Šucha and Streško1999).
Synthetic intermediate members of the scorodite–mansfieldite solid solution were prepared (at 160°C) and characterized by Le Berre et al. (Reference Le Berre, Cheng, Gauvin and Demopoulos2007). They observed that all solids had a higher Fe/(Fe + Al) ratio than the starting solution. This fact is easily explained by the large difference in log K sp values between scorodite and mansfieldite, thus forcing the solids to take up much more Fe than Al, compared to the mother aqueous solution. The few experiments, in combination with the synthesis temperature that is not applicable to natural samples of these minerals, preclude a quantitative statement about the thermodynamics of this solid solution. Additionally, the unusual scatter of the lattice parameters and the unit-cell volumes (Fig. 8) hint that the synthesis products may have been heterogeneous, with Fe-rich cores and Fe-depleted rims. We have been trying to circumvent such problems by biological synthesis of this solid solution at lower temperatures (cf. Gonzalez-Contreras et al., Reference Gonzalez-Contreras, Weijma, van der Weijden and Buisman2010), but so far with limited success.
Unit-cell volumes of the synthetic members of the mansfieldite–scorodite solid-solution series. Calculated from Le Berre et al. (Reference Le Berre, Cheng, Gauvin and Demopoulos2007).

An occurrence with both scorodite and mansfieldite was reported from Krásno (Czech Republic) by Sejkora et al. (Reference Sejkora, Ondruš, Fikar, Veselovský, Mach, Gabašová, Škoda and Beran2006). There, scorodite is common, while mansfieldite is rare; however, they may occur together. Semiquantitative (EDX) analyses showed that the Al–Fe substitution in Krásno mansfieldite is limited, unlike the As–P substitution that is characterized by a wide variation of the As/(As + P) ratio. In some locations analysed, P predominates over As.
Natural members of the scorodite–mansfieldite solid solution were encountered within this work at the Ľubietová-Svätodušná locality (Fig. 2). Chemical analyses of these aggregates define two clusters (Fig. 9). The first cluster consist of compositions very close to scorodite in terms of the Fe/(Fe + Al) ratio, although with ~4 mol.% of a FePO4 component. The other cluster contains intermediate compositions where Al predominates over Fe, but the Fe/(Fe + Al) ratios scatter widely. They have a lower P content than the compositions in the first cluster. These two clusters, clearly divided from each other by a gap, are an indication of the thermodynamic non-ideal nature of the scorodite–mansfieldite solution. Yet, the limited number of analyses and the interfering phosphate component disqualify the use of these data for a quantitative thermodynamic analysis. Such analysis must await more data from natural systems or a successful synthesis of homogeneous intermediate compositions.
Projection of the composition of the members of scorodite–mansfieldite solid-solution series from Ľubietová-Svätodušná. All data determined by electron microprobe spot analyses.

Solubility and stability of the phases studied
Stability and scarcity of kamarizaite
As mentioned above, scorodite is one of the preferred phases for arsenic immobilization in mining waste because of its low solubility, long-term stability, high As fraction in the solid, easy filtration, and low cost of the ingredients needed to make it (e.g. Swash and Monhemius, Reference Swash, Monhemius, Castro, Vergara and Sánchez1998). Scorodite undergoes incongruent dissolution at pH > ~4 (e.g. Majzlan et al. Reference Majzlan, Drahota, Filippi, Grevel, Kahl, Plášil, Woodfield and Boerio-Goates2012) and releases much more As into the solution than that predicted from congruent dissolution (shown in Fig. 7). All phases in Fig. 7 show similar behaviours of incongruent dissolution and large As escape into the aqueous solution. Hence, only a comparison of their solubilities in the acidic region make sense. Kamarizaite is predicted to have a very similar solubility to scorodite, making it a phase of potential interest for further research. The low solubility of kamarizaite is supported, albeit only qualitatively, by our observation that this phase dissolved very sluggishly in hydrochloric or nitric acid, similarly to scorodite. Although dissolution rates cannot be directly equated to thermodynamic stability, there is a theoretical link between the two variables.
An intriguing question is then the massive presence of scorodite at many mine drainage sites and oxidation zones with copious Fe and As, compared to the dire scarcity of kamarizaite. A partial answer to this question may be very prosaic. Even at the site that yielded our kamarizaite specimen, collectors had erroneously identified this mineral as pale jarosite and thus disregarded it. Therefore, kamarizaite, as an inconspicuous companion of iron sulfates or arsenates (cf. also Kolitsch et al., Reference Kolitsch, Lengauer and Giester2016) might typically have been overlooked. Perhaps this mineral is not as rare as is thought of today.
Surprisingly, kamarizaite has a small stability field in a pH-pε diagram, in a pH range between ~5 and 7 (Fig. 10). Other Fe arsenates or sulfate-arsenates such as parascorodite, kaňkite, bukovskýite, zýkaite, tooeleite, or angelellite do not appear because they are metastable. Kamarizaite would then form as a stable phase from mildly acidic solutions. Under such conditions, however, active acid mine-drainage systems produce hydrous ferric oxide with adsorbed arsenate or schwertmannite, depending on the As/S concentration (Jambor, Reference Jambor, Jambor and Blowes1994). It is, however, important to note that acid mine-drainage systems reach very high supersaturation states via rapid neutralization and dilution. An oxidation zone, such as that in Kamariza, does not need to support such rapid reactions far away from equilibrium. Slow neutralization of locally acidic fluids may sustain them near equilibrium with stable, crystalline phases; one of them being kamarizaite. Skarpelis and Argyraki (Reference Skarpelis and Argyraki2009) stated that “[at Lavrion] mineral deposition in the supergene ore took place under near-neutral to mildly acidic conditions”, as a product of the influx of acidic, metal-laden fluids into the host carbonate rocks. This statement, however, is a generalization as not only marble is in direct contact with the mineralization, but also dark schists, which locally allow for very low pH in weathering solutions. In and on sulfide-rich ore lenses embedded in marble, highly acidic conditions can prevail. In the kamarizaite-bearing stope, no marble was encountered. The stope is fairly dry and no acid mine drainage can be observed. In conclusion, kamarizaite could be expected as an in situ supergene phase in oxidation zones and gossans after massive sulfide/arsenide mineralization where the host rocks have a substantial neutralization capacity or the mineralizing solutions are sufficiently diluted to result in an only mildly acidic environment.
A pε-pH diagram constructed at T = 298.15 K, assuming the activity of 10–3 for dissolved Fe, 10–4 for dissolved As, 10–5 for dissolved S, and 10–2 for dissolved C species. Coarse-grained, bulk goethite and hematite are suppressed from the calculation because their formation is kinetically hindered. Hence, although their stability would account for large fields of either bulk hematite or goethite in this diagram, they are rarely encountered in this form in acid drainage systems. As-HFO = arsenical hydrous ferric oxide.

Stability and scarcity of angelellite
Angelellite is a rare mineral species. The type specimen was found in the Vela Yareta tin mine in Argentina, and assumed to be of exhalative origin (Ramdohr et al., Reference Ramdohr, Ahlfeld and Berndt1959). Angelellite was presumably also found in arsenic-polluted soils (Gomez-Parrales et al., Reference Gomez-Parrales, Bellinfante and Tejada2011) and in Fe–As sludges (Pinisakul et al., Reference Pinisakul, Polprasert, Parkpian and Satayavivad2002). However, in both cases the quantity of angelellite was very small and the identification somewhat questionable. Therefore, it seems that angelellite is restricted to specific high-temperature environments where Fe and As can be transported in a gas phase. In addition, its crystallization can be aided by pre-existing hematite as these minerals are capable of epitaxial intergrowths (Weber, Reference Weber1959, Moore and Araki, Reference Moore and Araki1978).
The predicted solubility of angelellite is substantially higher than that of scorodite (Fig. 7), making it an unsuitable candidate for arsenic disposal. In our work, we have found that arsenic can be incorporated in hematite in the form of angelellite-like nanoclusters (Bolanz et al., Reference Bolanz, Wierzbicka-Wieczorek, Uhlík, Čaplovičová, Göttlicher, Steininger and Majzlan2013). This option could be further explored, and we are currently working on the thermodynamic description of such samples.
Stability and usefulness of scorodite–mansfieldite solid solution for arsenic disposal
The solubility of mansfieldite is much higher than that of scorodite, a fact that had been established for mansfieldite quite some time ago (cf. Le Berre et al., Reference Le Berre, Cheng, Gauvin and Demopoulos2007). Solid solutions (for example, scorodite–mansfieldite), because of their additional stabilization via the entropy of mixing or possibly also the enthalpy of mixing, are also of interest as candidates (with lower solubilities than the currently used options). In the case of mansfieldite–scorodite, the quantitative thermodynamic data were not determined in this work, but some evidence indicates that the solid solution may be non-ideal. Whether ideal or not, the difference between the solubilities of the end-members (scorodite and mansfieldite) is so large that the practical use of this solid solution is difficult to imagine. In order to produce intermediate members of this solid solution, the waste forms would have to be doped with massive amounts of soluble aluminium. Much of this aluminium, however, would not enter the solid arsenate, and instead would remain in the aqueous phase, potentially causing additional environmental problems.
Acknowledgements
We thank Thomas Fockenberg (Bochum) for the Karl-Fischer titration analyses of our samples, Stefan Moser (Eisenstadt) and Pavel Škácha (Příbram) for the permission to publish their photographs (Figs 1a and 2a, respectively), Patrick Haase (Jena) for the scorodite synthesis, and Stefan Kiefer (Jena) for the electron microprobe analyses of kamarizaite. This work was supported financially by a Deutsche Forschungsgemeinschaft grant MA 3927/23-1. UGN is grateful for financial support from the Villum Foundation via the “Villum Young Investigator Programme” (VKR022364) and for the 600 MHz NMR (Villum Center for Bioanalytical Services).
Supplementary material
To view supplementary material for this article, please visit https://doi.org/10.1180/mgm.2018.107