I. INTRODUCTION
Formaldehyde, a volatile organic vapor, is considered to be a toxic air pollutant present in both indoor and outdoor atmospheres. Reference Chen and Yuan1 The release of formaldehyde into the environment from industrial and consumer products like building materials, wood furniture coating, textiles, cleaning products, disinfectants, preservatives, photoprocessing chemicals, and cosmetics is well-known. The outdoor sources arise from combustion of wood, marine environment, and plant physiological and plant atmospheric exchange processes. The permissible long-term exposure is limited to 0.08 parts per million (ppm) for 0.5 h. Reference Salthammer, Mentese and Marutzky2 Considering these factors, it is very important to monitor the concentration of formaldehyde in both indoor and outdoor atmospheres.
Nanostructured materials including metal oxides, conducting polymers, carbon nanotubes, graphene, and nanocomposites based on carbon nanomaterials are being extensively used in gas and vapor sensing applications. Reference Huang and Wan3–Reference Hangarter, Chartuprayoon, Hernández, Choa and Myung7 Owing to their high surface area, nanomaterials can enhance the adsorption of gas molecules and promote the kinetics of the surface processes relevant for gas and vapor sensing. In addition, the ability to control the microstructure of the nanomaterials makes them very attractive for the development of sensors with high sensitivity and fast response time. Semiconducting metal oxides have attracted wide attention in gas and vapor sensing applications due to their high surface to volume ratio, low cost, simple fabrication, high sensitivity and stability, and broad detection range with fast response. Reference Wetchakun, Samerjai, Tamaekong, Liewhiran, Siriwong, Kruefu, Wisitsoraat, Tuantranont and Phanichphant8 Some of the nanostructured metal oxides like tin oxide (SnO2), zinc oxide (ZnO), nickel oxide (NiO), and titanium dioxide (TiO2) have been widely studied for the development of gas and vapor sensor applications. Reference Eranna, Joshi, Runthala and Gupta9
Among these metal oxides, nanostructured ZnO is one of the most prominent n-type semiconducting material with a direct band gap (3.1–3.4 eV at room temperature) and a high exciton binding energy of 60 meV at room temperature. Reference Wang10 During the past few years, different nanoarchitectures of ZnO have been prepared, including nanorods, nanobelts, nanoplates, and nanosheets, and investigated for gas sensing application. Reference Chauhan, Kumar, Umarji, Mulik and Amalnerkar11–Reference Park25 Owing to its high surface area and nontoxic nature along with high thermal, chemical, and mechanical stabilities and good biocompatibility, ZnO has been used as a functional material in a number of technological applications including piezo-electric transducers, dye-sensitized solar cells, bio-imaging and drug delivery, optoelectronic devices, and so on. Reference Zayer, Greef, Rogers, Grellier and Pannell26–Reference Pauporté and Lincot29 In addition to the aforementioned applications, ZnO has been extensively used as an active material for gas sensor applications because of its simple preparation process, high physical and chemical stabilities, high reactivity, and good response toward various oxidizing and reducing gas molecules. Reference Wei, Pan and Huang30 There have been reports on the use of nanostructured ZnO for the detection of several analytes including carbon monoxide, nitrogen dioxide, hydrogen sulphide, carbon dioxide, liquefied petroleum gas, ammonia, acetone, benzene, ethanol, and methanol. Reference Öztürk, Kılınç and Öztürk31–Reference Gao, Zheng, Wei and Lin35 In particular, ZnO has been widely used in formaldehyde sensing due to its simple preparation, low cost, and eco-friendly nature. Reference Mani and Rayappan36–Reference Chu, Chen, Zhang, Zheng and Shui48 However, a majority of the reported ZnO-based formaldehyde sensors operate at temperatures in the range between 100 and 300 °C and this may limit their practical application in field measurements especially in an explosive and low temperature environment. Therefore, it is very important to develop a highly sensitive and stable formaldehyde sensor with fast response time at room temperature.
Over the past few decades, a number of analytical methods including spectrophotometry, gas chromatography, high-performance liquid chromatography, Fourier transform infra-red (FTIR) absorption spectroscopy, and laser induced fluorescence spectroscopy have been used for the detection of formaldehyde. However, these methods require bulky instrumentation with expensive accessories, experienced operators, and consume high power because of high temperature operation. Owing to these limitations, the above-mentioned techniques are not suitable for the real time analysis of formaldehyde detection. Reference Chung, Tzeng, Ke and Lee49 Recently, impedance technique is emerging as a sensing tool for the detection of various analyte species. Reference Hong, Kim, Lee and Min50–Reference Dai, Meng, Meng, Zhou, Yang, Li and Wang53 The main advantage of the impedance technique as applied to a gas sensor calibration lies in its scope for obtaining both high sensitivity and selectivity at room temperature. The adsorption of even very low concentration of gas molecules, i.e., in ppm level, can exhibit an appreciable change in impedance with respect to air at a specified frequency, thus making it a highly sensitive method. Furthermore, as the solid/gas interface characteristics depend on both the nature and concentration of the gas effecting a notable change in the impedance value, high selectivity can be imparted. To the best of our knowledge, there exists only one report on the use of impedance technique for the detection of formaldehyde in the range from 10 to 50 ppm using macroporous titanium dioxide (TiO2) under UV illumination. Reference Liu, Li, Dutta and Wang54
Herein, a comparative study is attempted on the impedimetric detection of formaldehyde with laboratory prepared and commercial (Sigma–Aldrich) ZnO samples. The sensor performance of the two ZnO samples toward formaldehyde is investigated at room temperature in the concentration range from 100 to 800 ppm. To obtain information on the electrical behavior and charge transport processes contributing to the variation in sensor response to the concentration of the formaldehyde, equivalent circuit modeling is applied to analyze the impedance data of two ZnO samples.
II. EXPERIMENTAL
A. Materials and methods
Zinc acetate, hydrazine hydrate, ammonia, and propanol were of analytical grade and purchased from Merck, India. ZnO nanopowder, formaldehyde, methanol, and ethanol were procured from Sigma–Aldrich, India.
B. Synthesis of nanostructured ZnO
Nanostructured ZnO was synthesized by adapting a simple solution method using zinc acetate and hydrazine hydrate as the starting materials. Reference Wahab, Kim and Shin55 Briefly, zinc acetate (6.6 g) was dissolved in 300 mL of double distilled water. About 6 mL (0.4 M) of hydrazine hydrate solution was added dropwise to the aqueous solution and the mixture was stirred for about 7 h at 80 °C. After the reaction, the mixture became clear with a white precipitate at the bottom. The solid white product was filtered off, washed with distilled water and absolute ethanol several times, and then dried in vacuum. A commercial sample of ZnO nanopowder was used as received.
C. Characterization techniques
X-ray diffraction (XRD) patterns were obtained using a diffractometer (Model-PW3050/60 X'pert PRO, PANalytical, Almelo, The Netherlands) with Cu Kα radiation (l = 1.541 Å). The FTIR spectroscopic data were obtained using a Shimadzu spectrometer (Model-8400S, Shimadzu Corporation, Kyoto, Japan). Absorption spectra were obtained with a UV double beam spectrophotometer (Model-V-550, JASCO, Tokyo, Japan). The surface topography was obtained using an atomic force microscope (AFM) (Model-A100 SGS, A.P.E. Research, Basovizza, Italy). The Brunauer–Emmett–Teller (BET) surface area for the two ZnO samples was determined by nitrogen (N2) adsorption–desorption isotherms in a BELSORP-max instrument (MicrotracBEL, Osaka, Japan) at 77 K. Impedance measurements were carried out using a potentiostat/galvanostat (Model-PARSTAT 2273, Princeton Applied Research, Oak Ridge, Tennessee). The electrical parameters were determined by fitting the impedance spectra using the ZSimpWin 3.21 software (Princeton Applied Research).
D. Sensor fabrication and measurements
About 50 mg of the commercial or laboratory prepared ZnO nanopowder was pressed into a pellet by applying a pressure of about 5 metric ton cm−2. A two probe technique was used for the determination of sensor impedance. The electrical leads were taken 0.2 cm apart using two thin copper wires with the help of conductive silver paste on the surface of the pellet. The pellet was then placed in a glass chamber of volume 1000 mL. The volume of formaldehyde (V in μL) required to achieve a specific vapor concentration in ppm inside the test chamber was obtained using the relation Reference Peng, Qin, Zeng, Song, Lei, Mwangi, Wang and Xie56
 $$V = {{C{V_{\rm{a}}}M} \over {\left( {2.46 \times {{10}^7}} \right) \times D}}\quad ,$$
where C is the required gas concentration (ppm), V a is the volume of the air which is equal to the volume of test chamber (mL), M is the molecular weight of formaldehyde (g/mol), and D is the density of formaldehyde (g/mL). The formaldehyde sensing properties of the pellets were investigated by injecting the desired concentration of formaldehyde into the glass chamber. After allowing sufficient time for equilibrium, the electrical impedance was measured in the frequency range between 1 Hz and 1 MHz. The sensor response was calculated by using the relation [Eq. (2)] Reference Rheaume and Pisano57
 $${\rm{Sensor\ response}} = {{|{Z_{\rm{a}}}|} \over {|{Z_{\rm{g}}}|}}\quad ,$$
where |Z a| and |Z g| are the moduli of the impedance values in air and in the presence of formaldehyde, respectively, at a defined frequency value of 1 kHz.
III. RESULTS AND DISCUSSION
A. Material characterization
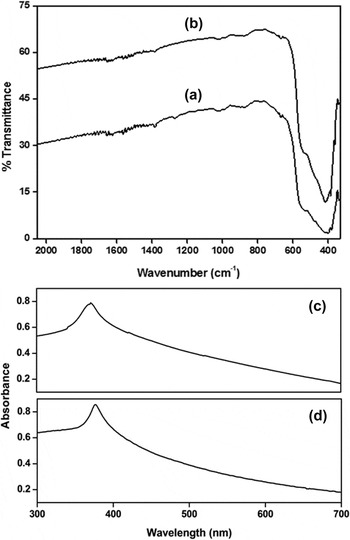
The FTIR spectra of laboratory prepared and commercial ZnO samples are shown in Figs. 1(a) and 1(b), respectively. Both the spectra are remarkably similar, with a prominent band at about 410 cm−1 corresponding to the Zn–O stretching vibration. Reference Yang, Liu, Yu, Zou, Wang and Wang58 The absence of any other functional peak in the spectra ascertains good purity of both the samples. Figures 1(c) and 1(d) show the ultraviolet (UV)–visible absorption spectra of the two ZnO samples. The absorption maxima values, i.e., 371 nm for laboratory prepared sample [Fig. 1(c)] and 376 nm for commercial sample [Fig. 1(d)], are significantly lower compared to the reported value of 400 nm for the bulk ZnO. Reference Chen, Qiao, Liu and Yang59 The large blue shift of the absorption maximum is caused by quantum confinement effects, indicative of a great reduction in the size of ZnO particles.
FTIR spectra of (a) laboratory prepared sample and (b) commercial ZnO sample; UV–visible spectra of (c) laboratory prepared ZnO sample and (d) commercial ZnO sample.

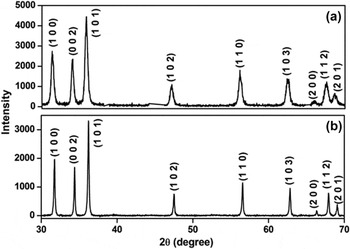
Figure 2 shows the XRD patterns of laboratory prepared and commercial ZnO samples. Both the samples show similar crystalline peaks with very high intensity indicating their good crystallinity. The nine diffraction peaks at 2θ = 31.35°, 34.07°, 35.86°, 47.16°, 56.13°, 62.48°, 65.94°, 67.58°, and 68.70° can be assigned to the (100), (002), (101), (102), (110), (103), (200), (112), and (201) planes of hexagonal wurtzite structure of ZnO. Reference Kannan, Saraswathi and Rayappan60 The lattice constants of both the ZnO samples were calculated by using the equation [Eq.(3)]
 $${1 \over {d_{hkl}^2}} = {4 \over 3}{{{h^2} + hk + {k^2}} \over {{a^2}}} + {{{l^2}} \over {{c^2}}}\quad ,$$
where h, k, and l are lattice planes and d is the interplanar distance. The estimated lattice constant values of both the ZnO samples are a = b = 3.24 Å and c = 5.20 Å, which were found to be in good agreement with the standard Joint Committee on Powder Diffraction Standards (JCPDS) data. Reference Chen, Yang, He and Lee61 However, the laboratory prepared sample shows somewhat broader crystalline peaks implying a smaller crystallite size. Applying the Debye–Scherrer equation, Reference Alexander and Klug62 the grain size for all the peaks of two ZnO samples are calculated, giving an average size of 26 nm for the laboratory prepared sample in comparison with 45 nm for the commercial sample.
XRD patterns of ZnO: (a) laboratory prepared sample and (b) commercial sample.

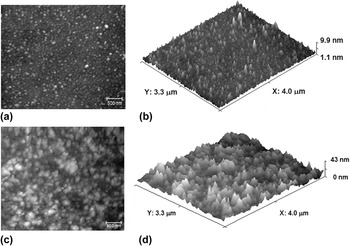
Figures 3(a) and 3(b) show the 2D and 3D AFM images of the laboratory prepared ZnO sample. The image shows evenly distributed ZnO nanoparticles of size 38 nm. For commercial nano-ZnO sample, the 2D and 3D AFM images [Figs. 3(c) and 3(d)] show uniform spherical clusters with an average size of about 75 nm. From the XRD data, the grain sizes of the laboratory and commercial ZnO samples are 26 and 45 nm, respectively, which are somewhat lower than those obtained from the AFM data. This difference can be understood by the fact that the particle size measured from AFM is actually that of aggregated grains. Reference Lee, Hu, Water, Tiong, Feng, Chen, Huang, Lee, Huang and Shen63
AFM characterization of ZnO: (a and b) 2D and 3D images of laboratory prepared sample; (c and d) 2D and 3D images of commercial sample.

B. Formaldehyde sensing behavior
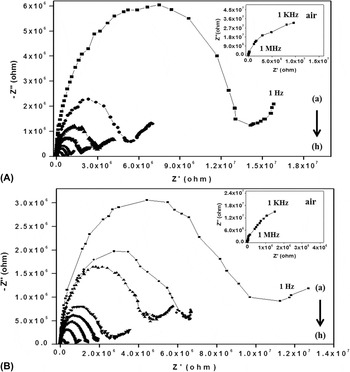
At first, for reference, the complex impedance plot was measured in air for both the ZnO samples, which shows an arc with a large curvature radius between 1 kHz and 1 MHz [inset in Figs. 4(A) and 4(B)]. Figure 4 shows the complex impedance plots obtained when the laboratory prepared and commercial nano-ZnO samples were exposed to formaldehyde vapor in the concentration range of 100–800 ppm at room temperature. Both the samples show a similar response to formaldehyde in which the impedance plots are characterized by the presence of a semicircle along with a spur in the low-frequency region. With increasing concentration of formaldehyde, the frequency range over which the spur is observed becomes slightly increased (1–17 Hz at 100 ppm and 1–281 Hz at 800 ppm for laboratory prepared ZnO; 1–35 Hz at 100 ppm and 1–224 Hz at 800 ppm for commercial ZnO). The spur is associated with a diffusion process which is related to the amount of formaldehyde adsorbed on the ZnO. Reference Varghese and Grimes64 Both the ZnO samples are found to show very good response to the varying concentration of formaldehyde in which the charge transfer resistance, R ct (represented by the diameter of the arc), is found to decrease with increasing concentration of formaldehyde. The data can be analyzed further in terms of loss spectra (Fig. S1, Supplementary Material), which can be obtained by plotting the magnitude of the imaginary component of complex impedance (Z″) against log (frequency, f). Reference Barik, Choudhary and Mahapatra65 This kind of data representation can be used to derive information on the dynamics of electrical relaxation process occurring in the material. The frequency at which Z″ remains a maximum is known as the relaxation frequency (f r) and is given by f r = 1/(2πτ), where τ is the relaxation time. Table SI shows the data on relaxation frequency (f r) for the two ZnO samples. The f r values are found to shift to higher frequencies with increasing concentration of formaldehyde. This means that the relaxation time, τ, decreases with increasing concentration of formaldehyde implying a fast electron transfer. This is the reason for the decrease in the radius of the semicircle (R et) in the complex impedance plots. This corroborates with the observation that the magnitude of Z″ decreases as the formaldehyde concentration is increased.
Complex impedance plots for the sensor made with (A) laboratory prepared ZnO sample and (B) commercial ZnO sample; concentration of formaldehyde: (a) 100 ppm, (b) 200 ppm, (c) 300 ppm, (d) 400 ppm, (e) 500 ppm, (f) 600 ppm, (g) 700 ppm, and (h) 800 ppm. Insets in A and B show the complex impedance plots of the respective ZnO sample measured in air.

The mechanism of sensing of formaldehyde by the n-type ZnO can be explained on the basis of oxygen ionosorption model.
Reference Hou, Huang, Han and Pan66
Accordingly, oxygen molecules physisorbed on the surface of ZnO will capture free electrons from its conduction band to form ionosorbed oxygen species [Eqs. (4)–(7)]. The nature of ionosorbed oxygen on the surface will vary depending on the sensor operating temperature. If the sensor operating temperature is below 150 °C, the molecular form
 $\left( {{\rm{O}}_2^ - } \right)$
dominates, and if the operating temperature is above 150 °C, the atomic form (O−) dominates,
Reference Gurlo67
 $${\rm{Physisorption:}}\;{{\rm{O}}_{2\left( {{\rm{gas}}} \right)}} \to {{\rm{O}}_{2\left( {{\rm{ads}}} \right)}}\quad .$$
Ionosorption:
 $${{\rm{O}}_{2\left( {{\rm{ads}}} \right)}} + {{\rm{e}}^ - } \to {\rm{O}}_{2({\rm{ads}})}^ - \quad {\rm{RT - }}150\;^\circ {\rm{C}}\quad ,$$
 $${\rm{O}}_{2({\rm{ads}})}^ - + {{\rm{e}}^ - } \to 2{\rm{O}}_{({\rm{ads}})}^ - \quad 150\;^\circ {\rm{C}} - 300\;^\circ {\rm{C}}\quad ,$$
 $$2{\rm{O}}_{({\rm{ads}})}^ - + {{\rm{e}}^ - } \to {\rm{O}}_{({\rm{ads}})}^{2 - } > 300\;^\circ {\rm{C}}\quad .$$
Considering the fact that the present data are obtained at room temperature,
 ${\rm{O}}_2^ -$
is the most likely species to interact with the formaldehyde molecules releasing the trapped electrons back to the conduction band [Eq. (8)].
Reference Deng, Ding, Zeng, Tian, Li and Xie68
Therefore, an increase in the concentration of formaldehyde will eventually lead to a decrease in the impedance value of ZnO,
 $$2{\rm{HCHO}} + 2{\rm{O}}_2^ - \to 2{\rm{C}}{{\rm{O}}_2} + 2{{\rm{H}}_2}{\rm{O}} + 2{{\rm{e}}^ - }\quad .$$
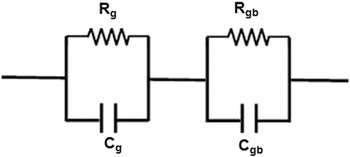
To obtain information on the electrical behavior and the charge transport processes contributing to variation in response to the nature and concentration of formaldehyde, equivalent circuit modeling has been applied to the experimental impedance data. The most satisfactory equivalent circuit models for the observed impedance data are shown in Fig. 5 with two resistance and capacitance components. The presence of two resistance components (R g, R gb) with parallel capacitance elements (C g, C gb) acting in series confirm the existence of two charge transport processes, viz., through grain (g) and grain boundaries (gb). This means that the total impedance value of the sensor arises from the contributions of two different regions, i.e., from grain interior and grain boundary regions. The impedance parameters extracted from the equivalent circuit modeling for the two ZnO samples are given in Tables SII & SIII (Supplementary Material). It can be observed that both the R g and R gb values vary by one order in the range of concentration of formaldehyde used indicating that both inter-grain and grain boundary regions contribute to formaldehyde sensitivity. The capacitance values do not show a significant change which suggests that formaldehyde affects mainly the surface charge region of ZnO.
Electrical circuit used for the modeling of impedance data obtained for the two ZnO pellet samples measured in the presence of formaldehyde.

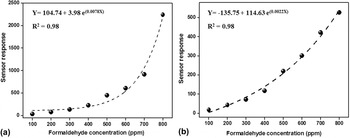
The variation in sensor response against the formaldehyde concentration from 100 to 800 ppm is shown in Fig. 6. It can be observed that for both the ZnO samples, the sensor response increases with increase in the formaldehyde concentration. The sensor response of laboratory prepared ZnO [Fig. 6(a)] is increased from 35.9 to 2242.1 when the formaldehyde concentration is increased from 100 to 800 ppm. Similarly for commercial ZnO [Fig. 6(b)], the sensor response increases from 18.2 at 100 ppm to 526.8 at 1000 ppm. The plots of the sensor response against the formaldehyde concentration for both the laboratory prepared and commercial ZnO samples can be fitted to an exponential correlation. From the sensor calibration plots, it has been observed that between the two ZnO samples, the laboratory prepared ZnO shows a better response to formaldehyde compared to commercial ZnO.
Calibration plot of the formaldehyde sensor based on ZnO: (a) laboratory prepared sample and (b) commercial sample.

The variation in sensor responses of the two ZnO samples can be attributed to the difference in the grain size, which is an important factor controlling the sensitivity of metal oxide gas sensors. The sensor sensitivity is generally related to 1/D where D is the grain size of the material. Reference Rothschild and Komem69 Xu et al. developed a semiquantitative model in which it has been proposed that the sensitivity is enhanced considerably when D ≪ 2L, where L is the width of the space-charge (depletion) region that is produced at the surface of the crystallites due to chemisorbed anions. Reference Xu, Tamaki, Miura and Yamazoe70 The increased sensitivity of the laboratory synthesized ZnO toward the detection of formaldehyde in comparison with that of the commercial sample can be attributed to its lower grain size (26 nm) as deduced from the XRD data. To substantiate this, the specific surface area of the two samples was measured by the BET method (Fig. S2, Supplementary Material) and found to be 21.6 m2/g and 11.8 m2/g for the laboratory prepared and commercial ZnO samples, respectively. The high surface area of the lab-synthesized ZnO can provide a large reaction contact area between the ZnO nanocrystallites and formaldehyde, resulting in an enhanced sensitivity.
There have been many reports on chemiresistive formaldehyde sensors based on different morphologies of the nano-ZnO. Reference Mani and Rayappan36–Reference Chu, Chen, Zhang, Zheng and Shui48 Table I presents a compilation of the comprehensive sensor data based on these reports in the literature. It is obvious that the sensitivity value is highly dependent on the morphology of the material, operating temperature, and formaldehyde concentration. A high sensitivity value of 314 has been reported for ZnO micro-octahedrons, which was attributed to the presence of abundant electron donor defects aiding in the production of more ionized oxygen species for the effective oxidation of formaldehyde. Reference Zhang, Zhao, Lu, Gong, Li, Zheng, Li and Zhu44 Also, it can be noted that the sensors with operating temperature above 200 °C showed very high sensitivity value. There have been only two nano-ZnO-based chemiresistive formaldehyde sensors developed for use at room temperature. Reference Bai, Li, Xu, Zhou, Gu, Tao, Liu, Fang and Xu37,Reference Li and Wang47 The impedance sensors developed in the present study gains advantage in terms of showing a better sensitivity at room temperature enabling the detection of formaldehyde vapor of concentration as low as 100 ppm. It may also be mentioned here that the response of the present ZnO-based room temperature impedance sensor toward formaldehyde is better than the earlier reported impedance sensor based on porous TiO2 under UV illumination. Reference Liu, Li, Dutta and Wang54
Comparison of the presently developed impedance sensor parameters with those of the chemiresistive sensors based on nano-ZnO reported in the literature for the detection of formaldehyde.

C. Response, recovery, stability, and selectivity
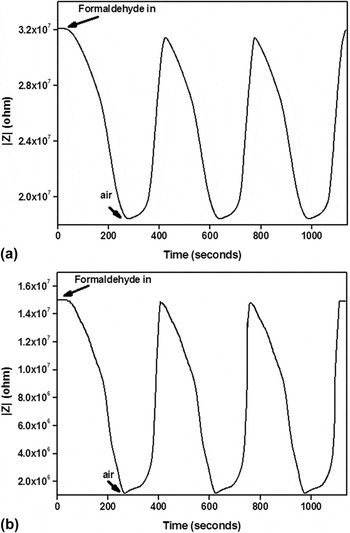
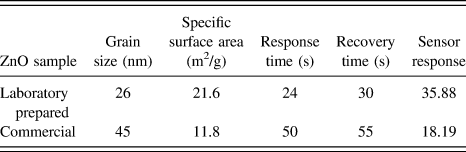
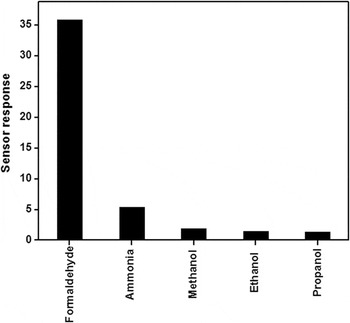
Figure 7 shows the response–recovery curves of the two ZnO pellet sensors obtained at 100 ppm of formaldehyde at a frequency value of 1 kHz. From the data, the response and recovery time values of the sensor are calculated and shown in Table II. The laboratory prepared ZnO shows nearly two times faster response and recovery time compared to the commercial nano-ZnO sample. Both sensors show good stability (signal deviation less than 1%) over a time period of 30 days (Fig. S3, Supplementary Material). The selectivity nature of the laboratory prepared ZnO toward formaldehyde has been studied by exposing its pellet to 100 ppm of various reducing gases such as ammonia, methanol, ethanol, and propanol and the corresponding sensor response data are shown in Fig. 8. From the data, it can be clearly observed that the laboratory prepared ZnO shows the highest sensor response to formaldehyde compared to other reducing vapors.
Dynamic response of the ZnO sensor at 100 ppm of formaldehyde for (a) laboratory prepared sample and (b) commercial sample.

Comparison of grain size and specific surface area of the two ZnO samples along with their response, recovery, and sensor response data at 100 ppm of formaldehyde.

Selective response of the sensor based on laboratory prepared ZnO toward formaldehyde in comparison with other reducing vapors each at a concentration of 100 ppm.

IV. CONCLUSIONS
An impedance sensor for formaldehyde operating at room temperature has been developed using laboratory prepared ZnO and commercial ZnO. Both the samples have been systematically characterized by XRD, FTIR, UV–visible spectroscopy, and AFM techniques. The impedance measurements have been carried out for both the samples in the formaldehyde concentration range of 100–800 ppm. An equivalent circuit fitting has been used to analyze the impedance data and it has been observed that for the two ZnO samples, the gas sensitivity arises from the contribution of both grain interior and grain boundary regions. The comparative study shows that between the two ZnO samples, the sensor based on the laboratory prepared ZnO having a higher specific surface area exhibits a better performance with the sensor response value of about 35.88 at 100 ppm and a response and recovery time of 24 and 30 s, respectively.
Supplementary Material
To view supplementary material for this article, please visit https://doi.org/10.1557/jmr.2017.172
ACKNOWLEDGMENTS
Financial support from the University Grants Commission, New Delhi, Government of India under the University with Potential for Excellence Scheme is gratefully acknowledged. Authors also thank Dr. P. Puthiaraj, Inha University, Incheon, Republic of Korea for the BET measurements.