



1 Introduction
Boundary-layer transition at hypersonic flow speeds is of particular importance to the design of respective flight vehicles, influencing the heat load and aerodynamic drag which are to be minimized for sustained flight. It is essential to understand how discrete surface roughness influences the laminar–turbulent transition mechanisms. A huge number and variety of experiments have been conducted under cold wind-tunnel conditions, see e.g. Holloway & Sterret (Reference Holloway and Sterret1964), Fujii (Reference Fujii2006), Casper et al. (Reference Casper, Wheaton, Johnson and Schneider2008), Schneider (Reference Schneider2008), as well as hot flight conditions, e.g. Reda (Reference Reda2002), Berry & Horvath (Reference Berry and Horvath2007), Spanos & Micklos (Reference Spanos and Micklos2010). A variety of roughness geometries have been examined, mostly with a symmetrical alignment of the roughness element with respect to the oncoming flow.
Theofilis (Reference Theofilis2011) reviews the linear stability theory (LST) and analysis of complex two- and three-dimensional flows based on a two- (biglobal LST) or three-dimensional (triglobal LST) eigenfunction methodology. The classical (monoglobal) LST has been applied by Marxen, Iaccarino & Shaqfeh (Reference Marxen, Iaccarino and Shaqfeh2010) to clarify the mechanisms of disturbance growth past two-dimensional surface roughness in hypersonic flat-plate boundary-layer flow. The biglobal LST has been successfully applied to incompressible swept-wing-type flow with cross-flow by, e.g. Koch et al. (Reference Koch, Bertolotti, Stolte and Hein2000) and Bonfigli & Kloker (Reference Bonfigli and Kloker2007). Choudhari et al. (Reference Choudhari, Li, Chang, Norris and Edwards2012), DeTullio et al. (Reference DeTullio, Paredes, Sandham and Theofilis2013), Groskopf, Kloker & Marxen (Reference Groskopf, Kloker, Marxen, Schlatter and Henningson2010a ), Groskopf, Kloker & Stephani (Reference Groskopf, Kloker and Stephani2011) and Groskopf & Kloker (Reference Groskopf and Kloker2012) applied biglobal LST to supersonic and hypersonic flat-plate flows altered by discrete three-dimensional roughness elements, identifying the dominant instability modes due to the trailing vortices and ensuing velocity streaks in the wake of the elements. Paredes and Theofilis, see DeTullio et al. (Reference DeTullio, Paredes, Sandham and Theofilis2013), confirmed biglobal LST with a non-local, downstream marching method based on the parabolized stability equations (PSEs). Another approach, triple-deck theory, has been applied for transonic flow by Mengaldo et al. (Reference Mengaldo, Kravtsova, Ruban and Sherwin2015).
The progress on laminar–turbulent breakdown in high-speed boundary layers based on spatial direct numerical simulation has been summarized by Zhong & Wang (Reference Zhong and Wang2012) including a section about surface roughness.
Two-dimensional isolated roughness elements in a Mach-4.8 flat-plate flow have been investigated by Marxen et al. (Reference Marxen, Iaccarino and Shaqfeh2010), Marxen, Iaccarino & Shaqfeh (Reference Marxen, Iaccarino and Shaqfeh2014). It is shown that a roughness with a size of up to 70 % of the undisturbed boundary-layer thickness alters the stability properties of the flow only locally, representing a disturbance amplifier with a limited bandwidth. The two-dimensional scenario seems not likely to lead to transition. Redford, Sandham & Roberts (Reference Redford, Sandham and Roberts2010) conducted direct numerical simulation (DNS) for an isolated three-dimensional roughness varying the roughness height Reynolds number, Mach number and wall-temperature conditions to develop a transition correlation. Bernardini, Pirozzoli & Orlandi (Reference Bernardini, Pirozzoli and Orlandi2012) carried out DNS of roughness-induced flat-plate boundary-layer transition in the range
 $0\leqslant Ma_{\infty }\leqslant 4$
for roughness heights of 25 %–65 % of the boundary-layer thickness
 $\unicode[STIX]{x1D6FF}$
deriving another transition criterion. DeTullio et al. (Reference DeTullio, Paredes, Sandham and Theofilis2013) investigated the linear and nonlinear disturbance evolution including the breakdown to turbulence in a Mach-2.5 boundary layer downstream of an isolated roughness in terms of DNS and biglobal LST in PSE fashion. The roughness element is a sharp-edged cube. The roughness heights were chosen according to the transition criteria of Redford et al. (Reference Redford, Sandham and Roberts2010) and Bernardini et al. (Reference Bernardini, Pirozzoli and Orlandi2012) to generate one sub-critical and one transitional case. The latter case shows early transition due to a ‘highly unstable wake’. According to the biglobal stability analysis, the two most unstable modes with varicose and sinuous characteristics, respectively, deform the low-speed streak that is generated in the wake centreline of the roughness. The varicose mode shows the larger growth rate on average. Furthermore, DeTullio et al. (Reference DeTullio, Paredes, Sandham and Theofilis2013) found that in DNS a superposition of both modes at similar amplitudes can lead to a disturbance-energy growth that is stronger than that of the most unstable mode alone.
DeTullio & Sandham (Reference DeTullio and Sandham2015) performed DNS of a Mach-6 boundary layer disturbed by a square cuboid with a height of 54 % of the boundary-layer thickness. They identified three characteristic wake modes: a sinuous (SL) and a varicose (VL) mode induced by the lateral shear surrounding the low-speed streak and a lower-situated varicose mode (VC) not unlike the second (Mack) mode. The varicose modes were found to be most unstable and excited by the first and second mode developing laterally outside the wake, whereas mode SL is excited by damped global modes in the recirculation bubble that originate from oblique acoustic waves in the free stream. Wall cooling could be shown to strongly stabilize mode VC, contrary to the second mode itself, and weakly stabilize the other modes. van den Eynde & Sandham (Reference van den Eynde and Sandham2015) investigated various roughness shapes in a Mach-6 flow showing that, for identical roughness Reynolds numbers, the disturbance growth downstream the roughness is reduced significantly by downramping the roughness smoothly, due to weaker shear layers in the wake. The comparison of a sharp- and a smooth-edged rectangular profile is not shown but the results imply that large differences can only be gained by a strong decrease of the rear-side slope’s absolute value. This is in accordance with von Doenhoff & Braslow (Reference von Doenhoff, Braslow and Lachmann1961), see also Kurz & Kloker (Reference Kurz and Kloker2016), showing limited influence of the roughness shape, and, thus, the edge form, in subsonic flow.
In subsonic flow the term ‘critical roughness Reynolds number’ is used to define a threshold to global, in the sense of absolute, instability with transition occurring immediately at the (isolated) three-dimensional roughness element, see e.g. Kurz & Kloker (Reference Kurz and Kloker2016). In supersonic or even hypersonic flat-plate flow, transition to turbulence mostly occurs due to convective instabilities which may look like a global one in experiments if the extent of laminar flow downstream of the roughness element is short, see, e.g. Bartkowicz, Subbareddy & Candler (Reference Bartkowicz, Subbareddy and Candler2010). Casper et al. (Reference Casper, Wheaton, Johnson and Schneider2008), Schneider (Reference Schneider2008) and Subbareddy, Bartkowicz & Candler (Reference Subbareddy, Bartkowicz and Candler2014) show that for the investigated roughness set-ups there always is a finite streamwise distance between the roughness location and the transition location. Absolute instability has not been observed. So far, in supersonic flow, a roughness often is called super-critical in the literature if it just promotes transition significantly without necessarily triggering it immediately through global instability. In the present work a terminology analogous to Kurz & Kloker (Reference Kurz and Kloker2016) is adopted to distinguish the following cases: the ‘critical’ limit separates scenarios of global and convective-only instabilities. The sub-critical cases are further separated by a ‘promotive’ limit separating significant (promotive) and insignificant (non-promotive) influence on the transition location, respectively.
Many different correlations have been developed based on experimental as well as numerical data to find a criterion for laminar–turbulent transition in high-speed boundary layers induced by three-dimensional roughness elements. Mostly, some kind of roughness Reynolds number is applied defining a critical or promotive threshold that is either constant or dependent on further flow quantities. Reda (Reference Reda2002) prefers the roughness Reynolds number
 $Re_{kk}=\tilde{\unicode[STIX]{x1D70C}}_{k}\tilde{u} _{k}\tilde{k}/\tilde{\unicode[STIX]{x1D707}}_{k}$
based on the flow quantities of the undisturbed flow at the roughness position
 $\tilde{x}_{r}$
and height
 $\tilde{k}$
(dimensional quantities are marked by superscript
 $\tilde{}$
,
 $\unicode[STIX]{x1D70C}$
is density,
 $u$
streamwise velocity and
 $\unicode[STIX]{x1D707}$
denotes the dynamic viscosity). Berry & Horvath (Reference Berry and Horvath2007) and Horvath, Berry & Merski (Reference Horvath, Berry and Merski2004) include the wall-temperature boundary condition indirectly in a correlation coefficient. Reshotko & Tumin (Reference Reshotko and Tumin2004) suggest that transient (non-modal) growth plays an important role in early transition due to roughness effects. Their criterion also includes wall-temperature effects. Nowadays,
 $Re_{kk}$
is understood to be the relevant parameter, see Groskopf et al. (Reference Groskopf, Kloker, Stephani, Marxen and Iaccarino2010b
), Bernardini et al. (Reference Bernardini, Pirozzoli and Orlandi2012), Choudhari et al. (Reference Choudhari, Li, Chang, Norris and Edwards2012), Groskopf & Kloker (Reference Groskopf and Kloker2012) and Bernardini et al. (Reference Bernardini, Pirozzoli, Orlandi and Lele2014). Redford et al. (Reference Redford, Sandham and Roberts2010) introduce the additional parameter
 $Ma_{kk}/T_{w}$
to emphasize the influence of the wall temperature on roughness-induced transition.
 $Ma_{kk}$
is the roughness Mach number based on the flow quantities of the undisturbed flow at the roughness position. Bernardini et al. (Reference Bernardini, Pirozzoli and Orlandi2012) suggest a modified roughness Reynolds number
 $Re_{kk}^{\ast }$
involving the kinematic viscosity at the wall to include the effect of wall temperature. Note that for sustained hypersonic flight the wall is cooled by radiation of heat, and the wall temperature
 $T_{w,ra}$
is in radiative equilibrium (radiation adiabatic condition). It has been shown that in this case the wall-temperature increase along transition is distinctive because
 $T_{w,ra}$
scales with
 $\unicode[STIX]{x1D6FF}_{eff}^{-1/4}$
, the effective shear-layer thickness, that reduces significantly, see the book of Hirschel (Reference Hirschel2005), §§ 3 and 7 and the DNS of Fezer & Kloker (Reference Fezer and Kloker2003).
So far, none of the approaches account for a skewness of the roughness, inducing a strong asymmetry of the wake. Concentrating on the low-disturbance-amplitude scenario, the present work deals with increased eigenmode growth in the wake of skew discrete roughness elements with a height smaller than the local boundary-layer thickness in the unperturbed flat-plate flow. In § 2 the numerical procedure and the computational set-up are described. Section 3 compares the steady base flows for various parameter set-ups, including cold adiabatic and hot cooled-wall flow. In § 4 these base flows are analysed applying the biglobal linear stability theory. In § 5 the results from unsteady DNS are discussed and compared to the stability analysis, and the nonlinear disturbance evolution followed by breakdown to turbulence is investigated for a point-source excitation.
2 Methodology
2.1 Governing equations
The three-dimensional unsteady Navier–Stokes equations for a compressible fluid are the basis for the following investigations. They are applied in a non-dimensional form. The reference length is
 $\tilde{L}$
(
 $\;\tilde{\text{}}$
marks dimensional quantities), velocities
 $u$
,
 $v$
and
 $w$
in streamwise (
 $x$
), wall normal (
 $y$
) and spanwise (
 $z$
) directions are normalized by the free stream velocity
 $\tilde{u} _{\infty }$
. For density
 $\unicode[STIX]{x1D70C}$
and temperature
 $T$
the respective free stream values are used as reference. The non-dimensional pressure
 $p$
is based on the reference value
 $\tilde{\unicode[STIX]{x1D70C}}_{\infty }\tilde{u} _{\infty }^{2}$
.
For the DNS the equations are applied in conservative formulation. See Keller & Kloker (Reference Keller and Kloker2015) for the complete set of equations. Reynolds number
 $Re_{\infty }$
, Prandtl number
 $Pr_{\infty }$
and Mach number
 $Ma_{\infty }$
are also based on the free stream values and
 $\tilde{L}$
. A calorically perfect gas behaviour is assumed, also under atmospheric-flight conditions. The influence of thermally perfect gas properties, including the bulk viscosity, are neglected. Thus, for the hot-flow cases a worst case scenario is investigated since the neglected effects have a relaxing influence leading to lower disturbance growth rates especially for flat-plate second-mode instabilities, see, e.g. Bertolotti (Reference Bertolotti1998) and Linn & Kloker (Reference Linn, Kloker, Schlatter and Henningson2010).
The equations of the biglobal linear stability theory (B-LST) are formulated in primitive variables. All flow quantities are split into their steady base-flow part
 $\unicode[STIX]{x1D6F7}_{b}$
and unsteady perturbation part
 $\unicode[STIX]{x1D6F7}^{\prime }$
, where
 $\unicode[STIX]{x1D6F7}$
refers to any of the primitive variables:
 $\unicode[STIX]{x1D6F7}(x,y,z,t)=\unicode[STIX]{x1D6F7}_{b}(x,y,z)+\unicode[STIX]{x1D6F7}^{\prime }(x,y,z,t)$
. The employed base flow is assumed to be parallel
 $(\unicode[STIX]{x2202}/\unicode[STIX]{x2202}x\equiv 0)$
, resulting in a local theory with respect to the main flow direction
 $x$
. This does not imply, in contrast to LST or monoglobal secondary LST, that
 $v_{b}\equiv 0$
which would eliminate any possibility of investigating vortices in a cross-cut plane. The only restriction to be made in spanwise periodic flows is that the spanwise mean, marked with
 $\langle \;\rangle$
or, in spectral space, the zeroth mode of the wall-normal velocity is zero. Small perturbations are assumed for the linearisation. The modal perturbation ansatz:
 $$\begin{eqnarray}\displaystyle \unicode[STIX]{x1D6F7}^{\prime }(x,y,z,t)=\hat{\unicode[STIX]{x1D6F7}}(y,z)\cdot \text{e}^{\text{i}(\unicode[STIX]{x1D6FC}x-\unicode[STIX]{x1D714}t)}+\text{c.c.} & & \displaystyle\end{eqnarray}$$
is applied, where
 $\hat{\unicode[STIX]{x1D6F7}}(y,z)$
is the corresponding complex amplitude distribution and
 $\unicode[STIX]{x1D6FC}$
and
 $\unicode[STIX]{x1D714}$
describe the spatial wavenumber in the
 $x$
-direction and the frequency, respectively, both of which can be complex. For the temporal approach,
 $\unicode[STIX]{x1D6FC}=\unicode[STIX]{x1D6FC}_{r}\in \mathbb{R}$
,
 $\unicode[STIX]{x1D714}=\unicode[STIX]{x1D714}_{r}+\text{i}\cdot \unicode[STIX]{x1D714}_{i}\in \mathbb{C}$
, with temporal amplification for growth rate
 $\unicode[STIX]{x1D714}_{i}>0$
the complex linear eigenvalue problem
 $$\begin{eqnarray}\displaystyle \unicode[STIX]{x1D63C}\hat{\boldsymbol{q}}=\unicode[STIX]{x1D714}\unicode[STIX]{x1D63D}\hat{\boldsymbol{q}}, & & \displaystyle\end{eqnarray}$$
with coefficient matrices
 $\unicode[STIX]{x1D63C}$
and
 $\unicode[STIX]{x1D63D}$
results. The square matrices are of size
 $L(\hat{\boldsymbol{q}})\times L(\hat{\boldsymbol{q}})=5N\times 5N$
for the unknown perturbation amplitudes at
 $N$
grid points. Instead of solving the computationally more costly eigenvalue problem (EVP) for the spatial approach
 $(\unicode[STIX]{x1D714}=\unicode[STIX]{x1D714}_{r}\in \mathbb{R},\unicode[STIX]{x1D6FC}=\unicode[STIX]{x1D6FC}_{r}+\text{i}\cdot \unicode[STIX]{x1D6FC}_{i}\in \mathbb{C})$
, with spatial amplification for growth rate
 $\unicode[STIX]{x1D6FC}_{i}<0$
, Gaster’s relation (Gaster Reference Gaster1962) is applied:
 $\unicode[STIX]{x1D6FC}_{i}=-\unicode[STIX]{x1D714}_{i}/c_{gr}$
, with group velocity
 $c_{gr}$
. This relation has been applied by, e.g. Koch et al. (Reference Koch, Bertolotti, Stolte and Hein2000) and Bonfigli & Kloker (Reference Bonfigli and Kloker2007) for secondary linear stability analyses of incompressible cross-flow vortices. Just as for the incompressible flows, the results from Gaster’s relation are found to agree excellently with the spatial solution of the eigenvalue problem for the present compressible flow cases, see Groskopf et al. (Reference Groskopf, Kloker, Stephani, Marxen and Iaccarino2010b
). Alternative base-flow representations, as applied by Bonfigli & Kloker (Reference Bonfigli and Kloker2007), have been investigated in a compressible formulation for the present flows. In contrast to Bonfigli & Kloker (Reference Bonfigli and Kloker2007) an improvement with respect to the DNS results has not been achieved which is likely due to the lack of a strong cross-flow component and, thus, less pronounced streamwise gradients.
2.2 Numerical methods
For a detailed description of the basic algorithm of the DNS solver and the numerical method see Kloker (Reference Kloker1998), Babucke et al. (Reference Babucke, Linn, Kloker, Rist and Resch2006), Babucke, Kloker & Rist (Reference Babucke, Kloker and Rist2007) and Keller & Kloker (Reference Keller and Kloker2015). The discretisation accuracy of the solver is fourth order in time, and sixth order in space based on compact finite differences (FDs). A compact filter scheme of tenth order according to Visbal & Gaitonde (Reference Visbal and Gaitonde2002) is used to stabilize the base-flow simulations due to the weak shocks occurring downstream of the roughness elements. The equations are solved on a structured curvilinear grid, with equidistant spacing in
 $x$
and
 $z$
, see table 1. In wall-normal direction the grid is stretched with a third-order polynomial with
 $\unicode[STIX]{x0394}y_{min}=0.002$
at the wall. This corresponds to 1.1 % of the undisturbed boundary-layer thickness at the roughness location, which is resolved by a total of 75 grid points in case of the three-dimensional medium grid of table 1.
Dimensions of the computational domain, see figure 1(a) for a sketch, with
 $NX$
,
 $MY$
and
 $KZ$
grid points in
 $x$
-,
 $y$
- and
 $z$
-direction, respectively.

(a) Sketch of computational domain. Disturbance forcing at
 $x=x_{f}$
. (b) Computational grid at the roughness surface; every second grid line is shown.

The roughness elements are modelled using a body-fitted grid, see figure 1(b), demanding smooth element edges to avoid the risk of introducing spurious oscillations. DeTullio et al. (Reference DeTullio, Paredes, Sandham and Theofilis2013) and DeTullio & Sandham (Reference DeTullio and Sandham2015) apply a block-grid approach, thus, being limited to sharp-edged rectangular block configurations.
Spanwise periodicity is assumed based on the domain width
 $\unicode[STIX]{x1D706}_{z}$
. For steady flow, all flow quantities are fixed to a self-similar boundary-layer solution at the inflow plane
 $x=x_{1}$
. At the free stream boundary
 $y=y_{2}$
, the reflection of impinging (shock) waves is minimized by prescribing vanishing flow-variable gradients along the outgoing spatial characteristics. At the wall,
 $y=y_{1}$
(index
 $w$
), no slip and impermeability conditions are prescribed. The wall is assumed to be adiabatic:
 $(\unicode[STIX]{x2202}T/\unicode[STIX]{x2202}n)_{w}=0$
, with
 $n$
being the local wall-normal direction which at the roughness deviates from the global wall-normal direction
 $y$
. For a radiation-adiabatic wall the wall-normal temperature gradient is not zero but defined by the Stefan–Boltzmann equation with emissivity
 $\unicode[STIX]{x1D716}$
. At the outflow boundary the second-streamwise-derivative terms are neglected in the governing equations. For the unsteady DNS, the boundary condition with fixed quantities is applied at the inflow as well. At the free stream and outflow boundary an additional sponge region with a source term as applied by Kurz & Kloker (Reference Kurz and Kloker2014) is used to dampen the fluctuations,
 $\unicode[STIX]{x1D6F7}^{\prime }$
and, hence, inhibiting reflections. Velocity as well as temperature disturbances are assumed to vanish at the wall. In the unsteady cases disturbances are excited via blowing and suction through a hole at the wall, mimicking a multifrequent point source, by prescribing the wall-normal mass flux (index
 $f$
for forcing)
 $$\begin{eqnarray}\displaystyle (\unicode[STIX]{x1D70C}v)_{f}^{\prime }=[-3(1-R)^{4}+4(1-R)^{3}]\cdot \mathop{\sum }_{h}(\unicode[STIX]{x1D70C}v)_{max,h}^{\prime }\cos (h\unicode[STIX]{x1D714}_{r,0}t+\unicode[STIX]{x1D703}_{h}), & & \displaystyle\end{eqnarray}$$
where
 $0\leqslant R\leqslant 1$
is the normalized radius. The hole is located at
 $(x_{f},z_{f})=(3.394,0)$
upstream of the roughness, with diameter
 $2R=24\unicode[STIX]{x0394}x$
.
 $h$
denotes the timewise harmonics of the fundamental frequency
 $\unicode[STIX]{x1D714}_{r,0}$
with respective phase shift
 $\unicode[STIX]{x1D703}_{h}$
, being zero for all investigated cases. Hence, for
 $t=j2\unicode[STIX]{x03C0}/\unicode[STIX]{x1D714}_{r,0}$
and
 $j\in \mathbb{N}$
the modes constructively interfere and the signal in figure 2(a) results. Note that at the start of a DNS the disturbance excitation is continuously ramped up within the first two periods of the fundamental frequency. The spanwise spectral content at
 $x=x_{f}$
is shown in figure 2(b). The forcing also excites a two-dimensional disturbance wave with an amplitude of 5 %.
(a) Normalized disturbance signal
 $(\unicode[STIX]{x1D70C}v)_{f}^{\prime }(t)$
at
 $(x_{f},z_{f})=(3.394,0)$
for the first fifty harmonics
 $(1\leqslant h\leqslant 50)$
of the fundamental frequency
 $\unicode[STIX]{x1D714}_{r,0}=0.5$
, each forced with amplitude
 $(\unicode[STIX]{x1D70C}v)_{max,h}^{\prime }=10^{-7}$
and
 $\unicode[STIX]{x1D703}_{h}=0$
. (b) Normalized spanwise spectral content of the disturbance signal at
 $x=x_{f}$
. The bars represent the amplitude (left-hand axis) for the corresponding multiple of the fundamental spanwise wavenumber
 $\unicode[STIX]{x1D6FE}_{r,0}=1.963495$
. The solid line shows the integral of the amplitudes over the harmonics (right-hand axis).

For the biglobal stability analysis consecutive streamwise cross-planes are extracted from the steady base-flow downstream of the roughness elements. The flow data are then interpolated onto another structured grid that is adapted according to the expected perturbation modes. For the computation of the wall-normal derivatives a spectral Chebyshev collocation method is applied. Dependent on the streamwise location the grid points are clustered in regions of high spanwise and wall-normal shear, applying a grid transformation similar to Koch et al. (Reference Koch, Bertolotti, Stolte and Hein2000). In the periodic spanwise direction FDs of up to eighth order are used. At the wall
 $y=y_{1}$
zero velocity and temperature perturbations are prescribed. In the free stream all perturbations are assumed to decay exponentially, see also Groskopf et al. (Reference Groskopf, Kloker, Stephani, Marxen and Iaccarino2010b
).
The linear EVP is solved applying the Arnoldi algorithm implemented in the ARPACK library (see Lehoucq, Sorensen & Yang Reference Lehoucq, Sorensen and Yang1998). The Shift-and-Invert mode is applied. The solution according to the spatial approach is obtained by Gaster’s relation. Since the B-LST is localized with respect to the streamwise direction every
 $(y{-}z)$
-cross-plane is analysed independently. The algorithm for eigenvalue tracking in successive cross-planes in the streamwise direction is based on a best-match approach applying a cross-correlation for the eigenvectors at two consecutive tracking steps.
2.3 Verification
To verify the DNS solver the Mach-4.8 flow with a two-dimensional surface roughness of height
 $k=0.1$
and length
 $l_{r}=0.4$
used by Marxen et al. (Reference Marxen, Iaccarino and Shaqfeh2010) has been chosen. Figure 3(a) shows the comparison of the unsteady flow results for identical roughness set-up and disturbance forcing of frequency
 $\unicode[STIX]{x1D714}=10$
, corresponding to
 $F=1.0\times 10^{-4}$
of Marxen et al. (Reference Marxen, Iaccarino and Shaqfeh2010), imposing an adiabatic boundary condition for disturbances as well as base flow; the agreement is excellent for a similar grid resolution. Half the grid step size in the streamwise direction shows slight differences. Further streamwise and wall-normal refinements yield identical results.
(a) Evolution of two-dimensional streamwise-velocity disturbance (frequency
 $\unicode[STIX]{x1D714}=10$
) with adiabatic boundary condition along
 $x$
-direction in comparison to results from Marxen et al. (Reference Marxen, Iaccarino and Shaqfeh2010) (symbols) for coarse two-dimensional (2-D) verification grid (——) similar to the one used in Marxen et al. (Reference Marxen, Iaccarino and Shaqfeh2010) and 2-D-verification fine grid (— ⋅ —), see table 1. (b) Evolution of streamwise-velocity disturbance along
 $x$
-direction comparing 3-D-medium-grid (lines) and 3-D-fine-grid (symbols) solutions, see table 1. Roughness configuration according to case C-3DO-M, see table 3. Frequencies
 $\unicode[STIX]{x1D714}=0.5$
(▫),
 $\unicode[STIX]{x1D714}=2.5$
(▵),
 $\unicode[STIX]{x1D714}=10$
(♢). Vertical line marks roughness location.

Grid studies have also been performed for the three-dimensional roughness set-ups. The streamwise grid step size is fixed to the above applied fine-grid resolution, and the number of grid points in wall normal as well as spanwise direction has been doubled, see 3-D cases in table 1, and figure 3(b); the medium grid solution is sufficiently accurate.
The B-LST solver has been verified based on a comparison to Mach-4.8 flat-plate flow stability results from a monoglobal (M-)LST solver. The stability results show very good agreement for several investigated spanwise wavenumbers
 $\unicode[STIX]{x1D6FE}_{r}$
(not shown). Whereas this wavenumber is a direct input parameter for the M-LST equations, in B-LST it is given indirectly via the spanwise width of the computational grid
 $\unicode[STIX]{x1D706}_{z}=2\unicode[STIX]{x03C0}/\unicode[STIX]{x1D6FE}_{r,0}$
. B-LST also provides simultaneously solutions for higher spanwise harmonics as well as for
 $\unicode[STIX]{x1D6FE}_{r}=0$
. The analysis of Schmidt & Rist (Reference Schmidt and Rist2011) for compressible streamwise corner flow is based on the same solver applying different boundary conditions.
2.4 Flow parameters and roughness set-up
This work focuses on the analysis of flat-plate flow with three-dimensional roughness elements under wind-tunnel conditions (cold cases) and atmospheric-flight conditions (hot cases). The parameters are given in table 2. The cold-flow parameters are identical to the work of Marxen et al. (Reference Marxen, Iaccarino and Shaqfeh2010).
Flow parameters.
 $\tilde{T}_{w}$
holds at roughness location
 $x=x_{r}$
, with two values for the hot flow according to emissivity
 $\unicode[STIX]{x1D716}$
.

For the shape of the roughness elements the definition of Marxen et al. (Reference Marxen, Iaccarino and Shaqfeh2010) has been extended to the spanwise direction:
 $$\begin{eqnarray}\displaystyle y_{1}(x,z)=\frac{k^{\ast }}{4}\mathop{\sum }_{j=-1}^{+1}j\tanh \left[s_{r}\left(x-x_{r}-\frac{z}{\tan (\unicode[STIX]{x1D713}_{r})}+j\frac{l_{r}}{2}\right)\right]\cdot \mathop{\sum }_{j=-1}^{+1}j\tanh \left[s_{r}\left(z+j\frac{b_{r}}{2}\right)\right] & & \displaystyle\end{eqnarray}$$
where
 $k^{\ast }$
is the model roughness height which, for small
 $l_{r}$
or
 $b_{r}$
, might differ from the nominal height
 $k$
in order to compensate for the influence of the
 $\tanh$
term and, thus ensuring
 $\max (y_{1})=k$
;
 $l_{r}$
and
 $b_{r}$
describe the distance between the two inflection points of the contour in streamwise and spanwise direction, respectively;
 $s_{r}$
defines the edge’s slope. The centre of the roughness is located at
 $(x,z)=(x_{r},0)$
. Its skewing with respect to the oncoming flow, and thus to the
 $x$
-axis, is given by the angle
 $\unicode[STIX]{x1D713}_{r}$
. For all investigated cases the parameters are specified in table 3, where the first set of characters in front of the first hyphen refers to the flow conditions, the second set defines the type of roughness and the character following the second hyphen represents the roughness height in terms of
 $Re_{kk}$
.
Sketch of roughness set-up: (a) top view with element dimensions and rotation angle. (b) Outline of roughness element looking downstream.

Parameters for roughness model and thermal boundary condition at the wall. Comparison of cold- and hot-flow configurations.

The smooth-plate as well as the two-dimensional roughness flow serve as reference cases. The spanwise spacing of the elements is four times their spanwise width
 $b_{r}$
. Identical values of
 $b_{r}$
have been chosen for cases 3DS and 3DO to ensure identical obstruction areas with respect to the oncoming flow. Three different roughness heights characterized by
 $Re_{kk}$
, small (S), medium (M) and large (L), are investigated on the basis of the oblique roughness set-up 3DO, see also figure 4.
For the cold-flow conditions the roughness elements are located at
 $Re_{\unicode[STIX]{x1D6FF}_{T}}=20\,000$
based on the undisturbed flat-plate flow and the temperature boundary-layer thickness
 $\unicode[STIX]{x1D6FF}_{T_{u}}$
, resulting in
 $R_{x_{r}}=1225$
,
 $x_{r}=15$
. For the hot-flow scenarios,
 $x_{r}$
,
 $b_{r}$
, and
 $l_{r}$
are kept, whereas
 $k$
has been adapted to generate identical
 $Re_{kk}$
values. The ratios
 $k/\unicode[STIX]{x1D6FF}_{T_{u}}$
as well as
 $k/\unicode[STIX]{x1D6FF}_{u}$
at
 $x=x_{r}$
are shown in table 4. Additionally, the parameters for the transition criteria proposed by Redford et al. (Reference Redford, Sandham and Roberts2010), Bernardini et al. (Reference Bernardini, Pirozzoli and Orlandi2012) and Bernardini et al. (Reference Bernardini, Pirozzoli, Orlandi and Lele2014) are given. Cases C-3DS-M and C-3DO-M exhibit identical parameters. Table 4 reveals that the classification of the roughness set-ups depends on the underlying criterion. Redford et al. (Reference Redford, Sandham and Roberts2010), evaluating
 $Ma_{kk}/T_{w}$
over
 $Re_{kk}$
(see their figure 19), proclaim a stabilizing effect of the wall cooling given by larger values of
 $Ma_{kk}/T_{w}$
at identical
 $Re_{kk}$
. The criteria of Bernardini et al. (Reference Bernardini, Pirozzoli and Orlandi2012) and Bernardini et al. (Reference Bernardini, Pirozzoli, Orlandi and Lele2014) show the inverse effect with larger values of
 $Re_{kk}^{\ast }$
and
 $Re_{Q}$
, respectively, for the hot-flow cases. Note that
 $Re_{kk}$
already accounts for the thermal conditions at the wall. Replacing
 $\unicode[STIX]{x1D70C}_{k}$
and
 $\unicode[STIX]{x1D707}_{k}$
with
 $\unicode[STIX]{x1D70C}_{w}$
and
 $\unicode[STIX]{x1D707}_{w}$
, respectively, scales the wall-temperature influence even stronger. The performance of the different criteria will be discussed below.
Parameters for the evaluation of three-dimensional roughness configurations as well as the transition critera of Redford et al. (Reference Redford, Sandham and Roberts2010), Bernardini et al. (Reference Bernardini, Pirozzoli and Orlandi2012) and Bernardini et al. (Reference Bernardini, Pirozzoli, Orlandi and Lele2014). Letters
 $n$
(non-promotive) and
 $p$
(promotive) behind the numbers mark the classification of the case according to the corresponding transition criterion.

3 Laminar base flows
Top view on vortex structures by means of the
 $\unicode[STIX]{x1D706}_{2}$
-criterion (
 $\unicode[STIX]{x1D706}_{2}=-0.07$
). HV, MV and IV denote the horseshoe, main and inner vortices, at leading (L) and trailing (T) edge of the oblique roughness. Shading indicates streamwise vorticity
 $\unicode[STIX]{x1D714}_{x,b}$
; clockwise (grey) and counter-clockwise (black) rotation as seen in downstream direction. Reversed flow is shown by patterned isosurfaces of
 $u_{b}<0$
. White bars show position and extent of the roughness. Cases: (a) C-3DS-M, (b) C-3DO-M, (c) C-3DO-L, (d) H-3DO-M and (e) H-3DO-L.

In all cases the time-accurate flow simulation along the flat plate with roughness converges to a steady state. Convective exponential growth of numerical background noise can be seen downstream the roughness elements in a temporal Fourier analysis. For cases S and M the streamwise-velocity amplitudes of the analysed frequencies do not exceed a value of
 $10^{-6}$
at the end of the investigated streamwise domain, and therefore are neglected. The cases L exhibit stronger exponential growth reaching Fourier amplitudes of
 $10^{-6}$
already at
 $x\approx 40$
. Note that, contrary to the behaviour in subsonic flow, even the simulations for
 $Re_{kk}=990$
with aspect ratios
 $b_{r}/k$
of 6.4 and 11, respectively, do not show any sign of global instability due to a region of absolute instability in the wake of the roughness element. For
 $Ma_{\infty }<1$
, Kurz & Kloker (Reference Kurz and Kloker2016) detect global instability for roughness configurations with
 $Re_{kk}\gtrsim 600$
and
 $d/k\approx 4$
using basically the same code. The continuing absence of global instability beyond
 $Re_{kk}=600$
despite the larger
 $b_{r}/k$
-values in the supersonic-flow regime is also confirmed by a Mach-2.5 simulation of DeTullio et al. (Reference DeTullio, Paredes, Sandham and Theofilis2013) with
 $Re_{kk}=788$
.
3.1 Effect of element skewing angle for roughness height
 $k=0.1$

Figure 5(a,b) show the vortex structures induced by the symmetric and oblique roughness, respectively. The visible differences in the vortex structure affect the streak formation as well as the strength of the shear in the wake. Whereas the symmetric set-up of case C-3DS-M excites three pairs of equally strong counter-rotating vortices, case C-3DO-M shows differences with respect to the origin of the vortices. The naming convention for the vortex pairs follows Groskopf et al. (Reference Groskopf, Kloker, Stephani, Marxen and Iaccarino2010b
): the outer pair is formed by the legs of the horseshoe vortex (HV) of the roughness. The most persistent vortex pair is named the main vortices (MV). They originate from the flow around the lateral edges of the roughness at
 $z=\pm 0.4$
. An inner pair of vortices (IV) forms directly behind the roughness, along the edge of the separation region. Their formation is driven by the upward deflection of the near-wall flow coming around the lateral edges of the roughness element. Remarkably, the inner and the main vortices are co-rotating on each side. For case C-3DO-M the vortices of a pair are furthermore distinguished according to their origin. The vortices induced at the leading edge of the roughness at
 $(x,z)=(14.6,-0.4)$
are significantly stronger than the trailing-edge vortices. The leading-edge main vortex (LMV) becomes the dominant flow structure in the wake. Whereas the pair of IV vanishes shortly behind the symmetric element, in the oblique set-up the leading-edge inner vortex (LIV), amplified by the stronger cross-flow behind the roughness, is part of the formative vortex structure in the wake of the element. The cross-flow is positive near the wall and negative further away, with the dominant vortices LMV and LIV following the near-wall flow deflection as for their rotation sense.
Streamwise base-flow-velocity contours. Thin solid lines are isolines of
 $u_{b}$
, starting with
 $u_{b}=0.1$
near the wall (
 $\unicode[STIX]{x1D6E5}=0.1$
), ending with
 $u_{b}=0.95$
. Thick solid lines with shading indicate vortices and rotation sense shown in figure 5. Shading indicates the streamwise vorticity with identical contour levels for all cases. Dash-dot lines represent the sonic line. Case C-3DS-M at (a)
 $x=18$
and (b)
 $x=34$
. Case C-3DO-M at (c)
 $x=18$
and (d)
 $x=34$
. Case H-3DO-M at (e)
 $x=18$
and (f)
 $x=34$
.

The streamwise-velocity isolines in figure 6 show that the imbalance between the main vortices in case C-3DO-M initiates a cross-flow-vortex-like overturning which is inhibited by the interference of the nearby co-rotating LIV, see 6(c,d). In contrast to case C-3DS-M the regions of reversed flow are shifted in spanwise direction for the oblique set-up. The upstream separation is located near the leading edge, whereas the downstream separation is shifted toward the trailing edge, see figure 5(b) again.
The strength of the generated velocity streaks is evaluated by their amplitude
 $\hat{u} _{st}$
:
 $$\begin{eqnarray}\displaystyle \hat{u} _{st}={\textstyle \frac{1}{2}}\left(\max _{yz}[u(x,y,z)-\langle u\rangle (x,y)]-\min _{yz}[u(x,y,z)-\langle u\rangle (x,y)]\right), & & \displaystyle\end{eqnarray}$$
with
 $\langle u\rangle$
being the spanwise mean value, needed because of the asymmetric wake flow.
In figure 7(a) the streak amplitude is compared along with
 $\unicode[STIX]{x1D714}_{x,b}$
and gradients of
 $u_{b}$
. In general, it can be observed that, whereas the vorticity decays, the streak amplitude persists along with the wall-normal and spanwise gradients. The streak amplitude as well as the maxima of vorticity and wall-normal-velocity gradient of case C-3DO-M are larger than for case C-3DS-M, the spanwise gradients compare. The transient growth behaviour for the spanwise gradient of the streamwise velocity found by DeTullio & Sandham (Reference DeTullio and Sandham2015) is not observed. Note that the streak amplitude of case C-3DS-M or C-3DO-M reaches a maximum of 31 % or 44 %, respectively, in the near wake. Thus, the maximum streak amplitude is approximately 40 % larger for the oblique set-up. Investigating incompressible flat-plate flows with streamwise streaks Andersson et al. (Reference Andersson, Brandt, Bottaro and Henningson2001) found sinuous and varicose modes becoming unstable at streak amplitudes of about 26 % and 37 %, respectively. According to these thresholds, case C-3DS-M would support only the sinuous modes whereas case C-3DO-M would support both.
Streak amplitude (○, red) and maxima in
 $(y{-}z)$
-planes of the absolute values of the wall-normal and spanwise gradients of the streamwise velocity,
 $\unicode[STIX]{x2202}u_{b}/\unicode[STIX]{x2202}y$
(▵) and
 $\unicode[STIX]{x2202}u_{b}/\unicode[STIX]{x2202}z$
(▹), respectively, as well as the streamwise vorticity
 $\unicode[STIX]{x1D714}_{x,b}$
(▫) along the streamwise coordinate
 $x$
for (a) cases C-3DO-M (——) and C-3DS-M (— —) and (b) cases C-3DO-M (——) and C-3DO-L (— —). (c) Maxima in
 $(y{-}z)$
-planes of the absolute values of spanwise velocity
 $w_{b}$
(♢) and spanwise mean value of
 $w_{b}$
(○) along
 $x$
for case C-3DO-M with spanwise roughness spacing of
 $\unicode[STIX]{x1D706}_{z}=3.2$
(——) and
 $\unicode[STIX]{x1D706}_{z}=6.4$
(— —).

Base-flow temperature and pressure distribution at the wall. Shading indicates temperature, contour lines show pressure distribution at the wall. Label 1 refers to
 $p_{b}=0.023$
, step size between labels is
 $\unicode[STIX]{x1D6E5}=0.001$
. (a) Case C-3DS-M. (b) Case C-3DO-M. (c) Case H-3DO-M, note the different temperature scale.

Figure 8 shows the temperature and pressure footprints. Whereas for case C-3DS-M two high-temperature streaks develop, case C-3DO-M shows one dominant (leading-edge) high-speed streak, being broader and stronger. In both cases the roughness itself is heated at the front side of its top. Pressure contour lines show strong expansion of the fluid in streamwise direction as it flows over the roughness as well as around the lateral edges of the element, most pronounced for the leading edge of the oblique set-up.
A doubling of the spanwise roughness spacing
 $\unicode[STIX]{x1D706}_{z}$
shows a persistent 50 % reduction of the mean cross-flow induced in the roughness wake, see figure 7(c), at constant maximum value. It may be thus concluded that the spacing applied is wide enough to represent isolated elements. However we will show below that this is not exactly fulfilled for the instability induced.
3.2 Comparison of base flows for various
$k$

Case C-3DO-S causes only a weak modulation of the streamwise-velocity profiles, see figure 9. The general wake structure of case C-3DO-L is similar to that of case C-3DO-M, compare figure 5(b,c), with the former causing stronger deformations (see figures 7
b and 9
c,f) and multiple horseshoe vortices bending around the trailing edge. However, the streak amplitude and gradients of case C-3DO-L decay faster, the former dropping below case C-3DO-M at about
 $x=47$
. This implies that case C-3DO-M generates less strong but more stable streaks.
(a–c) Streamwise base-flow-velocity contours at
 $x=18$
. Thin solid lines are isolines of
 $u_{b}$
, starting with
 $u_{b}=0.1$
near the wall (
 $\unicode[STIX]{x1D6E5}=0.1$
), ending with
 $u_{b}=0.95$
. Thick solid lines with shading indicate vortices and rotation sense shown in figure 5. Dashed lines show regions of reverse flow
 $u_{b}<0$
. (a) Case C-3DO-S. (b) Case C-3DO-M. (c) Case C-3DO-L. (d–f) Base-flow temperature distribution in cross-plane at
 $x=34$
. Shading shows the temperature
 $T_{b}$
based on the same scaling. Solid lines are isolines of
 $u_{b}$
as shown in (a–c). (d) Case C-3DO-S. (e) Case C-3DO-M. (f) Case C-3DO-L. Dash-dot lines represent the sonic line.

3.3 Atmospheric-flight conditions
(a)
 $\hat{u} _{st}$
(——) and maxima in
 $(y-z)$
-planes of the absolute values of
 $\unicode[STIX]{x2202}u_{b}/\unicode[STIX]{x2202}y$
(— —),
 $\unicode[STIX]{x2202}u_{b}/\unicode[STIX]{x2202}z$
(— ⋅ —) and
 $\unicode[STIX]{x1D714}_{x,b}$
(— ⋅ ⋅ —) along
 $x$
for cases C-3DO-M (♢) and H-3DO-M (▿). (b) as (a) but for cases C-3DO-L (▫) and H-3DO-L (○). (c) maximum (——) and minimum values (— —) of base-flow wall-temperature normalized by the smooth-wall value along
 $x$
. Symbols according to (a,b). The vertical line marks the roughness location
 $x_{r}=15$
.

The comparison of figure 5(b,d) reveals qualitatively similar structures for cases C-3DO-M and H-3DO-M. Note that the use of equal
 $\unicode[STIX]{x1D706}_{2}$
-values is justified because of the kept global Reynolds number and non-dimensional roughness position. (For constant
 $Re_{\infty }$
, both
 $x=\tilde{x}/\tilde{L}$
and
 $y={\tilde{y}}/\tilde{L}$
are the correct measures for
 $Re_{x}$
and
 $\unicode[STIX]{x1D6FF}_{u}=\tilde{\unicode[STIX]{x1D6FF}}_{u}/\tilde{L}$
, respectively, for incompressible flow.) The additional inner vortex labelled LIV2, which is visible in the cold cases too, is more pronounced in case H-3DO-M, however, the remaining vortices are weaker. The recirculation zones in front of and aft the roughness as well as the inclination angle with respect to the
 $(x{-}z)$
-plane are also smaller. In case C-3DO-M the LMV gets closer to the centre plane
 $z=0$
which implies stronger cross-flow. This can also be observed by comparison of the LMV centres in figure 6(c,e). Another difference becomes obvious in this figure: the boundary-layer thickness is lower for the cases with radiation-cooled walls due to the density increase by cooling. Though the basic structure of the vortex systems appears similar, differences in vortex strength and relative positioning in the wake of the roughness lead to different spanwise boundary-layer profiles and temperature footprints downstream, see figures 6 and 8, respectively. The similarity to a cross-flow-like overturning is only given for the cold case where the high-speed streak is more pronounced. The same observations hold for the comparison of cases C-3DO-L and H-3DO-L, see figure 5(c,e). Note that for case H-3DO-L the LIV extends much further downstream.
In figure 10(a) streak amplitudes are compared along with vorticity
 $\unicode[STIX]{x1D714}_{x,b}$
and gradients of
 $u_{b}$
. Whereas the streak amplitude as well as the maximum of vorticity is smaller for case H-3DO-M, the wall-normal and spanwise gradient of
 $u_{b}$
are larger.
Cases C-3DO-L and H-3DO-L exhibit similar streak amplitudes with identical maximum value at identical streamwise location, see figure 10(b). In figure 10(c) the spanwise maxima and minima of the wall temperature are plotted along the streamwise direction. At
 $x=20$
, the maximum increase with respect to the smooth-wall case is approximately 26 % for the hot flow, meaning a temperature increase of
 $167K$
from
 $644K$
to
 $811K$
. This is a consequence of the radiation-adiabatic wall condition and demonstrates a significant heat-load increase by the roughness element at sustained hypersonic flight conditions even without turbulence, cf. Fezer & Kloker (Reference Fezer and Kloker2003).
3.4 Additional stability relevant flow properties
In flat-plate flow the second-mode instability arises from the occurrence of a near-wall region in the base flow where the disturbance phase velocity is locally supersonic
 $(c_{ph}>u+a)$
, see, e.g. Mack (Reference Mack1975). In figure 11 the region of supersonic phase velocity lies between the dashed line and the wall. The lines of
 $Ma=1$
 $(u=a)$
and
 $c_{ph}=u+a$
almost collapse for the adiabatic case. In the wake of the roughness the flow has multiple generalized inflection points (GIPs) where strong spanwise gradients of
 $u_{b}$
are visible.
Lines of generalized inflection points in wall-normal direction within the boundary layer (— ⋅ ⋅ —), of sonic speed
 $(Ma=1)$
(— ⋅ —) and of
 $u+a=c_{ph}$
(— —) at
 $x=24$
for (a) case C-3DO-M,
 $c_{ph}=0.88$
(from § 4.1: tilt-even mode at
 $\unicode[STIX]{x1D714}_{r}=10$
) and (b) case H-3DO-M,
 $c_{ph}=0.9$
. Thin solid lines are
 $u_{b}$
-isolines, starting with
 $u_{b}=0.1$
near the wall (
 $\unicode[STIX]{x1D6E5}=0.1$
), ending with
 $u_{b}=0.95$
.
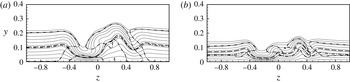
The hot-flow case H-3DO-M shows the existence of two GIP lines along the entire spanwise extent. This is in accordance with the influence of wall cooling at the flat plate, see, e.g. Mack (Reference Mack1975). At the high-speed streak, case H-3DO-M does not show an inflection point. The line of
 $c_{ph}=u+a$
, with
 $c_{ph}\approx 0.9$
being a typical value for a second mode, is located significantly above the sonic line, compare case C-3DO-M.
Comparing cases H-3DO-M and H2-3DO-M slight differences can be found (not shown). The region of supersonic phase velocity above the wall is slightly larger for the stronger wall cooling. According to the smooth-plate linear stability theory this would mean that second-mode instabilities are more amplified in case H-3DO-M.
4 Biglobal linear stability analysis
4.1 Identified unstable eigenmodes for
$k=0.1$

Modulus of the B-LST perturbation amplitude (shading) at
 $x=24$
normalized by the maximum of the streamwise-velocity modulus. Case C-3DS-M: (a) streamwise velocity
 $|\hat{u} |$
, and (b) pressure
 $|\hat{p}|$
for even mode at frequency
 $\unicode[STIX]{x1D714}_{r}=3$
. Case C-3DO-M: (c,e)
 $|\hat{u} |$
and (d,f)
 $|\hat{p}|$
for tilt-even mode at
 $\unicode[STIX]{x1D714}_{r}=5$
and 10, respectively. Solid lines are
 $u_{b}$
-isolines. Dash-dot lines represent the sonic line. Symbols
 $\oplus$
and
 $\ominus$
describe an approximately opposite phase relation for the modulus maxima located beneath.

For cases C-3DS-M and C-3DO-M a detailed biglobal linear stability analysis has been carried out in a cross-plane at
 $x=24$
. The results reveal a multitude of unstable eigenmodes. For the two most unstable eigenmodes of each case, sections of the stability diagram have been computed by tracking the corresponding eigenvalues in the complex plane in terms of varying streamwise location
 $x$
and frequency
 $\unicode[STIX]{x1D714}_{r}$
. The investigated parameter space spans the intervals
 $16.5\leqslant x\leqslant 40$
and
 $0.5\leqslant \unicode[STIX]{x1D714}_{r}\leqslant 13$
, respectively. The base flow changes dramatically with
 $x$
in the near wake of the roughness. Therefore, the B-LST assumption of parallel flow may not be applicable, or its results may be doubtful. Comparing the maximum absolute values of the spatial gradients of case C-3DO-M in
 $(y{-}z)$
-cross-planes along
 $x$
reveals that within the examined streamwise range the streamwise gradient is at least one order of magnitude lower than the wall-normal or spanwise gradient. Thus, starting at
 $x=24$
the investigated eigenmodes are tracked also as far upstream as possible, until the correlation of the eigenmodes at consecutive streamwise locations becomes ambiguous.
Representative eigenfunction-amplitude distributions of the most unstable roughness-wake eigenmodes of cases C-3DS-M and C-3DO-M are shown in figure 12. In accordance with the phase relation of the dominant amplitude maxima, in case C-3DS-M the most unstable mode is an even mode (figure 12
a,b). The second most unstable mode is an odd mode (not shown) with a phase shift of about
 $\unicode[STIX]{x03C0}$
between both half-planes
 $z\gtrless 0$
. For case C-3DO-M the most unstable eigenmodes exhibit a similarity to the even and odd modes of case C-3DS-M, although the amplitude distributions are tilted. However, the corresponding phase relations of the eigenfunctions’ maxima reveal their even and odd nature. Therefore, the eigenmodes of case C-3DO-M shall be also referred to as tilt-even (figure 12
c,d) and tilt-odd mode. Note the existence of non-negligible pressure amplitudes at the wall for the eigenmodes (figure 12
b,d), and that the local maxima are located above the sonic line, except for
 $\unicode[STIX]{x1D714}_{r}=10$
in case C-3DO-M.
4.2 Local and integral growth for
$k=0.1$

In the following, stability diagrams are discussed that are gained by a procedure different from classical (monoglobal) LST analysis. Instead of picking the most unstable eigenvalue from the spectrum at each combination
 $(\unicode[STIX]{x1D6FC}_{r},x)$
, the tracked biglobal modes are taken, the tracking along
 $\unicode[STIX]{x1D6FC}_{r}$
or/and
 $x$
started at a reference combination
 $(\unicode[STIX]{x1D6FC}_{r,ref},x_{ref})$
, where the modes to be tracked are chosen. Finally, the results are plotted as
 $\unicode[STIX]{x1D714}_{i}=\unicode[STIX]{x1D714}_{i}(\unicode[STIX]{x1D714}_{r},x)$
, with the
 $\unicode[STIX]{x1D714}_{r}$
-values being no more equidistant but approximately proportional to
 $\unicode[STIX]{x1D6FC}_{r}$
. The
 $N$
-factors are calculated spatially, i.e. as
 $N=-\int \unicode[STIX]{x1D6FC}_{i}\,\text{d}x$
, with
 $\unicode[STIX]{x1D6FC}_{i}$
obtained by Gaster’s relation. For the even mode this method yields the diagrams shown in figure 13, with the smooth-plate diagram for monoglobal modes at
 $\unicode[STIX]{x1D6FE}_{r}=5.5$
as reference. The tracked biglobal modes are multispectral with respect to
 $\unicode[STIX]{x1D6FE}_{r}$
and there is no distinguished plane
 $z=\text{const.}$
for these cases. Comparing the growth rates as well as the
 $N$
-factor isolines in figure 13, the stronger instability is clearly for the oblique set-up.
Details from the temporal stability diagrams of (a) case C-3DS-M even mode, (b) case C-3DO-M tilt-even mode and (c) case C-REF for spanwise wavenumber
 $\unicode[STIX]{x1D6FE}_{r}=5.5$
. Shading (contour levels are identical for all cases) shows temporal growth rate
 $\unicode[STIX]{x1D714}_{i}$
. Solid lines represent
 $N$
-factor isolines with levels shown. Integration started at initial amplification downstream of the roughness for (a,b) and near the plate’s leading edge for (c).

Case C-3DS-M exhibits a similarity to case C-REF in terms of the occurrence of distinct low- and high-frequency maxima. For case C-3DO-M the distinction between low- and high-frequency instability mode is less pronounced. For cases C-3DO-M and C-3DS-M the streamwise range of high-frequency instability is much larger than for case C-REF. On the smooth plate the low- and high-frequency unstable regions are related to the first- and second-mode instabilities, respectively. For increasing Mach number these regions first approach each other and finally, near
 $Ma=4.8$
, merge to one single instability region under adiabatic-wall conditions, compare, e.g. Mack (Reference Mack, Fasel and Saric2000) and Eissler & Bestek (Reference Eissler and Bestek1996). This merging can be observed in case C-3DS-M. In the vicinity of the roughness the frequency range of the second-mode-associated instability region is shifted to lower values. Marxen et al. (Reference Marxen, Iaccarino and Shaqfeh2010) observed a similar behaviour near a two-dimensional roughness. However, for the latter the shift vanishes downstream the element, the stability properties of the smooth-plate flow are recovered. In the wake of a three-dimensional roughness the flow deformation persists much longer, and the smooth-plate properties are not recovered within the considered domain.
Compare the tilt-even-mode eigenfunctions of case C-3DO-M in the low- and high-frequency region in figure 12(c–f), respectively. In contrast to the former the latter shows an additional near-wall maximum for streamwise velocity as well as pressure below the sonic line which is virtually identical with this mode’s line of
 $u+a=c_{ph}$
, see figure 11(a)
 $0.2\leqslant z\leqslant 0.4$
. With the contraction of the region of supersonic phase velocity at the high-speed streaks the line of supersonic phase velocity encloses the near-wall amplitude maxima of the eigenmode. Furthermore, there is a phase shift between the pressure’s wall maximum and the shear-layer maximum very much like the wall-normal characteristics of the second mode on the smooth plate. Based on these properties the B-LST low- and high-frequency eigenmodes of the roughness wake may henceforth also be referred to as roughness-wake first- and second-mode instabilities, respectively. Note that high-frequency eigenmodes with the same properties have been found for case C-3DS-M with the even mode resembling the varicose mode VC of DeTullio & Sandham (Reference DeTullio and Sandham2015) in a Mach-6 boundary layer which they also associated with the smooth-plate second- or Mack-mode instability. As observed by these authors the largest amplification of this mode is shifted to lower frequencies compared to the smooth-plate second mode.
In general it is found that for cases C-3DS-M and C-3DO-M the even and tilt-even modes are more amplified than the odd and tilt-odd modes, respectively. However, at the end of the investigated streamwise domain, the growth rates approach those of the odd modes being more persistent. This corresponds to the stronger decay of the wall-normal gradient compared to the spanwise gradient of
 $u_{b}$
shown in figure 7(a) with the even and odd modes being associated with the former and latter, respectively. However, within the investigated streamwise range of the present work the tilt-even mode of case C-3DO-M gains the largest
 $N$
-factors. The second mode reaches
 $N=6.8$
for
 $\unicode[STIX]{x1D714}_{r}=10$
compared to
 $N=6.4$
for the first mode at
 $\unicode[STIX]{x1D714}_{r}=5$
.
 $N\approx 5$
has been found sufficient for transition to turbulence in wind-tunnel experiments under noisy conditions. The tilt-even mode gains
 $N=5$
at approximately
 $x=33$
, corresponding to
 $180k$
or
 $98\unicode[STIX]{x1D6FF}_{u}$
downstream of the roughness centre.
The comparison of original and doubled roughness spacing shows similar amplitude distributions. However, the spatial growth rates at
 $x=24$
are generally larger for the smaller spacing, with a 10 % increase for the dominant tilt-even mode. Therefore the present set-up with
 $\unicode[STIX]{x1D706}_{z}=4b_{r}$
is slightly more unstable than the flow with an isolated element, also due to stronger induced cross-flow, see again figure 7(c).
4.3 Comparison of stability properties for various
$k$
at
$\unicode[STIX]{x1D713}_{r}=45^{\circ }$


Spatial growth rates
 $\unicode[STIX]{x1D6FC}_{i}$
from B-LST as a function of frequency
 $\unicode[STIX]{x1D714}_{r}$
at streamwise position
 $x=24$
. Case C-3DO-S most amplified low-frequency mode (— ⋅ —), case C-3DO-M tilt-even mode (— —), and case C-3DO-L tilt-even mode (——). Case C-REF three-dimensional disturbance with spanwise wavenumber
 $\unicode[STIX]{x1D6FE}_{r}=5.9$
(— ⋅ ⋅ —).

The growth rates of the most amplified modes at
 $x=24$
, approximately 50 boundary-layer thicknesses downstream of the element, differ significantly in the cases shown, see figure 14. For case C-3DO-S the characteristic of
 $\unicode[STIX]{x1D6FC}_{i}=\unicode[STIX]{x1D6FC}_{i}(\unicode[STIX]{x1D714}_{r})$
is similar to that of the corresponding smooth-plate eigenmode which is shown for comparison; the maximum growth rate for the low-frequency first mode is approximately 30 % larger at the streamwise location shown. On the other hand it is only 30 % of the maximum growth rate of case C-3DO-M. Case C-3DO-L shows as expected the strongest growth, being 50 % larger in maximum than for case C-3DO-M. Contrary to cases C-3DO-S and C-3DO-M, case C-3DO-L does not exhibit a second local maximum related to the high-frequency second mode. Figure 14(a) reflects the behaviour already described above: with increasing roughness height the local amplification maxima for low- and high-frequency modes shift to higher, and lower frequencies, respectively, approach, and finally merge fully. This fusion of first and second mode can also be seen for case C-3DO-M somewhat further downstream, see the stability diagram in figure 13(b). Note that for case C-3DO-L the eigenfunctions corresponding to frequencies beyond the single amplification maximum exhibit the typical additional near-wall pressure maximum below the sonic line. Thus, the continuous transition from roughness-wake first to second mode takes place in the region of the amplification maximum. The first- and second-mode instability regions have merged inseparably.
The effect of atmospheric-flight conditions on the B-LST results is not shown but will be discussed based on DNS in § 5.5.
5 Direct numerical simulation of disturbance evolution
5.1 Response to point-source pulsing for
$k=0.1$

To gain a general overview of the stability and (internal) ‘receptivity’ behaviour of the investigated flows the steady base flows are exposed to an unsteady disturbance pulsing, see § 2.2 and figure 2 in particular. The diameter of the disturbance-source hole is
 $2R=0.429$
. For comparison, the wavelength of the smooth-plate two-dimensional eigenmode
 $(\unicode[STIX]{x1D6FE}_{r}=0)$
is
 $\unicode[STIX]{x1D706}_{x}\approx 1.03$
and 0.54 for frequencies
 $\unicode[STIX]{x1D714}_{r}=5$
and 10, respectively.
Response of the base flow to point-source pulsing. The pulse consists of the first 50 harmonics of fundamental frequency
 $\unicode[STIX]{x1D714}_{r,0}=0.5$
. Shading: (a–d) amplitude of streamwise-velocity disturbance
 $u^{\prime }$
gained from temporal Fourier analysis, the neutral line (— —) connects the streamwise locations of first amplification; (e,f) the natural logarithm of
 $u^{\prime }$
normalized by its value at
 $x=13$
. Cases: (a) C-REF, (b) C-2D-M, (c,e) C-3DS-M, and (d,f) C-3DO-M. The solid vertical lines mark the roughness location
 $x_{r}=15$
.

The responses in terms of disturbance amplitudes from temporal Fourier analysis for the flows of cases C-2D-M, C-3DS-M, C-3DO-M as well as C-REF are shown in figure 15(a–d). Note that this is not a ‘standard’
 $N$
-factor stability diagram since at each frequency the receptivity of the multitude of excited modes varies and possible decay of the disturbances along the streamwise direction is also included. Figure 15(a) shows the neutral line for the sum of superposed eigenmodes in the smooth-plate flow.
 $N$
-factors for the sum of modes can be calculated by relating the downstream amplitudes to the values at the neutral point. Figure 15(a–d) thus show the amplitude spectra that would be observed in a respective experimental set-up. The amplitudes can be scaled to the level of the forcing in the experiment within the regime of modal growth. Note that larger forcing amplitudes will lead to a decrease in the streamwise extent of the purely linear flow behaviour. The representation of the results in figure 15(e,f) eliminates the influence of receptivity and transient processes in the flat-plate flow upstream the roughness by normalizing the amplitudes of each excited frequency by its respective value at
 $x=13$
. The shown natural logarithm represents the
 $N$
-factor for the sum of modes displaying the influence of the roughness and its wake only.
Figure 15(a–d) show that regardless of the roughness shape the behaviour resembles the smooth-plate behaviour up to a short distance upstream of the roughness
 $(x\approx 13)$
. Right downstream of the excitation location the disturbance-amplitudes drop throughout the frequency range before they start to grow again. The drop is more pronounced for higher frequencies. For some frequencies, in the second-mode range in particular, the excitation occurs upstream of branch I of the smooth-plate stability diagram. Downstream of
 $x\approx 13$
the response varies with the roughness shape.
The behaviour of case C-2D-M is in accordance with Marxen et al. (Reference Marxen, Iaccarino and Shaqfeh2010), see their figure 17. They found that the two-dimensional roughness acts ‘as a disturbance amplifier with a limited bandwidth’. The stability properties in its far wake resume the smooth-plate behaviour. Therefore, the amplification in front of and damping along the roughness results in an offset with respect to the smooth-plate evolution. Within the low-frequency region
 $(\unicode[STIX]{x1D714}_{r}\lesssim 8)$
the net effect for the disturbances is negligible. For higher frequencies
 $(8\lesssim \unicode[STIX]{x1D714}_{r}\lesssim 13)$
it results in an amplitude gain, compare the amplitude levels in figure 15(a,b) right behind the roughness. For frequencies beyond that range
 $(\unicode[STIX]{x1D714}_{r}\gtrsim 13)$
the net effect is negative. They are only weakly amplified upstream of the roughness, and comparably damped strongly along the element.
The spectrum of case C-3DS-M in figure 15(c) shows strong growth for two frequency intervals related to the roughness-wake first and second mode. The largest disturbance amplitudes are gained within the low-frequency range for
 $\unicode[STIX]{x1D714}_{r}=3$
. This frequency also shows the largest integral amplification, see figure 15(e). Whereas case C-3DS-M exhibits a response whose shape compares qualitatively to case C-2D-M, case C-3DO-M shows increased growth, and growth at all throughout the whole investigated frequency spectrum in agreement with the results of the B-LST analyses. The amplitude spectrum in figure 15(d) is dominated by frequencies
 $\unicode[STIX]{x1D714}_{r}=3$
, 6, and 9.5 reaching a similar order of magnitude of approximately
 $10^{-3}$
at the end of the investigated streamwise range. Due to nonlinear interaction the amplitude of the mean-flow deformation
 $(\unicode[STIX]{x1D714}_{r}=0)$
gains
 $10^{-4}$
. Figure 15(f) reveals that the integral amplification in the near wake is largest for
 $\unicode[STIX]{x1D714}_{r}=9.5$
with the lower frequencies catching up to the end of the streamwise domain.
5.2 Comparison of DNS and B-LST results for
$k=0.1$

For case C-3DO-M a comparison of B-LST
 $u^{\prime }$
- and
 $p^{\prime }$
-eigenfunctions for the tilt-even mode with the corresponding DNS disturbance-amplitude distributions, in general, shows good agreement. However, an excellent representation of the DNS amplitude is obtained for a superposition of the tilt-even and tilt-odd B-LST mode, see figure 16. The relative weights of tilt-even and tilt-odd mode are 0.615 and 0.385 for
 $\unicode[STIX]{x1D714}_{r}=5$
, and 0.69 and 0.31 for
 $\unicode[STIX]{x1D714}_{r}=10$
, respectively.
Comparison of normalized disturbance-amplitude distributions from DNS (shading) and B-LST (thick solid lines) at
 $x=24$
for case C-3DO-M. (a)
 $u^{\prime }$
and (b)
 $p^{\prime }$
yielded by superposition of tilt-even (relative weight 60 %) and tilt-odd (40 %) mode with phase shift adapted to DNS signal for
 $\unicode[STIX]{x1D714}_{r}=5$
. (c)
 $u^{\prime }$
and (d)
 $p^{\prime }$
yielded by superposition of tilt-even (69 %) and tilt-odd (31 %) mode for
 $\unicode[STIX]{x1D714}_{r}=10$
. Thin solid lines are isolines of
 $u_{b}$
, starting with
 $u_{b}=0.1$
near the wall (
 $\unicode[STIX]{x1D6E5}=0.1$
), ending with
 $u_{b}=0.95$
.

Comparison of amplitude growth of streamwise-velocity disturbance
 $u^{\prime }$
from DNS (lines) and B-LST (symbols) for case C-3DO-M. Blank and filled symbols show the B-LST results for tilt-even and tilt-odd mode, respectively. Frequencies
 $\unicode[STIX]{x1D714}_{r}=5$
(——, ▫), amplitudes from B-LST and DNS matched at
 $x=24$
, and
 $\unicode[STIX]{x1D714}_{r}=10$
(— —, ♢), amplitudes matched at
 $x=30$
.

Though the single-frequency DNS signal extracted by temporal Fourier analysis obviously contains more than the dominant eigenmode at non-negligible amplitude, the comparison of dominant B-LST eigenmode growth and DNS disturbance evolution in figure 17 shows excellent agreement downstream of
 $x\approx 22$
for the low frequency. Up to this location the wavy characteristic implies a transient-growth behaviour, where the true amplitude of the dominant low-frequency disturbance is masked by damped modes of identical frequency and similar amplitude values. The high frequency shows a comparable beating within the same region. A similar scenario has been observed by Marxen et al. (Reference Marxen, Iaccarino and Shaqfeh2010) downstream of a two-dimensional roughness. They showed that the beating is due to a superposition of the dominating eigenmode and an additional stable mode generated by the roughness itself. The additional modes involved in the present case could be extracted by applying a multimode decomposition, see, e.g. Tumin (Reference Tumin2007). However, here the transient behaviour is limited to a short streamwise extent downstream the roughness, and a detailed investigation of the transient growth in the roughness wake has been set aside.
In contrast to the low frequency, a weak beating with a large streamwise wavelength can be observed downstream of the region of transient growth. Its wavelength cannot be extracted from the DNS disturbance evolution since only one nodal point of the beating is found within the simulated domain at
 $x\approx 30$
. Assuming that tilt even and tilt-odd mode are the dominant waves of this beating the resulting streamwise wavelength can be estimated to
 $\unicode[STIX]{x1D706}_{beat}=2\unicode[STIX]{x03C0}/|\unicode[STIX]{x1D6FC}_{r,even}-\unicode[STIX]{x1D6FC}_{r,odd}|\gtrsim 70$
which is larger than the computational domain.
The amplitudes of B-LST and DNS for
 $\unicode[STIX]{x1D714}_{r}=10$
in figure 17 have been matched at the streamwise location of the beating’s nodal point. However, the amplitude growth is underpredicted by B-LST within the largest part of the shown streamwise extent. In this case the linear superposition of even and odd modes with similar amplitudes results in a disturbance growth faster than the growth of the most unstable mode itself, at least locally. A similar phenomenon has been observed by DeTullio et al. (Reference DeTullio, Paredes, Sandham and Theofilis2013) in a Mach-2.5 boundary-layer flow altered by an isolated roughness. Nevertheless, B-LST and DNS show a larger integral growth for the roughness-wake second-mode disturbance,
 $N=5.7$
for
 $\unicode[STIX]{x1D714}_{r}=10$
instead of
 $N=4.6$
for
 $\unicode[STIX]{x1D714}_{r}=5$
in
 $22\leqslant x\leqslant 40$
.
5.3 Influence of skewing angle for
$k=0.1$

Figure 18(a) shows that the wake is dominated by low-frequency first-mode disturbances for case C-3DS-M as well as C-3DO-M which is only due to their larger amplitudes in front of the roughness, and the transient-growth behaviour in its near wake. Figure 18(b) reveals that the strong amplitude gain by the transient-growth behaviour is limited to the low-frequency range, see also figure 15(e,f). Case C-3DO-M shows larger local and integral growth up to the end of the domain, with the second-mode disturbances exhibiting larger growth rates than the first-mode ones (for
 $x>30$
) in a much larger streamwise range, see again figure 15(f). At about
 $x=43$
the second-mode growth rate decreases below the first mode’s, but, contrary to case C-3DS-M, is still positive up to the end of the streamwise domain. The above observations are in accordance with the results from the B-LST analysis.
(a) Amplitude growth of streamwise-velocity disturbance
 $u^{\prime }$
. (b) Natural logarithm of the
 $u^{\prime }$
-amplitude normalized by its value at
 $x=13$
for the vicinity of the roughness. Cases: C-3DS-M ▫ for
 $\unicode[STIX]{x1D714}_{r}=3$
(——),
 $\unicode[STIX]{x1D714}_{r}=10$
(— —); C-3DO-M ♢ for
 $\unicode[STIX]{x1D714}_{r}=6$
(——),
 $\unicode[STIX]{x1D714}_{r}=9.5$
(— —),
 $\unicode[STIX]{x1D714}_{r}=1.5$
(— ⋅ —). The vertical lines mark the roughness location
 $x_{r}=15$
.

On a closer look the amplitude growth of frequency
 $\unicode[STIX]{x1D714}_{r}=6$
in figure 18(a) shows a slight kink at
 $x\approx 52$
for case C-3DO-M. It is even more pronounced for
 $\unicode[STIX]{x1D714}_{r}=5$
(not shown). This sudden increase in the growth rate can be associated with a change in the mode dominance from the tilt-even to the tilt-odd mode. A superposition of both modes, as it has already been done in § 5.2, shows that for
 $\unicode[STIX]{x1D714}_{r}=5$
the ratio of even- and odd-mode amplitude is approximately 3:1 at
 $x=35.3$
, then drops to 1:1 at
 $x=46$
and further to 2:3 at
 $x\approx 51.7$
where the conversion becomes visible in the amplitude evolution. The change of the dominant mode from tilt even to odd has also been predicted by B-LST showing larger growth for the tilt-odd mode downstream of
 $x\approx 34$
, and is in accordance with the results of Choudhari et al. (Reference Choudhari, Li, Chang, Norris and Edwards2012) who found a similar behaviour in the wake of a diamond-shaped roughness in a Mach-3.5 boundary layer. Additionally, there may be an energy transfer between even and odd mode which exhibit similar phase velocities of
 $c_{ph}=0.88$
and 0.86 at
 $x=24$
, respectively, and a maximum difference of 3 % throughout the domain investigated by B-LST,
 $16.5\leqslant x\leqslant 40$
.
Based on figures 15 and 18 it becomes clear that for identical disturbance excitation the stronger growth in the wake of the obliquely placed roughness causes earlier transition than in the symmetric set-up. The two cases compared yield the same roughness Reynolds numbers for every criterion, see again table 4. However, the orientation of roughness elements with high ratios of spanwise width and streamwise length induce significant cross-flow in the wake, and thus palpably influences the transition location in the important subcritical regime in hypersonic flow.
5.4 Various roughness heights
$k$
for
$\unicode[STIX]{x1D713}_{r}=45^{\circ }$


Response of the base flow to point-source pulsing with harmonics
 $1\leqslant h\leqslant 50$
of fundamental frequency
 $\unicode[STIX]{x1D714}_{r,0}=0.5$
.
 $u^{\prime }$
-amplitude (shading) over
 $x$
and
 $\unicode[STIX]{x1D714}_{r}$
from temporal Fourier analysis. (a) case C-REF, (b) case C-3DO-S, (c) case C-3DO-M, (d) case C-3DO-L, (e) case H-3DO-M, (f) case H-3DO-L. The vertical lines mark the roughness location
 $x_{r}=15$
.

To investigate the influence of the roughness height on the flow stability properties the base flows of cases C-3DO-S, C-3DO-M and C-3DO-L are exposed to the point-source pulsing. The respective response is shown in figure 19. The characteristic of case C-3DO-S is virtually similar to that of the smooth-plate flow of case C-REF. DeTullio et al. (Reference DeTullio, Paredes, Sandham and Theofilis2013) and DeTullio & Sandham (Reference DeTullio and Sandham2015) also found their small-roughness set-ups with
 $Re_{kk}=169$
at
 $Ma_{\infty }=2.5$
and
 $Re_{kk}=60$
at
 $Ma_{\infty }=6$
, respectively, to only slightly alter the stability properties of the flat-plate flow. As we do, they also conclude that in these cases transition to turbulence is most likely not driven by the isolated roughness.
The response of cases C-3DO-L, see figure 19(d), differs more strongly from the smooth-plate result than case C-3DO-M. The spectrum of unstable frequencies extends to higher values. But whereas for case C-3DO-M there are still distinct frequency ranges that can be assigned to first and second modes with the limit being at about
 $\unicode[STIX]{x1D714}_{r}=9$
, such a clear distinction is lost in case C-3DO-L showing a broad-band response which again is in accordance with the findings from the B-LST. It is also evident that the flow of case C-3DO-L exhibits the strongest disturbance growth with the mean-flow distortion
 $(\unicode[STIX]{x1D714}_{r}=0)$
reaching values greater than 10 % at the end of the computational domain where the flow becomes transitional.
The vicinity of the roughness again is dominated by low-frequency disturbances, see figure 20(a). They benefit from a higher amplitude level in front of the roughness and the amplitude boost due to the transient-growth behaviour which is more pronounced for case C-3DO-L. For the latter the
 $u^{\prime }$
-amplitude increases by a factor of three within
 $\unicode[STIX]{x0394}x=0.5=4k$
whereas in case C-3DO-M it increases by a factor of 2 within the same streamwise range.
(a) Amplitude growth of streamwise-velocity disturbance
 $u^{\prime }$
for case C-3DO-M: symbol (♢), frequencies
 $\unicode[STIX]{x1D714}_{r}=2$
(— —),
 $\unicode[STIX]{x1D714}_{r}=6$
(——), and
 $\unicode[STIX]{x1D714}_{r}=0$
(
 $\cdots \cdots$
); case C-3DO-L: symbol (▵),
 $\unicode[STIX]{x1D714}_{r}=2$
(— —),
 $\unicode[STIX]{x1D714}_{r}=7$
(——) and
 $\unicode[STIX]{x1D714}_{r}=0$
(
 $\cdots \cdots$
). (b) Maxima of the spanwise mean value of
 $w_{b}$
in
 $(y{-}z)$
-cross-planes for cases C-3DO-M (——), C-3DO-L (— —), H-3DO-M (— ⋅ —) and H-3DO-L (— ⋅ ⋅ —). The vertical lines mark the roughness location
 $x_{r}=15$
.

Within the following region of exponential growth higher frequencies show larger amplification rates, and, thus, earlier reach transition-relevant amplitude levels. For case C-3DO-M,
 $\unicode[STIX]{x1D714}_{r}=6$
exhibits the highest amplitude at the end of the computational domain, see figure 20(a). Whereas the disturbances of case C-3DO-M still behave linearly at
 $x=53.7$
reaching an
 $N$
-factor of approximately 9 with respect to the value at
 $x=13$
, for case C-3DO-L the frequency
 $\unicode[STIX]{x1D714}_{r}=7$
gains
 $N=10$
already at about
 $x=40.3$
and goes into nonlinear saturation at
 $x\approx 44.5$
with a
 $u^{\prime }$
-amplitude of approximately 2 %. Starting from lower amplitude levels frequencies
 $7<\unicode[STIX]{x1D714}_{r}\leqslant 11$
show even larger integral growth for
 $13\leqslant x\leqslant 40$
.
 $\unicode[STIX]{x1D714}_{r}=10.5$
reaches
 $N=10$
first at
 $x=38.5$
.
The strong kink in the disturbance-amplitude evolution for
 $\unicode[STIX]{x1D714}_{r}=2$
at about
 $x=38.5$
is a direct consequence of the nonlinear generation of very-low-frequency modes including a three-dimensional mean-flow distortion, see also figure 19(d), that both drive the amplitudes of disturbances with higher frequencies within the low-frequency band. (We found a strongly similar behaviour for subsonic flow cases without roughness with a broad initial disturbance spectrum.) From this location on, nonlinear generation dominates the amplitude growth of low frequencies. Downstream of a kink the maxima of the disturbance-amplitude distribution virtually collapse with the extrema of the mean-flow distortion. Toward the end of the computational domain the flow of case C-3DO-L becomes transitional with the whole frequency spectrum reaching amplitudes larger than 1 %, see figure 19(d).
5.5 Effect of atmospheric-flight conditions
The point-source pulsing is also applied to the hot-flow cases. The response is shown in figure 19(e,f) for cases H-3DO-M and H-3DO-L, respectively. The fundamental frequency
 $\unicode[STIX]{x1D714}_{r,0}=0.5$
corresponds to a dimensional value of
 $\tilde{\unicode[STIX]{x1D714}}_{r,0}/(2\unicode[STIX]{x03C0})=6.73$
kHz instead of 4.55 kHz for the cold-flow conditions. Though for cold- and hot-flow cases the amplitudes drop to comparable levels right downstream of the excitation location due to receptivity properties, the disturbance growth of the hot-flow case is weaker upstream the roughness. The first-mode amplification is strongly reduced due to wall cooling, whereas the second mode is shifted to higher frequencies due to the reduced boundary-layer thickness. Thus, the frequency gap between amplified first and second mode is much larger for the hot flow.
Based on figure 19 it can be observed that, in general, the amplitude growth is weaker for the hot cases comprising smaller bands of amplified frequencies, at least in the near wake of the roughness, which implies a similarity to the smooth-plate behaviour described above. The less pronounced instability of the hot-flow cases may also be attributed to the slightly lower streak amplitude, see figure 10(a), whereas wall-normal and spanwise gradients of the streamwise base-flow velocity obviously are even larger for the hot-flow cases. The final amplitude levels of cases C-3DO-M and H-3DO-L are comparable, the latter having the broader frequency band. Note that these cases also show a comparable cross-flow magnitude, see figure 20(b).
Thus, it becomes clear that case C-3DO-L is the most critical in terms of earlier transition. Compared to case H-3DO-L, the frequency band fills up earlier and more evenly to nonlinear amplitude levels. In case H-3DO-L the gap between first and second modes is still visible when the nonlinear generation of the base-flow distortion
 $(\unicode[STIX]{x1D714}_{r}=0)$
starts at
 $x\approx 42$
.
(a) Amplitude growth of streamwise-velocity disturbance
 $u^{\prime }$
for case C-3DO-L (▫), frequencies
 $\unicode[STIX]{x1D714}_{r}=2$
(— —),
 $\unicode[STIX]{x1D714}_{r}=7$
(——) and case H-3DO-L (○),
 $\unicode[STIX]{x1D714}_{r}=1.5$
(— —),
 $\unicode[STIX]{x1D714}_{r}=4.5$
(——). Base-flow distortion is given by
 $\unicode[STIX]{x1D714}_{r}=0$
(
 $\cdots \cdots$
). The vertical line marks the roughness location
 $x_{r}=15$
. Normalized DNS disturbance-amplitude distribution (shading) of
 $u^{\prime }$
at
 $x=36$
for (a) case C-3DO-L at
 $\unicode[STIX]{x1D714}_{r}=7$
and (b) case H-3DO-L at
 $\unicode[STIX]{x1D714}_{r}=4.5$
. Thin solid lines are isolines of
 $u_{b}$
, starting with
 $u_{b}=0.1$
near the wall (
 $\unicode[STIX]{x1D6E5}=0.1$
), ending with
 $u_{b}=0.95$
.

Nevertheless, the amplitude development of the most amplified frequencies in the near wake and the far wake, respectively, in figure 21(a) reveals an interesting fact: compared to the cases with
 $Re_{kk}=434$
, where the amplitude growth is stronger in general for the cold flow, here growth rates are at comparable levels for distinct frequencies. The growth rates of
 $\unicode[STIX]{x1D714}_{r}=7$
in case C-3DO-L and
 $\unicode[STIX]{x1D714}_{r}=4.5$
in case H-3DO-L are virtually identical within
 $25\lesssim x\lesssim 35$
. In the near-wake the first-mode low-frequency disturbance is even more amplified in case H-3DO-L. However, the respective high-frequency but also first-mode disturbances are again dominant towards the end of the computational domain with case C-3DO-L reaching the nonlinear amplitude levels earlier than case H-3DO-L. The overall integral growth in terms of an
 $N$
-factor for the sum of modes with respect to the amplitude at
 $x=13$
shows
 $N=10$
at
 $x=40.3$
for
 $\unicode[STIX]{x1D714}_{r}=7$
in case C-3DO-L, as already mentioned above. This corresponds to
 $138\unicode[STIX]{x1D6FF}_{u}$
at
 $x_{r}=15$
. In case H-3DO-L frequency
 $\unicode[STIX]{x1D714}_{r}=4.5$
exhibits
 $N=10$
at approximately
 $x=43.8$
or
 $229\unicode[STIX]{x1D6FF}_{u}$
. The similar stability behaviour of cases C-3DO-L and H-3DO-L for distinct frequencies may be attributed to the similar streak amplitude, see figure 10(b). On the other hand, wall-normal and spanwise gradients of the streamwise base-flow velocity are larger and the cross-flow is weaker in case H-3DO-L.
Though growth rates of the most amplified disturbance frequencies are comparable for cases H-3DO-L and C-3DO-L, the mean-flow distortion growth is weaker in the hot flow, see again figure 21(a). This likely is due to the less pronounced mode interaction since the amplitude levels of the involved frequencies are less evenly distributed within the spectrum. Figure 21(b,c) compare the amplitude distributions of the integrally most amplified high-frequency first-mode disturbances. As can be expected from the differences in the base flows their shape is quite different.
The above observations oppose the transition criteria of Bernardini et al. (Reference Bernardini, Pirozzoli and Orlandi2012) and Bernardini et al. (Reference Bernardini, Pirozzoli, Orlandi and Lele2014) which, at identical values of
 $Re_{kk}$
, evaluate the hot-flow cases with wall cooling as more critical, see table 4. The present results reproduce the trend given by the criterion of Redford et al. (Reference Redford, Sandham and Roberts2010) showing stabilization by wall cooling. Nevertheless, the criteria of Bernardini et al. (Reference Bernardini, Pirozzoli and Orlandi2012) and Bernardini et al. (Reference Bernardini, Pirozzoli, Orlandi and Lele2014) still might hold for symmetric roughness configurations. In the asymmetric cases compared here, the respective hot flows show lower cross-flow magnitudes at identical
 $Re_{kk}$
, see again figure 20(b).
The differences in disturbance evolution are small comparing cases H-3DO-M and H2-3DO-M. For the respective emissivities
 $\unicode[STIX]{x1D716}=0.8$
and 0.6 of the radiation adiabatic wall the smooth-wall temperature at
 $x_{r}=15$
differs by approximately 5 %, see table 2. Nevertheless, the trend that can be observed in the comparison of roughness-wake first- and second-mode disturbance growth in figure 22 resembles the well-known behaviour of the smooth-wall flow. Wall cooling stabilizes the first-mode instabilities (figure 22
a), and destabilizes the second-mode ones (figure 22
b). Though, here, the destabilization of the second mode must be accounted to a larger streamwise range of amplification at virtually identical maximum growth rates.
Natural logarithm of the
 $u^{\prime }$
-amplitude normalized by its value at
 $x=13$
for cases H-3DO-M (▿) and H2-3DO-M (▵) for frequencies (a)
 $\unicode[STIX]{x1D714}_{r}=1$
(— —),
 $\unicode[STIX]{x1D714}_{r}=2.5$
(——) and (b)
 $\unicode[STIX]{x1D714}_{r}=12$
(——) and
 $\unicode[STIX]{x1D714}_{r}=13$
(— ⋅ —). Note the different scales. The vertical lines mark the roughness location
 $x_{r}=15$
.

DeTullio & Sandham (Reference DeTullio and Sandham2015) observed a different behaviour for their second-mode-like instability (mode VC) based on a wall-temperature reduction from the adiabatic value to 50 % of it. This change showed only small influence on the low-frequency first-mode instabilities in the wake of the square-box roughness, but showed a reduction of 33 % for the maximum growth rate of the wake mode VC. Note that DeTullio & Sandham (Reference DeTullio and Sandham2015) adapted their global simulation Reynolds number to yield the identical
 $Re_{kk}$
instead of reducing the roughness height. The impact of the rather strong change in the thermal boundary condition on the base flow is not shown by the authors.
5.6 Nonlinear disturbance evolution in the transitional flow regime for case C-3DO-M
To gain a better understanding of the transition onset downstream of the obliquely placed roughness of case C-3DO-M the frequency content of the pulsing is reduced to a biharmonic point-source excitation involving
 $\unicode[STIX]{x1D714}_{r}=5$
and 10. According to the above analysis these represent a first-mode and a second-mode instability, respectively. The excitation amplitude is increased to
 $(\unicode[STIX]{x1D70C}v)_{max,h}^{\prime }=10^{-4}$
for each frequency in order to make sure that on one hand the disturbance evolution starts within the linear regime and on the other hand transition occurs within the investigated computational domain. Phase shifts
 $\unicode[STIX]{x1D703}_{h}$
are again set to zero. The chosen numerical resolution for the simulation yields worst-case values of
 $(\unicode[STIX]{x0394}x^{+},\unicode[STIX]{x0394}y_{min}^{+},\unicode[STIX]{x0394}z^{+})\approx (4.4,0.55,2.2)$
in the turbulent region at the end of the computational domain which are comparable to the resolution chosen for the breakdown scenario in DeTullio & Sandham (Reference DeTullio and Sandham2015). The following results are based on a temporal Fourier analysis with a fundamental frequency of
 $\unicode[STIX]{x1D714}_{r,0}=2.5$
. Thus,
 $\unicode[STIX]{x1D714}_{r}=5$
and 10 correspond to harmonics
 $h=2$
and 4, respectively, and the first subharmonic of the lower excitation frequency can be resolved.
Case C-3DO-M: (a) comparison of streamwise-velocity disturbance amplitudes
 $u^{\prime }$
for excitation amplitudes
 $(\unicode[STIX]{x1D70C}v)_{max,h}^{\prime }=10^{-4}$
(lines) and
 $10^{-7}$
(symbols), respectively, for
 $\unicode[STIX]{x1D714}_{r}=5$
(——), (♢) and
 $\unicode[STIX]{x1D714}_{r}=10$
(— —), (▫) and
 $\unicode[STIX]{x1D714}_{r}=0$
(— ⋅ —). The data for
 $(\unicode[STIX]{x1D70C}v)_{max,h}^{\prime }=10^{-7}$
have been scaled with
 $10^{3}$
. The vertical lines mark the roughness location
 $x_{r}=15$
. (b) Phase velocities from B-LST for the dominant eigenmodes. Tilt-even mode (——) and tilt-odd mode (— ⋅ —) at
 $\unicode[STIX]{x1D714}_{r}=5$
, and tilt-even mode (— —) and tilt-odd mode (— ⋅ ⋅ —) at
 $\unicode[STIX]{x1D714}_{r}=10$
.

According to the comparison of the
 $u^{\prime }$
-amplitude evolution along
 $x$
for the excitation with
 $(\unicode[STIX]{x1D70C}v)_{max,h}^{\prime }=10^{-4}$
and that of the linear analysis above with
 $10^{-7}$
scaled with the missing factor of
 $10^{3}$
in figure 23(a), the streamwise amplitude growth is virtually identical for both excited frequencies up to about
 $x=33$
. At
 $x=32.7$
the three-dimensional mean-flow deformation reaches a
 $u^{\prime }$
-amplitude of 0.5 %, see figure 24. The following deviation from the purely linear behaviour of the disturbance growth involving nonlinear interaction results in saturation of the amplitudes at levels larger than 10 %.
Case C-3DO-M: (a) amplitude spectrum for streamwise-velocity disturbance
 $u^{\prime }$
for the biharmonic point source with amplitude
 $10^{-4}$
, gained from temporal Fourier analysis. (b)
 $u^{\prime }$
-amplitude growth for
 $\unicode[STIX]{x1D714}_{r}=5$
(——),
 $\unicode[STIX]{x1D714}_{r}=10$
(— —) and mean-flow deformation
 $\unicode[STIX]{x1D714}_{r}=0$
(— ⋅ —). Additionally, even (— —) and odd harmonics
 $(\cdots \,)$
of fundamental frequency
 $\unicode[STIX]{x1D714}_{r,0}=2.5$
are shown. The vertical lines mark the roughness location
 $x_{r}=15$
.

Figure 24(a) shows the response to the disturbance excitation for the complete frequency spectrum in terms of
 $u^{\prime }$
-amplitude. The start of the nonlinear generation of the (three-dimensional) mean-flow deformation
 $(\unicode[STIX]{x1D714}_{r}=0)$
at approximately
 $x\approx 21$
is visible in the Fourier data by a sudden increase in growth rate. Near this location the amplitude of
 $\unicode[STIX]{x1D714}_{r}=5$
exceeds
 $10^{-3}$
. Starting from lower amplitude levels but experiencing virtually identical amplification, the generation of even harmonics of
 $\unicode[STIX]{x1D714}_{r,0}=2.5$
which are the harmonics of the excited frequencies, can be observed in figure 24(b). Their amplitude levels at a distinct streamwise location
 $x$
are staggered by increasing frequency due to the successive generation of higher harmonics. Shortly downstream of
 $x=39.5$
, where the mean-flow deformation reaches a
 $u^{\prime }$
-amplitude of approximately 10 %, all even harmonics run into saturation. At
 $x\approx 35$
, the mean-flow deformation reaches the amplitude level of
 $\unicode[STIX]{x1D714}_{r}=10$
and lowers the growth of the latter compared to its exponential growth behaviour in figure 23(a); slightly downstream the low-frequency mode gets an amplitude boost, indicating an enhanced energy transfer from the distorted mean flow. The flow eventually reaches a transitional state, and generation of odd harmonics is initiated which gain comparable amplitude levels at the end of the computational domain.
Case C-3DO-M snap-shot visualization: perspective view of vortex structures by means of the
 $\unicode[STIX]{x1D706}_{2}$
-criterion (
 $\unicode[STIX]{x1D706}_{2}=-0.07$
). Shading indicates wall-normal distance
 $y$
.

Case C-3DO-M snap-shot visualization: (a) top view and (b) side view of vortex structures by means of the
 $\unicode[STIX]{x1D706}_{2}$
-criterion (
 $\unicode[STIX]{x1D706}_{2}=-0.07$
). Shading indicates (a) wall-normal distance
 $y$
and (b) velocity
 $u$
. (c) pressure at the wall
 $p_{w}$
. (d) Skin friction coefficient
 $c_{f}$
based on velocity
 $u$
. Note that axes are not to scale.

Details of figure 26(a,b) with shading for identical quantities at identical levels. Note that for (b) axes are not to scale.

Figures 25 and 26(a,b) show a snap-shot of the flow in terms of vortex structures visualized by means of the
 $\unicode[STIX]{x1D706}_{2}$
-criterion, and figure 26(c,d) the pressure at the wall and the skin friction coefficient. The longitudinal vortex system originating at the roughness and its decay in the wake are visible as well as the first unsteady disturbances at the leading-edge main vortex at approximately
 $x=24$
. Figure 26(b) clearly shows localized vortex structures in the direct line of the steady wake vortex,
 $27.5\leqslant x\leqslant 36$
, with a large wavelength indicating the effect of the low-frequency mode, cf. figure 16(a), most near-wall structure. See also figure 27 for details. For
 $x>30$
the high-frequency mode is visible above with half the wavelength. Looking at figure 16(a,c) for the respective eigenmode shapes it becomes clear that there must be constructive and destructive interference for the far-wall and near-wall structure of the two frequencies, respectively, visible in figure 26(a,b), supported by a nonlinear coupling. With the disturbances reaching amplitudes of roughly 5 % near
 $x=36$
subsequent interaction of induced vortical structures can be observed. For
 $38\leqslant x\leqslant 45$
the low-frequency disturbances with their larger wavelength dominate again, see figure 26(a). Downstream of approximately
 $x=45$
the start of their breakdown to increasingly smaller scales and the formation of a turbulent wedge is evident. The lift-up of the vortices, and the sudden increase in boundary-layer thickness coinciding with the breakdown of the large vortex structures can be observed. Note that the evolution of the disturbance structures takes place off centre since it is bound to the spanwise position of the dominant low-speed streak. The finest structures can be found on top of the latter. In terms of spanwise location the earliest onset of fluctuation growth is found near
 $z=0.05$
where the superposition of the dominant eigenmodes of the involved frequencies exhibit a local maximum in their amplitude distribution.
In between the evolving turbulent wedges, occurring periodically in spanwise direction, an oblique near-wall wave pattern can be observed which makes the turbulent wedge look fishbone-like in the top view of the vortex structures, see again figure 26(a). The propagation direction of these waves with respect to the
 $z$
-direction differs dependent on the half-plane
 $(z\gtrless 0)$
they are moving in. Near the spanwise boundaries of the computational domain, where periodicity is prescribed, the waves from both half-planes interfere. From the pressure distribution at the wall in figure 26(c) the streamwise and spanwise wavenumbers can be measured to
 $\unicode[STIX]{x1D6FC}_{r}\approx 9.6$
and
 $\unicode[STIX]{x1D6FE}_{r}\approx 4.9$
. Based on an estimation for the phase velocity from the LST results for the corresponding smooth-plate flow,
 $c_{ph}\approx 0.92$
for
 $\unicode[STIX]{x1D6FE}_{r}\approx 5.5$
, the frequency of these waves is approximately
 $\unicode[STIX]{x1D714}_{r}=8.8$
. Since the flow outside the direct wake is still smooth-plate like, the observed waves are three-dimensional smooth-wall oblique second-mode instabilities excited by the high-frequency roughness-wake mode, cf. figure 13(c).
For the following analysis the flow data have been averaged over 18 time periods of the lower disturbance excitation frequency
 $\unicode[STIX]{x1D714}_{r}=5$
. The doubling of the number of periods for averaging yields the same results. The mean values of time are marked with
 $\overline{\unicode[STIX]{x1D719}}$
. The spanwise averaging has been restricted to the range with turbulent appearance
 $0.05\leqslant z\leqslant 0.3$
at the end of the computational domain. For comparison the spanwise average for the complete domain is shown.
Case C-3DO-M: (a) local skin friction coefficient
 $c_{f}$
with respect to
 $\langle \overline{u}\rangle$
. Spanwise averaging for
 $-1.6\leqslant z<1.6$
(— —) and
 $0.05\leqslant z\leqslant 0.3$
(——); laminar smooth-plate solution (— ⋅ —) and values for turbulent flow (— ⋅ ⋅ —). (b) Maximum over
 $y$
and
 $z$
of
 $tke$
(— —) and volume integral of
 $I_{tke}(x)$
(——). (c) Van Driest transformed
 $\overline{u}$
-profile normalized by wall shear velocity
 $u_{vD}^{+}$
at
 $x=53$
. Spanwise averaging as in (a);
 $u^{+}=y^{+}$
(— ⋅ —),
 $u^{+}=0.38^{-1}\ln y^{+}+4.1$
(— ⋅ ⋅ —), and results for a turbulent Mach-4.5 flat-plate flow from Jiang et al. (Reference Jiang, Choudhari, Chang and Liu2006), symbols (▫).

In figure 28(a) the strong increase of the mean skin friction coefficient
 $c_{f}$
, which commonly is used to signal the onset of transition, starts at approximately
 $x=40.5$
. It correlates well to the streamwise region where the disturbance amplitudes of the excited frequencies reach their saturation level, compare figure 24(b). The same holds for the maximum of the turbulent kinetic energy
 $tke=0.5(\overline{{u^{\prime }}^{2}}+\overline{{v^{\prime }}^{2}}+\overline{{w^{\prime }}^{2}})$
in streamwise cross-planes, see figure 28(b). The volume integral
 $I_{tke}(x)=\int _{x_{1}}^{x}\int _{y_{1}}^{y_{2}}\int _{z_{1}}^{z_{2}}(tke)\,\text{d}\unicode[STIX]{x1D701}\,\text{d}\unicode[STIX]{x1D702}\,\text{d}\unicode[STIX]{x1D709}$
starts to deviate from the exponential growth behaviour upstream. Downstream,
 $c_{f}$
shows the overshoot typical for the transitional regime and afterwards oscillates around the skin friction relation for a compressible turbulent flat-plate boundary layer as given by White (Reference White2006), equation 7-132. The oscillation is likely due to the intermittent state of the turbulence in this still transitional region. The rise in
 $c_{f}$
is moderate for the complete-domain spanwise averages due to the large fraction of laminar flow. The offset with respect to the laminar smooth-plate solution that is evident within the fully laminar region of the flow for
 $18<x<40$
results from the base-flow high-speed streaks caused by the trailing vortices.
Case C-3DO-M: (a) perspective view of time-averaged turbulent kinetic energy by means of an isosurface at
 $tke=0.003$
with isolines of time-averaged streamwise velocity
 $\overline{u}$
in cross-planes at
 $x=38.2$
and 42.4 are shown, starting with
 $\overline{u}=0$
at the wall (
 $\unicode[STIX]{x1D6E5}=0.1$
), ending with
 $\overline{u}=0.95$
. Note that axes are not to scale. Circles indicate starting points of turbulent spreading. Coordinates of point 1
 $(x,y,z)=(38.2,0.32,0.30)$
with
 $\overline{u}=0.78$
. Point 2
 $(41.1,0.15,0.04)$
with
 $\overline{u}=0.85$
. Point 3
 $(42.4,0.09,-0.10)$
with
 $\overline{u}=0.88$
. (b) Pressure at the wall comparing DNS (shading) and the reconstruction based on the four dominant B-LST eigenmodes (solid lines).

As mentioned above the onset of transition is commonly detected based on a strong increase of the skin friction coefficient
 $c_{f}$
. Actually, transition does not start at the wall but above with the distance depending on Mach number as described in Fischer (Reference Fischer1972). This phenomenon has been called ‘precursor transition’ by Pruett & Zang (Reference Pruett and Zang1992). For high Mach numbers the point where turbulence is initiated is located near the boundary-layer edge. It roughly coincides with the so-called critical layer
 $c_{ph}=u_{b}$
, where responsible instability modes exhibit amplitude maxima. From its ‘starting point’ the turbulence spreads in wall-normal and spanwise directions forming the turbulent wedge. The initial formation of such a wedge can be seen in figure 29(a) showing an isosurface of time-averaged
 $tke$
. Figure 28(b) shows the streamwise evolution of the
 $tke$
in terms of its specific maximum value occurring in streamwise cross-planes as well as its integral value. Both show exponential growth downstream of the roughness up to the location where the breakdown starts. Interestingly, the isosurface of
 $tke$
shows several streamwise starting points at various spanwise and wall-normal locations. All these points are located near the local boundary-layer edge. The most upstream of these points can be found where the low-speed streak shows its maximum wall-normal extent in the corresponding
 $(y{-}z)$
-cross-plane. This region correlates to the locations of the local maxima in the disturbance-amplitude distributions of the excited frequencies. As already mentioned above, the region where the finest vortex structures can be observed lies directly downstream. For the marked points in figure 29(a)
 $\overline{u}$
roughly differs between 0.78 and 0.88 and, thus, is close to the phase velocities of the involved eigenmodes showing
 $0.875\leqslant c_{ph}\leqslant 0.90$
at
 $x=38$
, see figure 23(b).
Fischer (Reference Fischer1972), investigating turbulent wedges formed behind isolated roughness specks, found that the spreading angle towards the wall ‘seems to remain essentially invariant with Mach number’. DNS results from Pruett & Zang (Reference Pruett and Zang1992) for axisymmetric boundary layers at
 $Ma=4.5$
and 6.8, and Sivasubramanian & Fasel (Reference Sivasubramanian and Fasel2015) for
 $Ma=6$
support this finding. The spanwise spreading angle on the other hand strongly decreases with Mach number. In the present case both spreading angles were evaluated based on the isosurface of time-averaged
 $tke$
shown in figure 29(a). The spanwise angles with respect to the
 $x$
-axis differ at both sides showing about
 $3.5^{\circ }$
in negative and
 $2.4^{\circ }$
in positive
 $z$
-direction. Since only the initial formation of the turbulent wedge is observed these values surely are subject to inaccuracy. Nevertheless, they quite well correspond to the trend given in Fischer (Reference Fischer1972), with a spreading angle between approximately
 $2.6^{\circ }$
and
 $4^{\circ }$
. A similar estimation for the spreading angle in wall-normal direction starting from point 1 in figure 29(a) yields an angle of about
 $1^{\circ }$
. This value agrees with the findings of Pruett & Zang (Reference Pruett and Zang1992),
 $1^{\circ }$
for the axisymmetric Mach-4.5 case, as well as the approximate value of about
 $0.6^{\circ }$
given by Fischer (Reference Fischer1972). Hence, the turbulent-wedge evolution in the streak-induced breakdown with a roughness element is similar to the breakdown without discrete roughness, where the oblique-type breakdown with self-induced streaks typically plays a dominant role.
Figure 28(c) shows the van Driest transformed velocity profiles at the end of the computational domain. The transformation has been carried out according to White (Reference White2006), equation 7-107. The change towards the turbulent profile becomes evident though it is not yet fully developed, particularly to be seen near the boundary-layer edge. The inner layer appears to be developed up to
 $y^{+}=50$
which corresponds to
 $y\approx 0.2$
. For a fully developed turbulent boundary layer the log-law
 $u_{vD}^{+}\approx c_{1}^{-1}\ln y^{+}+c_{2}$
holds within the inner layer. White (Reference White2006) proposes
 $c_{1}\approx 0.41$
and
 $c_{2}\approx 5$
. For the results shown in figure 28(c) the agreement is better for the values
 $c_{1}\approx 0.38$
and
 $c_{2}\approx 4.1$
found by Österlund et al. (Reference Österlund, Johansson, Nagib and Hites2000). This is in agreement with Jiang et al. (Reference Jiang, Choudhari, Chang and Liu2006), who investigated a turbulent Mach-4.5 flat-plate boundary layer, and Stolz & Adams (Reference Stolz and Adams2003).
Perspective views of the vortex structures by means of isosurfaces of
 $\unicode[STIX]{x1D706}_{2}=-0.05$
for
 $32\leqslant x\leqslant 35.5$
from (a) DNS and (b) the reconstruction based on the four dominant B-LST eigenmodes. The shading indicates the wall-normal coordinate
 $y$
.

Encouraged by the very good agreement between the amplitude distributions from DNS and B-LST, the three-dimensional disturbance evolution of the present case is reconstructed based on the B-LST results from § 4 and information about amplitudes and phase shifts of the involved modes from DNS. For both excited frequencies only the tilt-even and tilt-odd mode are taken into account. The comparison of the resulting vortex structures and pressure distribution at the wall are shown in figures 30 and 29(b), respectively. The general agreement between DNS and B-LST is very good. Non-parallel effects, see Bonfigli & Kloker (Reference Bonfigli and Kloker2007) for a three-dimensional incompressible boundary layer with cross-flow vortices, play a minor role for the present B-LST analysis of the flow with streaks having eventually vanishing streamwise vorticity.
6 Conclusions
The linear and nonlinear disturbance evolution in a Mach-4.8 flat-plate laminar boundary-layer flow altered by skewed three-dimensional roughness elements has been investigated applying biglobal linear stability theory and direct numerical simulation. A persistent low-speed streak is generated in the wake of the element with the streak amplitude being 40 % larger than for the respective non-skewed element at identical
 $Re_{kk}=434$
. The dominant vortex causing the streak originates at the leading edge and generates a cross-flow-vortex-like streamwise-velocity distribution in the cross-planes. Though roughness Reynolds numbers of up to
 $Re_{kk}=990$
have been investigated global instability has not been observed, in accordance with the simulations of DeTullio et al. (Reference DeTullio, Paredes, Sandham and Theofilis2013) for a symmetric roughness. Within the subsonic regime it occurs for
 $Re_{kk}\gtrsim 600$
, see, e.g. Kurz & Kloker (Reference Kurz and Kloker2016).
Biglobal linear stability analyses show that, compared to the symmetric case, the oblique set-up leads to a more pronounced instability due to the cross-flow induced by the roughness itself. In general, multiple unstable eigenmodes are identified. The two most unstable modes can be assigned to the classification even (varicose) and odd (sinuous) though their shape is tilted. Dependent on their frequency the roughness-wake modes exhibit first- and second-mode characteristics of smooth-plate flow; the second-mode type can be associated with a region of supersonic phase velocity. DeTullio & Sandham (Reference DeTullio and Sandham2015) also correlate their varicose mode VC to the flat-plate second mode.
The even and tilt even modes exhibit the larger amplification in the near wake of the symmetric and oblique roughness elements, respectively. However, the growth rates of the respective odd modes are more persistent downstream. This implies that they become dominant in the far wake. The unstable regions of the first and second modes in the stability diagram converge and merge with increasing roughness height.
In the near wake the growth rates are a function of the spanwise spacing of the periodically placed, skewed roughness elements due to the induced mean cross-flow which is stronger for a closer spacing.
The results from DNS and B-LST agree well, i.e. no strong sensitivity with respect to the base-flow representation in the B-LST is found like for a three-dimensional base flow, see Bonfigli & Kloker (Reference Bonfigli and Kloker2007). The DNS of the response to a point-source pulsing, excited near the leading edge of the flat plate, confirms the dominance of the tilt-even mode. The growth rates agree well downstream of a region of transient growth. The latter has not been found relevant for transition in any of the cases investigated here. Excellent agreement of B-LST and DNS is achieved by a superposition of the two most amplified B-LST eigenmodes at similar amplitudes. The tilt-odd mode gains in influence in downstream direction as predicted by B-LST.
For
 $Re_{kk}=434$
the disturbance growth in the wake of the symmetric roughness is dominated by first-mode instabilities, whereas the second mode becomes equally important for the oblique set-up.
The nonlinear disturbance evolution has been studied based on a bifrequent point source. The disturbance amplitude has been chosen to initiate turbulence approximately 130 boundary-layer thicknesses downstream of the element, where biglobal stability theory predicts an
 $N$
-factor of approximately 7. The breakup of coarse vortex structures into finer ones starts at the top of the low-speed streak. In between the turbulent wedges developing periodically in spanwise direction, obliquely running second-mode waves can be identified. The three-dimensional flow field can be reconstructed with high quality based on the B-LST eigenfunctions and growth rates before saturation.
DNS results for
 $Re_{kk}=990$
show the largest amplitude growth with a broadening spectrum of more evenly amplified frequencies which corresponds to the B-LST results of merging roughness-wake first- and second-mode region. Nonlinear generation of very-low-frequency modes including a three-dimensional mean-flow distortion is observed, both drive the amplitudes of disturbances with higher frequencies within the low-frequency band as known from subsonic flow with a broad disturbance background.
The comparison of the flow behaviour under cold adiabatic wind-tunnel and hot atmospheric-flight conditions with cooled wall at identical roughness Reynolds number
 $Re_{kk}$
reveals strong differences in the steady base flow. The longitudinal vortices in the roughness wake differ in strength and position with respect to each other affecting the streak formation. The hot-flow cases are less critical in terms of causing premature transition despite the transition criteria derived by Bernardini et al. (Reference Bernardini, Pirozzoli and Orlandi2012) and Bernardini et al. (Reference Bernardini, Pirozzoli, Orlandi and Lele2014) indicate increased instability. This may be explained by the strong influence of the roughness-induced cross-flow which, at identical
 $Re_{kk}$
, is smaller for the hot-flow cases. On the other hand, the influence of wall cooling in these criteria may be scaled too strong whereas the criterion of Redford et al. (Reference Redford, Sandham and Roberts2010) gives the correct trend also with cross-flow.
The growth rates of the first- and second mode instabilities of the roughness-wake flow respond to a variation of the amount of wall cooling as it is known from the smooth-plate flow. The roughness-wake first mode is stabilized whereas the second mode is destabilized by stronger wall cooling. This finding is in contrast to the results of DeTullio & Sandham (Reference DeTullio and Sandham2015) where, however, the amount of the variation of wall cooling has been much larger.
Acknowledgements
The computational resources provided by the federal High-Performance Computing Center Stuttgart (HLRS) within project LAMTUR are gratefully acknowledged.



