




Introduction
Biogenic iron(III) oxyhydroxides (BIOS) are mixtures of Fe(III) nanominerals, cells and extracellular polymeric substances (EPS) produced by Fe(II)-oxidising bacteria (FeOB). The mineral component typically consists of ferrihydrite ((FeIII)4-5(OH,O)12, Fh), goethite (FeIIIO(OH)) and amorphous Fe(III) phosphates depending on the geochemical conditions of the environment or the experimental conditions (Abramov et al., Reference Abramov, Straub, Tejada, Grimm, Schädler, Bulaev, Thorwarth, Amils, Kappler and Kleindienst2022; Angelova et al., Reference Angelova, Groudeva, Slavov, Iliev, Nedkov, Sziklai-László and Krezhov2015; Ferris, Reference Ferris2005; Gault et al., Reference Gault, Langley, Ibrahim, Renaud, Takahashi, Boothman, Lloyd, Clark, Ferris and Fortin2012; Kikuchi et al., Reference Kikuchi, Makita, Takai, Yamaguchi and Takahashi2014; Miot et al., Reference Miot, Remusat, Duprat, Gonzalez, Pont and Poinsot2015, Reference Miot, Benzerara, Obst, Kappler, Hegler, Schädler, Bouchez, Guyot and Morin2009a, Reference Miot, Benzerara, Morin, Kappler, Bernard, Obst, Férard, Skouri-Panet, Guigner and Posth2009b; Nedkov et al., Reference Nedkov, Slavov, Angelova, Blagoev, Kovacheva, Abrashev, Iliev and Groudeva2016). The organic part is mostly lipid and polysaccharide moieties associated with aliphatic groups in the outer part of the minerals, while carboxylic and aromatic moieties are incorporated within the structure (Chan et al., Reference Chan, Fakra, Edwards, Emerson and Banfield2009; Sowers et al., Reference Sowers, Holden, Coward and Sparks2019; Whitaker et al., Reference Whitaker, Austin, Holden, Jones, Michel, Peak, Thompson and Duckworth2021). At circumneutral pH and microoxic conditions, biotic Fe(II) oxidation occurs at a higher rate than abiotic oxidation (Baker et al., Reference Baker, Matzen, Schuler, Toner and Girguis2023). Furthermore, there are numerous observations of orange-coloured microbial mats rich in Fe(III) nanominerals across different environments (Brooks and Field, Reference Brooks and Field2020; Garber et al., Reference Garber, Cohen, Nealson, Ramírez, Barco, Enzingmüller-Bleyl, Gehringer and Merino2021). Hence, BIOS represent a significant component of Fe(III) oxyhydroxide minerals in environments where FeOB are present.
The concept of a ‘rusty carbon sink’ has been explored extensively in recent years, underscoring the importance of Fe(III) (oxyhydr)oxides in controlling the bioavailability of organic carbon (OC) (Goebel et al., Reference M.-O, Bachmann, Woche and Fischer2005; Yudina and Kuzyakov, Reference Yudina and Kuzyakov2019). On average, about 40% and 19% of the total organic carbon (TOC) is associated with Fe in terrestrial soils and marine sediments, respectively (Jia et al., Reference Jia, Li, Guo and Xie2024; Lalonde et al., Reference Lalonde, Mucci, Ouellet and Gélinas2012). These Fe(III) minerals can be altered by Fe(III)-reducing bacteria (FeRB) that reduce Fe(III) to Fe(II) coupled to the oxidation of electron donors such as OC, CH4, H2 or sulfur species (Chen et al., Reference Chen, Li, Battisti, Guan, Montoya, Osvatic, Pjevac, Pollak, Richter, Schintlmeister, Wanek, Mussmann and Loy2025; Kappler et al., Reference Kappler, Bryce, Mansor, Lueder, Byrne and Swanner2021; Knoll, Reference Knoll, Canfield and Konhauser2012; Konhauser et al., Reference Konhauser, Kappler and Roden2011). The extent of Fe(III) reduction is governed by the crystallinity and size of the minerals, and the availability of biodegradable OC (Roden, Reference Roden2003, Reference Roden2004; Xu et al., Reference Xu, Mansor, Li, Chiu, Haderlein, Kappler and Joshi2025). Intriguingly, the Fe(III) associated with BIOS (BIOSFe(III)) has been shown to be more bioavailable for microbial reduction than that in synthetic Fe(III) (oxyhydr)oxides (Ferris, Reference Ferris2005; Langley et al., Reference Langley, Gault, Ibrahim, Renaud, Fortin, Clark and Ferris2009a, Reference Langley, Igric, Takahashi, Sakai, Fortin, Hannington and Schwarz-Schampera2009b; Straub et al., Reference Straub, Hanzlik and Buchholz-Cleven1998). The increased reactivity is attributed to the lower crystallinity and higher surface area of BIOS compared to synthetic Fe(III) (oxyhydr)oxides (Chan et al., Reference Chan, Fakra, Edwards, Emerson and Banfield2009; Miot et al., Reference Miot, Remusat, Duprat, Gonzalez, Pont and Poinsot2015; Toner et al., Reference Toner, Santelli, Marcus, Wirth, Chan, McCollom, Bach and Edwards2009; Whitaker et al., Reference Whitaker, Austin, Holden, Jones, Michel, Peak, Thompson and Duckworth2021). Specifically, Langley et al. (Reference Langley, Gault, Ibrahim, Renaud, Fortin, Clark and Ferris2009a) found that Shewanella putrefaciens CN32 reduced BIOS twice as quickly as synthetic 2-line ferrihydrite. Moreover, BIOS of different origins exhibit different reactivity – BIOSFe(III) from Leptothrix spp. were reduced twice as fast as those from field sites dominated by Gallionella spp. (Langley et al., Reference Langley, Gault, Ibrahim, Renaud, Fortin, Clark and Ferris2009a; Najem et al., Reference Najem, Langley and Fortin2016). These studies raised the question as to whether other BIOS will also display different bioavailability depending on their origin, and why (i. e. due to variable crystallinity and organic association). Furthermore, as diverse FeRB species exist in nature, there is the question of whether different BIOS might exhibit varying reactivity to different FeRB.
The ‘rusty carbon sink’ concept is especially relevant to environments undergoing rapid thawing, such as in high-latitude zones and mountain glaciers. As ice thaws due to climate change, previously buried OC is suddenly at risk of being decomposed into greenhouse gases such as CO2 and CH4. Association of OC with Fe(III) (oxyhydr)oxides typically results in protection of the OC from microbial degradation (Adhikari et al., Reference Adhikari, Dunham-Cheatham, Wordofa, Verburg, Poulson and Yang2019). The decomposition rate of glucose, for instance, is >99.5% faster for free glucose in soil than in glucose adsorbed on synthetic ferrihydrite (Porras et al., Reference Porras, Hicks Pries, Torn and Nico2018). Nonetheless, the reductive dissolution of Fe(III) (oxyhydr)oxides by FeRB releases Fe-associated OC that can be further metabolised to simple OC (e. g. acetate, lactate), CO2 and CH4 (Adhikari et al., Reference Adhikari, Zhao, Das, Mejia, Huang, Wang, Poulson, Tang, Roden and Yang2017; Tian et al., Reference Tian, Abulaizi, Yang, Kou, Jia, Hu, Chen and Jia2025). This association is also observed in biofilms, where FeRB typically reside close to or within biofilms of FeOB, together contributing to a biological Fe cycle on small spatial scales (Brooks and Field, Reference Brooks and Field2020; Garber et al., Reference Garber, Cohen, Nealson, Ramírez, Barco, Enzingmüller-Bleyl, Gehringer and Merino2021). At the moment, there is limited knowledge on whether BIOS-associated OC (BIOSOC) can be degraded or released by FeRB.
In high latitudes and mountain glaciers, as well as in temperate climate regions across Earth, soils undergo regular freeze-thaw cycles that affect Fe–OC associations (Patzner et al., Reference Patzner, Mueller, Malusova, Baur, Nikeleit, Scholten, Hoeschen, Byrne, Borch, Kappler and Bryce2020 and Reference Patzner, Kainz, Lundin, Barczok, Smith, Herndon, Kinsman-Costello, Fischer, Straub, Kleindienst, Kappler and Bryce2022). On the one hand, freeze-thawing is known to facilitate aggregation (Wu et al., Reference Wu, Liu, Li, Xiao and Hu2022) and to slow down mineral transformation due to the lower temperature (Mullin, Reference Mullin2004; Putnis, Reference Putnis2009). On the other hand, freeze-thawing can also accelerate mineral transformation by generating high surface area fractures or promoting localised high ion concentrations (e. g. O2, H+, Fe2+) in microenvironments around the minerals (Jeong et al., Reference Jeong, Kim, Min and Choi2015; Sebaaly et al., Reference Sebaaly, van Rijn, Hanna and Boily2025; Zhai et al., Reference Zhai, Zhang, Melnikov, Zhang, Yang and Jin2021). Freeze-thawing can also promote the release of OC from mineral aggregates (Wu et al., Reference Wu, Liu, Li, Xiao and Hu2022) or promote the degradation of complex OC (Fellman et al., Reference Fellman, D’Amore and Hood2008; Pokrovsky et al., Reference Pokrovsky, Karlsson and Giesler2018; Payandi-Rolland et al., Reference Payandi-Rolland, Shirokova, Labonne, Bénézeth and Pokrovsky2021), potentially increasing its bioavailability. Hence, freezing causes a variety of interrelated effects in soils, necessitating laboratory experiments to quantify its net effects on the bioavailability of Fe(III). BIOS are also exposed to freeze-thawing. Thus, controlled laboratory experiments using freeze-thawed BIOS are necessary to directly quantify the net Fe(III) reduction rate and extent, as well as providing mechanistic insights into how changes in properties relate to changes in bioavailability.
In this study, we investigated the bioavailability of BIOS as a function of multiple variables: three origins of BIOS, two FeRB, with and without added OC, and before and after freeze-thawing. This combination of variables resulted in a total of 24 setups, allowing us to investigate the bioavailability of BIOS with wide implications across diverse environmental systems. Under some conditions, we also compared the bioavailability of BIOS to synthetic ferrihydrite, underlining the importance of performing experiments with naturally relevant materials to avoid interpretation based solely on pure lab-synthesised minerals.
Methods
Fe(III) mineral sources
All glassware used for cultures was washed in acid (1 M HCl), then rinsed three times with double deionised water (DDI, Millipore, >18 MΩ cm–1), and subsequently baked at 180°C for 4 h and 30 min prior to use. Sampling was conducted under aseptic and anoxic conditions in a glovebox (MBraun Unilab Workstation, 100% N2 atmosphere).
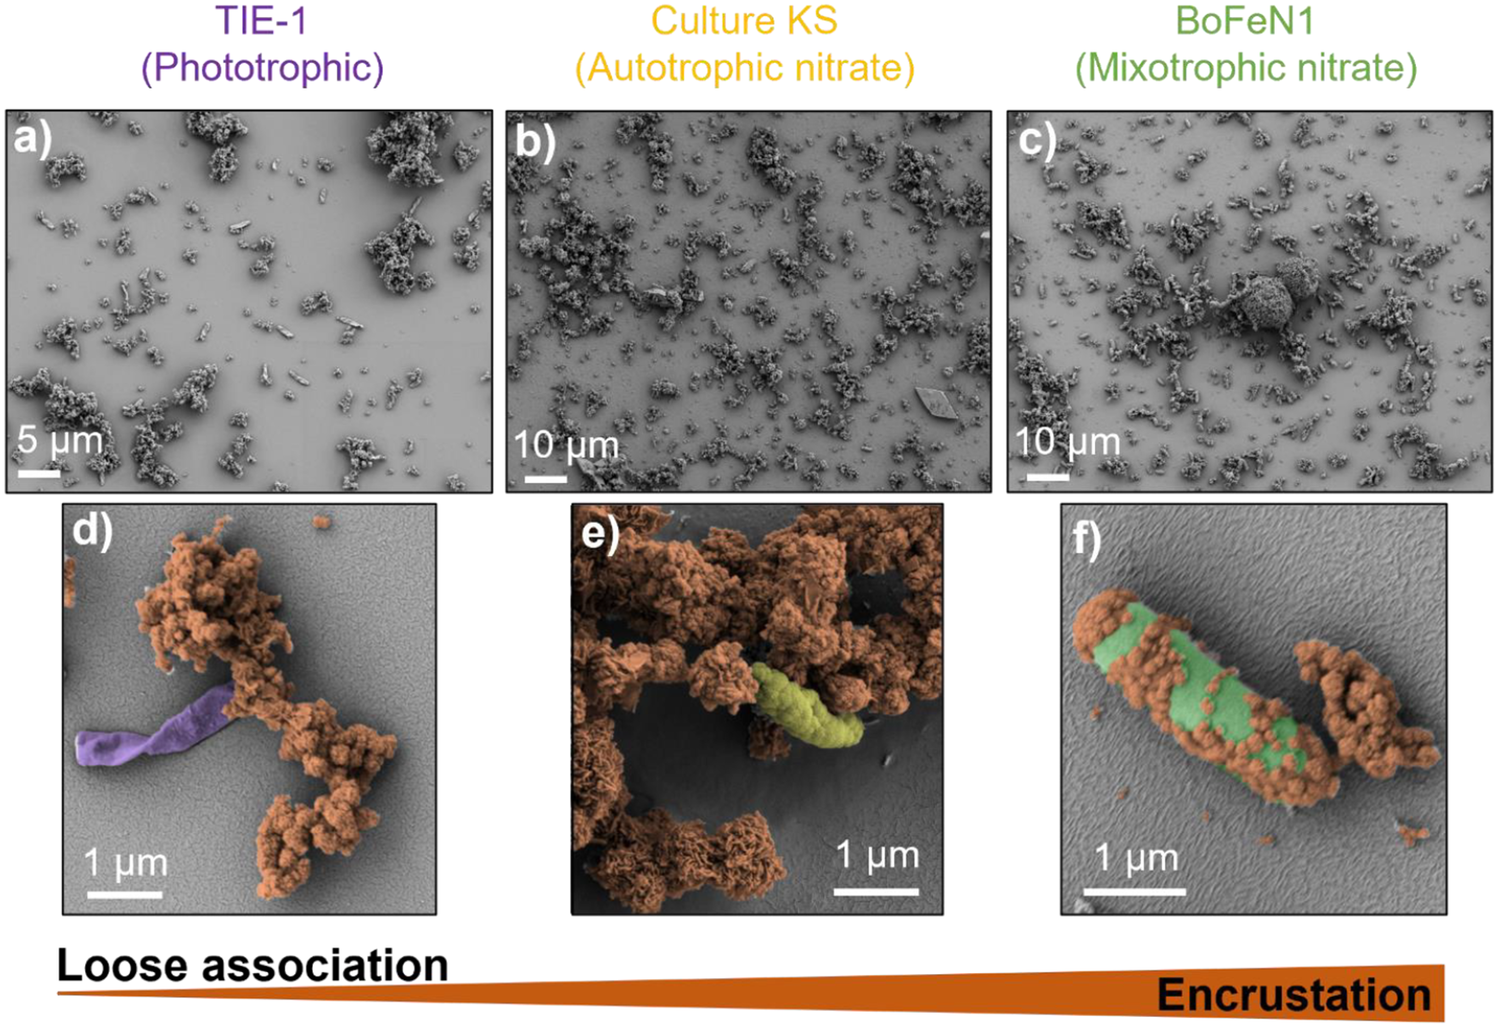
BIOS were obtained from three Fe(II)-oxidising bacteria strains with different Fe(II) oxidation mechanisms: photoferrotrophy by Rhodopseudomonas palustris TIE-1 (hereafter TIE-1), chemoautotrophy coupled to nitrate reduction by enrichment culture KS (hereafter KS) and mixotrophy coupled to nitrate reduction by Acidovorax sp. BoFeN1 (hereafter BoFeN1) (Fig. 1; Text S1). The FeOB were grown in 22 mM bicarbonate-buffered mineral medium at pH 7 (Ehrenreich and Widdel, Reference Ehrenreich and Widdel1994) in 100 mL serum bottles with 50 mL headspace of N2/CO2 (90:10 v/v) in the dark at 28°C for BoFeN1 and KS, and at 20°C under illumination for TIE-1. The BoFeN1 medium had a lower phosphate concentration (1 mM) in addition to 3.5 mM NaCl to maintain the ionic strength in the medium. It was then amended with 10 mM Fe(II) (as Fe2Cl), 6 mM NO3– (as NaNO3) and 2 mM acetate (as CH3COONa). KS medium was amended with 10 mM Fe(II) and 2 mM NO3–. TIE-1 medium was amended with 3 mM Fe(II), i. e. a lower initial Fe(II) concentration than the other strains, because of its faster metabolism at this concentration. We acknowledge that at lower Fe(II) concentrations TIE-1 BIOS are richer in ferrihydrite, while at higher concentrations and therefore longer incubation time, TIE-1 BIOS have a higher proportion of crystalline minerals due to recrystallisation and reaction with the Fe(II) in solution (Jiao et al., Reference Jiao, Kappler, Croal and Newman2005; Nikeleit et al., Reference Nikeleit, Maisch, Byrne, Harwood, Kappler and Bryce2024). The media were inoculated with 1% (v/v) of a preculture in the case of KS, 5% (v/v) of BoFeN1 and 3% (v/v) of TIE-1. Precultures were grown in the same conditions as described above.
Scanning electron micrographs of biogenic iron oxides used in this study. Overview of (a) Rhodopseudomonas palustris TIE-1 (TIE-1), (b) enrichment culture KS (KS) and (c) Acidovorax sp. BoFeN1 (BoFeN1). Close-up false colour images show that (d) TIE-1 (purple) has loose cell-mineral associations. (e) KS (yellow) has partial associations with some cells of the flanking community being encrusted. In the image, one representative fully encrusted cell, with characteristic granular surface made by the precipitated Fe(III) (oxyhydr)oxides is shown. (f) BoFeN1 (green) has high degree of encrustation.

Figure 1. Long description
A six-panel S E M display arranged in two rows.
Top row overview panels:
Panel a: T I E-1 (Phototrophic) shows scattered small clusters of minerals and individual cells. Scale bar is 5 micrometers.
Panel b: Culture K S (Autotrophic nitrate) displays a greater density of mineral aggregates across the surface. Scale bar is 10 micrometers.
Panel c: BoFeN1 (Mixotrophic nitrate) shows large, dense mineral clusters and encrusted spherical structures. Scale bar is 10 micrometers.
Bottom row: close-up false-color panels:
Panel d: T I E-1 shows a purple-colored rod-shaped cell positioned next to, but not covered by, a brown-colored mineral cluster, representing loose association. Scale bar is 1 micrometer.
Panel e: Culture K S shows a yellow-green cell partially embedded within a large brown mineral mass. Scale bar is 1 micrometer.
Panel f: BoFeN1 shows a green rod-shaped cell almost entirely covered by brown granular Fe I I I (oxyhydr)oxide precipitates, representing a high degree of encrustation. Scale bar is 1 micrometer.
At the bottom, a horizontal wedge-shaped gradient bar transitions from thin to thick, labeled Loose association on the left and Encrustation on the right.
For native BIOS experiments, BIOS were collected when the Fe(II)/Fe(total) ratio was 5.7 ± 1.5%, 8.0 ± 2.0% and 7.0 ± 0.2% for TIE-1, BoFeN1 and KS, respectively, indicating near complete oxidation. For experiments with freeze-thawed BIOS, the initial Fe(II)/Fe(total) ratio for BIOS of TIE-1, BoFeN1 and KS was 6.9 ± 0.6%, 13.4 ± 0.3% and 27.1 ± 0.5%, respectively. This corresponded to 6 days of incubation for BoFeN1 and KS, and 12 days for TIE-1. To collect the BIOS, the serum bottles with the cultures were centrifuged at 12,045 g for 2 min and the supernatant was exchanged with fresh FeRB medium (composition detailed below). This was repeated three times for each bottle. After the last centrifugation, the supernatant was removed and all the BIOS were finally collected, resuspended with FeRB medium, and stored anoxically and aseptically at 4°C. For freeze-thawed BIOS setups, the 200 mL serum bottles containing BIOS (after washing) were left in a freezer at –20°C for 13 days. After this time, the bottles were left to thaw at room temperature before transferring the BIOS for the Fe(III) reduction experiments with FeRB, keeping the anoxic and aseptic conditions.
Two-line ferrihydrite was synthesised according to Schwertmann and Cornell (Reference Schwertmann and Cornell2008). First, 40 g of Fe(NO3)3 9H2O was dissolved in 500 mL of MilliQ water and the pH of the solution was adjusted to 7.3 by titration with 1 M KOH. After 2 h of incubation, the pH of the solution was adjusted to 7.5 with KOH. The minerals were washed four times with MilliQ water before resuspension in water to a concentration of ~335 mM Fe total.
Cultivation of FeRB and experimental setup
Fe(III)-reducing bacteria have developed multiple mechanisms to reduce Fe(III), including direct contact between minerals and the cell membrane, conductive pili, electron shuttles and chelation. Here we tested BIOS bioavailability for FeRB Shewanella oneidensis MR-1 (hereafter S. oneidensis) and Geobacter sulfurreducens PCA (hereafter G. sulfurreducens) as model organisms whose primary reduction mechanisms differ (electron shuttles and direct cell-mineral contact, respectively; Text S2). The FeRB were grown in 30 mM bicarbonate-buffered mineral medium at pH 7 (Ehrenreich and Widdel, Reference Ehrenreich and Widdel1994) in 100 mL serum bottles with 50 mL headspace of N2/CO2 (90:10 v/v %) in the dark at 28°C. Six bottles were amended with ~6 mM of BIOSFe(III) from each of the three FeOB (18 bottles in total). Of these, nine bottles were amended with ~4 mM of an additional carbon source: acetate for G. sulfurreducens and lactate for S. oneidensis. The same setup applies for experiments with freeze-thawed BIOS. The initial cell concentration in the experiment was ~5 × 10⁵ cells mL–1, achieved by inoculating the media with 5% (v/v) of a preculture containing ~107 cells mL–1 of each FeRB strain. Cell concentration was calculated using optical density (OD) and calibration curves from our laboratory in the case of S. oneidensis (OD = 0.095 ± 0.002) and from Kubannek et al. (Reference Kubannek, Thiel, Bunk, Huber, Overmann, Krewer, Biedendieck and Jahn2020) in the case of G. sulfurreducens (OD = 0.17 ± 0.04). Precultures were grown using fumarate as an electron acceptor. Duplicates of FeRB cultures with ~5 mM acetate/lactate as an electron donor and ~6 mM ferrihydrite as an electron acceptor were set up to check for cell viability in some cases. Negative controls for both setups (with and without carbon) contained ~6 mM of Fe(III) of each BIOS and acetate/lactate as stated above.
Geochemistry
Every 2 days, 4 mL of sample were taken from each replicate during the first 12 days with a syringe under anoxic conditions in a glovebox. Because of the lower Fe(III) reduction rate of S. oneidensis, sampling was done every 4–7 days after day 12. Samples were split into two vials, one for centrifugation at 12,045 g for 5 min and the other one (without centrifugation) for Fe(II) and Fe(total) content (150 μL). From the supernatant of the centrifuged samples, aliquots were taken for dissolved OC (in the form of non-purgeable OC) and Fe2+ content. Samples for Fe measurements were diluted 1:1 with 1 M HCl inside the glovebox and further diluted with 1 M HCl prior to analysis.
Fe content (Fe2+, Fe(II) and Fe total) was quantified in triplicate by colorimetry using the ferrozine assay (Hegler et al., Reference Hegler, Posth, Jiang and Kappler2008; Stookey, Reference Stookey1970). For quantification of Fe(II) and Fe2+, 20 μL of sample were added to 80 μL of 1 M HCl in a 96-well plate followed by 100 μL of ferrozine reagent. After 5 min, the ferrozine–Fe(II) complex was measured at 562 nm in a plate reader (Multiskan GO; Thermo Fisher Scientific). For Fe total (Fe(tot)), 20 μL of sample were added to 80 μL of hydroxylamine hydrochloride (10% w/v in 1 M HCl) in a 96-well plate. After 30 min of reaction, the ferrozine reagent was added, and the ferrozine-Fe(II) complex was measured after 5 min of incubation. All samples were measured in triplicate and in the dark. Each 96-well plate also contained triplicates of 50, 100, 200, 400, 600, 800 and 1000 μM Fe(II) ethylenediammonium sulfate tetrahydrate for standard curve calibration. The aliquot for dissolved OC concentration was diluted 1:4 in 80 mM HCl and measured in triplicate with a TOC analyser (multi N/C 2100S; Analytik Jena AG). Each run contained standards of 5, 10, 20 and 40 mg L–1 OC for calibration.
Solid phase analysis
Four aliquots of 2–5 mL each from the washed BIOS and from the freeze-thawed BIOS were centrifuged, and the supernatant was discarded. The solids were then dried (>24 h) and stored under anoxic conditions until total carbon analysis, surface area analysis, μ-X-ray diffraction (µ-XRD) and Mössbauer spectroscopy.
The TOC content in the solid phase was determined in duplicate with a soliTOC (Cube; Elementar). The specific surface area (SSA) was determined with the Brunauer–Emmett–Teller equation (Brunauer et al., Reference Brunauer, Emmett and Teller1938) by adsorption/desorption of N2 using a Micromeritics Gemini VII surface area and porosity analyser (Micromeritics Instrument Corporation). At partial pressures ranging from 0.05 to 0.3 P/P 0 and at 77 and 298 K, N2 adsorption was quantified from outgassed samples over a 24 h period.
μ-XRD was performed with a Bruker D8 Discover GADDS XRD2 micro-diffractometer equipped with a standard sealed tube with a Co-anode (CoKα radiation, λ = 0.17903 nm, 30 kV/30 mA). The measurement time was 240 s at detector positions 15° and 40°. Resulting diffractograms were analysed using the software Match! (version 3.6.2.121). Crystallite size (D) was calculated using the Scherrer equation (Patterson, Reference Patterson1939):

where k is the Scherrer constant (assumed to be 0.9),
$ \unicode{x03BB} $
 is the X-ray wavelength (0.1789 nm for CoKa) and B is the full-width half-maximum (FWHM) of the diffraction peak.
The identification of Fe phases within the BIOS was performed by Mössbauer spectroscopy. The dried BIOS were homogenised by mortar and pestle in the glovebox before loading them into Plexiglas holders (area 1 cm2), forming a thin disc. The holders were frozen and stored anoxically until analysis. Holders were inserted into a closed-cycle exchange gas cryostat (Janis cryogenics) under a backflow of He gas to minimise exposure to air. Spectra were collected at 77 and 30 K using a constant acceleration drive system (WissEL) in transmission mode with a 57Co/Rh source. All spectra were calibrated against a 7 μm thick α-57Fe foil that was measured at room temperature. Analysis was carried out using Recoil (University of Ottawa) and the extended Voigt based fitting routine (Lagarec and Rancourt, Reference Lagarec and Rancourt1997). The half width at half maximum was constrained to 0.122 mm s–1 during the fitting process.
Size-distribution analysis
Particle size was measured for the original and freeze-thawed BIOS. The unfiltered particulate fraction was measured using a particle size analyser (Mastersizer 2000; Malvern Instruments) with distilled water as dispersant, adding the samples directly from the serum bottles with the cultures, 1 mL at a time with a pipette until the obscuration was between 10% and 20% in the Hydro 2000S dispersion unit (total volume of 150 mL). A total of 10, 18 and 4 mL were added for the original BIOS of BoFeN1, TIE-1 and KS, respectively. For the freeze-thawed BIOS, 12, 15 and 8 mL were added for BoFeN1, TIE-1 and KS, respectively. Measurements were conducted four times per sample, on duplicate samples, with three cleaning cycles in between each sample.
The particle size and zeta potential of the colloidal fraction (operationally defined as <1.2 μm based on the filter size) was measured by dynamic light scattering using a Zetasizer Nano (Malvern Instruments) with three runs of 20 s each. Samples were collected in a glovebox by passing an aliquot of 2 mL through a 1.2 μm pore size filter (Acrodisc 32 mm syringe filter) and stored there until measurement. Then, 0.9 mL of the filtered samples were placed in a DTS1070 disposable folded capillary cell for both size (three runs, 20 s each) and surface charge (three runs, 50 scans each) analysis. The attenuation and voltage parameters were determined automatically by the instrument. The measured electrophoretic mobility was converted to surface charge using the Smoluchowski method (Hunter, Reference Hunter1981).
Scanning electron microscopy
At the end of the incubation of FeOB, BIOS were collected and imaged with a Scanning Electron Microscope (SEM). An aliquot of 200 μL of sample were fixed in 2.5 %(aq) electron microscopy-grade glutaraldehyde and sequentially dehydrated with 25%, 50% 75%, and 100% (v/v) ethanol and finally 100% (v/v) hexamethyldisilazane (HMDS) on a round glass coverslip previously coated with a 0.01% w/v solution of Poly-L-Lysine to provide a hydrophilic surface for attachment. The samples on the glass slide were dried overnight and attached to aluminium stubs using carbon adhesive tabs. This was then sputter-coated with a 10 nm gold layer (sputtering 50 s at 5×10⁻² mbar, 30 mA, and a working distance of 35 mm) using a BAL-TEC SCD 005 sputter coater. Imaging was performed with a ZEISS Crossbeam 550/5502 L, with an acceleration voltage of 5 kV, and the SESI (secondary electrons–secondary ions) detector.
Statistical analysis
Analysis of variance to test significant differences between treatments was performed in Origin 2025 (OriginLab Co.). The Fe(III) reduction extents reported here and used for calculations refer to the Fe(II)/Fe(total) ratios that were not subtracted with the ratios at time point 0. The Fe(III) reduction rates were calculated from the linear phase of the reduction rate, excluding the lag phase (which could cause potential biases from initial inoculation) and the stationary phase when Fe(III) reduction had stopped. The redundancy analysis (RDA) was performed in CANOCO 5 software (Microcomputer Power Co.).
Results
BIOS characterisation before and after freeze-thawing
Mineralogy and cell-mineral associations
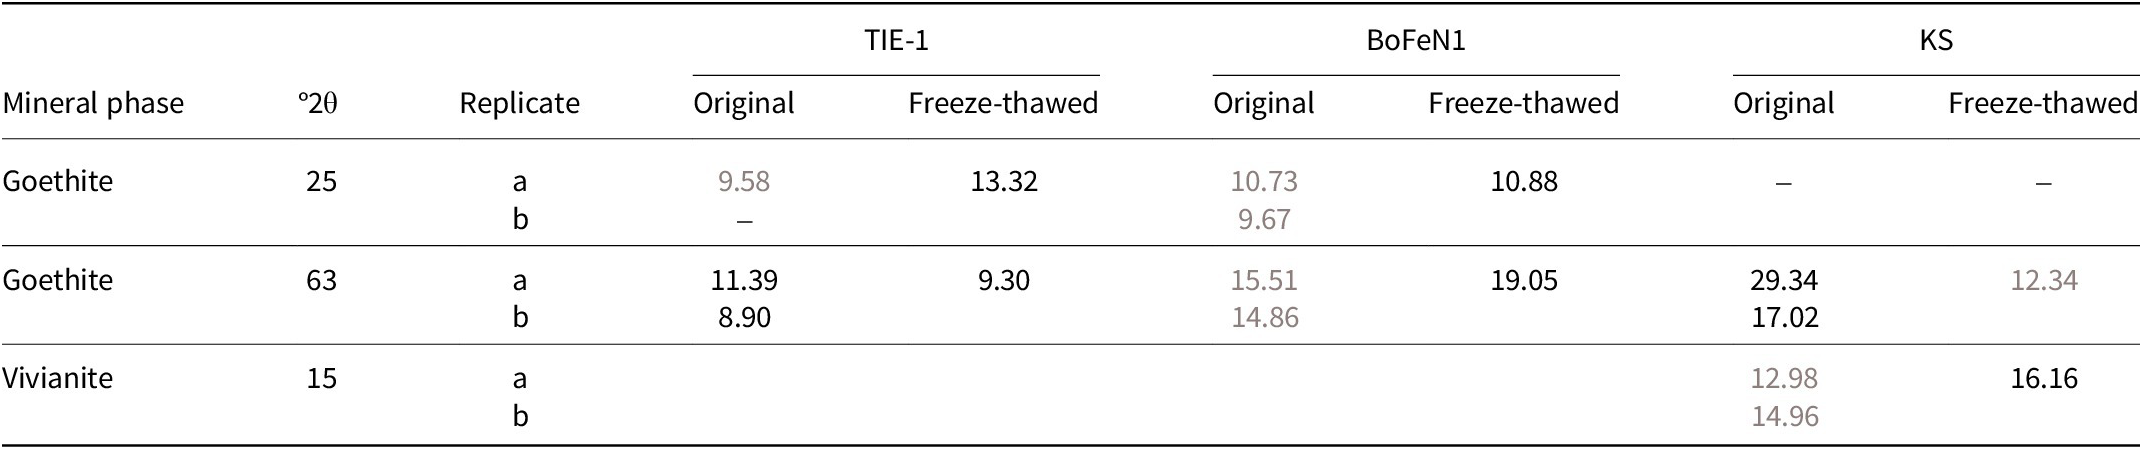
In this study, we subjected original and freeze-thawed BIOS from three different FeOB with different metabolisms to reduction by FeRB. BIOS were first characterised through a suite of analytical techniques before the reduction experiments. All BIOS consisted of a mixture of different Fe(III) oxyhydroxides with varying crystallinities. Micro-XRD indicated that goethite was the primary crystalline phase in all FeOB (Fig. S1). Vivianite was also present in KS, but its origin is abiotic because of the precipitation of Fe(II) and phosphate initially present in the medium (4 mM). Mössbauer spectroscopy showed that KS BIOS had the most complex composition with more than 50% of the minerals as ferrihydrite. In BoFeN1 and TIE-1 BIOS, poorly crystalline minerals such as ferrihydrite and lepidocrocite were together present in higher proportions than that of crystalline goethite (Figs S2, S3; Text S3; Table S1). SEM images showed an increasing degree of cell encrustation with minerals in the order of TIE-1 < KS < BoFeN1 (Fig. 1). The mineralogical assemblages and cell-mineral associations are broadly consistent with what has been observed in past studies (Texts S1 and S4). Freeze-thawing led to no changes in mineralogy (Table 1) and goethite remained the primary crystal phase in the system, in addition to vivianite in the case of KS (Fig. S1).
Crystallite size (nm) of BIOS as determined from the Scherrer equation (Eq. 1) based on µ-XRD reflection patterns.

Table 1. Long description
The table compares crystallite sizes of biogenic iron oxides (B I O S) for original and freeze-thawed samples across three cultures: T I E dash 1, BoFeN1, and K S.
Header Structure:
* Column 1: Mineral phase.
* Column 2: degrees 2 theta.
* Column 3: Replicate (a or b).
* Columns 4-5: T I E dash 1 (Original and Freeze-thawed).
* Columns 6-7: BoFeN1 (Original and Freeze-thawed).
* Columns 8-9: K S (Original and Freeze-thawed).
Data Rows:
1. Goethite at 25 degrees 2 theta:
- T I E dash 1: Original 9.58, Freeze-thawed 13.32.
- BoFeN1: Original 10.73 and 9.67, Freeze-thawed 10.88.
- K S: No data.
2. Goethite at 2 theta 63:
- T I E dash 1: Original 11.39 and 8.90, Freeze-thawed 9.30.
- BoFeN1: Original 15.51 and 14.86, Freeze-thawed 19.05.
- K S: Original 29.34 and 17.02, Freeze-thawed 12.34.
3. Vivianite at 15 degrees 2 theta:
- T I E dash 1 and BoFeN1: No data.
- K S: Original 12.98 and 14.96, Freeze-thawed 16.16.
Footnote: B I O S equals biogenic iron oxides; BoFeN1 equals Acidovorax species BoFeN1; K S equals enrichment culture K S; T I E dash 1 equals Rhodopseudomonas palustris T I E dash 1; X R D equals X-ray diffraction.
Grey values indicate lower values when comparing original vs freeze-thawed BIOS. BIOS = Biogenic iron(III) oxyhydroxides; BoFeN1 = Acidovorax sp. BoFeN1; KS = enrichment culture KS; TIE-1 = Rhodopseudomonas palustris TIE-1; XRD = X-ray diffraction.
Particle-size distribution, specific surface area and zeta potential
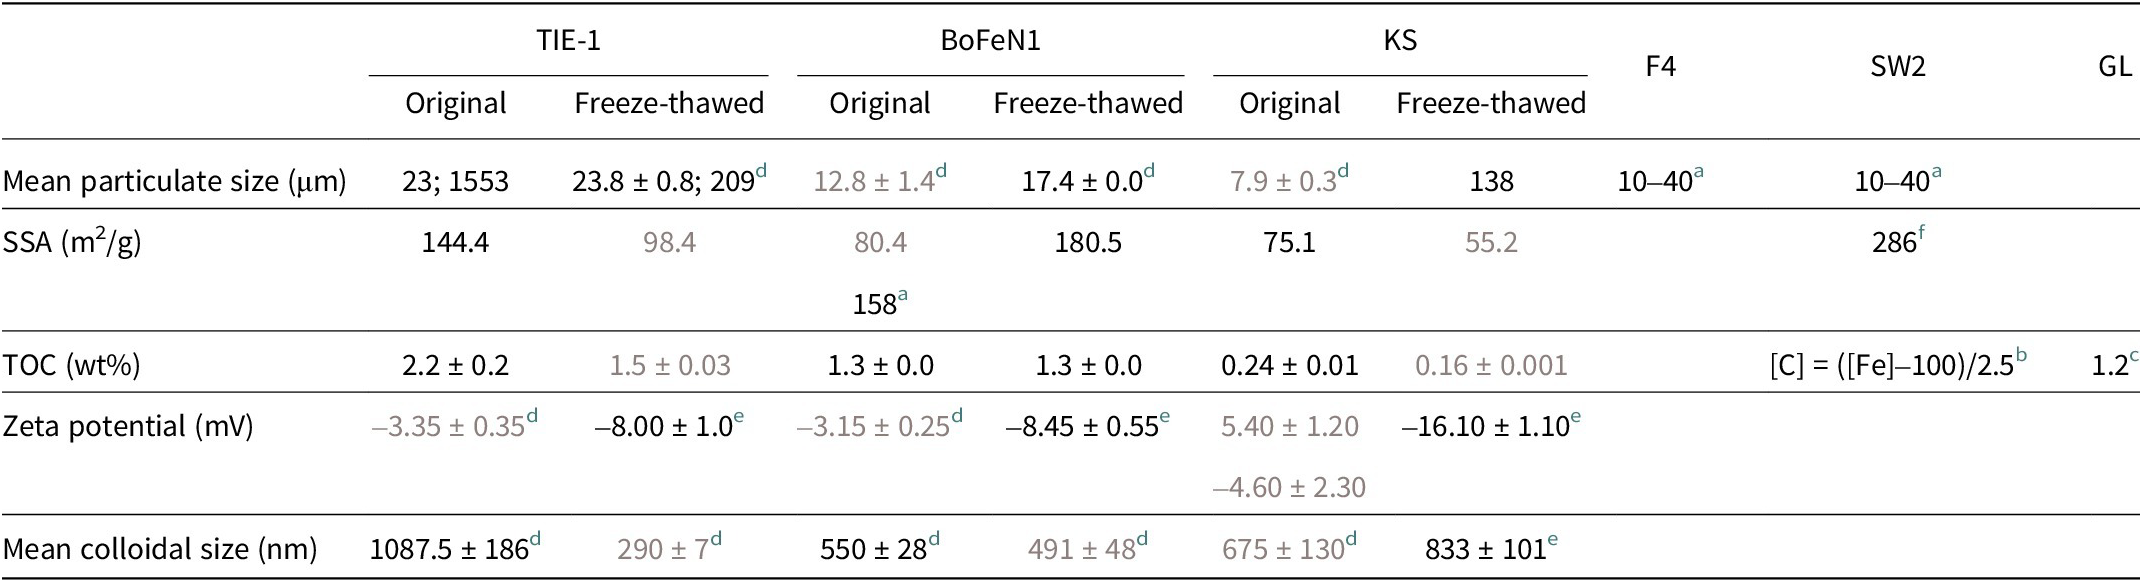
The SSA of the BIOS ranged from 75.1 to 144.4 m2 g–1, with the highest value observed for TIE-1 (Table 2). The particulate size distribution of unfiltered BIOS in this study ranged from hundreds of nanometres to a few hundred micrometres (up to ~2000 μm for TIE-1). In the case of TIE-1, we observed two size fractions, one with a mean diameter of 23 μm and another one with a mean diameter of 1553 μm (Table 2). These are larger than the values for BoFeN1 (12.8 ± 1.4 μm) and KS (7.9 ± 0.3 μm).
Mean particulate size, specific surface area (SSA), total organic carbon (TOC), zeta potential and mean colloidal size (nm) of biogenic iron oxides (BIOS), original and after freeze-thawing, with additional values from the literature for Thiodictyon sp. strain F4 (F4), R. ferrooxidans sp. strain SW2 (SW2) and Gallionella-like environmental BIOS from groundwater (GL).

Table 2. Long description
The table consists of 5 rows of data across 9 columns. The columns are grouped by strain: T I E-1 (Original and Freeze-thawed), BoFeN1 (Original and Freeze-thawed), K S (Original and Freeze-thawed), and literature values for F 4, S W 2, and G L.
* Mean particulate size in micrometers: T I E-1 ranges from 23 to 1553 (original) to 23.8 to 209 (freeze-thawed). BoFeN1 increases from 12.8 to 17.4. K S increases from 7.9 to 138. F 4 and S W 2 are listed as 10 to 40.
* S S A in meters-squared per gram: T I E-1 decreases from 144.4 to 98.4. BoFeN1 increases from 80.4 to 180.5. K S decreases from 75.1 to 55.2.
* T O C weight percent: T I E-1 decreases from 2.2 to 1.5. BoFeN1 remains stable at 1.3. K S decreases from 0.24 to 0.16. G L is 1.2.
* Zeta potential in millivolts: T I E-1 changes from minus 3.35 to minus 8.00. BoFeN1 changes from minus 3.15 to minus 8.45. K S changes from 5.40 to minus 16.10.
* Mean colloidal size in nanometers: T I E-1 decreases from 1087.5 to 290. BoFeN1 decreases from 550 to 491. K S increases from 675 to 833.
Grey values indicate the smaller absolute value when comparing original and freeze-thawed BIOS. BoFeN1 = Acidovorax sp. BoFeN1; KS = enrichment culture KS; TIE-1 = Rhodopseudomonas palustris TIE-1.
a Kappler et al. (Reference Kappler, Schink and Newman2005).
b Relationship of Fe–carbon (C) concentration in the extracellular filaments of the photoferrotroph Rhodobacter sp. strain SW2 as reported by Miot et al. (Reference Miot, Benzerara, Obst, Kappler, Hegler, Schädler, Bouchez, Guyot and Morin2009a).
c Cismasu et al. (Reference Cismasu, Williams and Nico2016).
d Replicate bottles = 2.
e Replicate bottles = 3.
f Piepenbrock et al. (Reference Piepenbrock, Schröder and Kappler2014).
We also analysed colloidal Fe(III) oxyhydroxides (fractions <1.2 μm in size), as these are typically the most reactive fractions. Ferrozine analysis showed that this fraction constituted <5% of the total Fe. The colloidal mean sizes were 1088 ± 186, 675 ± 130 and 550 ± 28 nm for TIE-1, KS and BoFeN1, respectively. Their zeta potentials were mostly negative (–1 to –5.3 mV, with one outlier at 5.4 mV), consistent with the presence of organics on the surface of the Fe(III) minerals (Table 2).
Freeze-thawing led to changes in the physiochemical parameters, resulting in consistently more negative zeta potential (–17 to –7 mV across all three FeOB). The effects on particle size and SSA were FeOB-specific. For SSA, that of BoFeN1 increased to 180.5 m2 g–1, while it decreased to 98.4 and 55.2 m2 g–1 in TIE-1 and KS, respectively. For particulate size distribution of unfiltered samples, the mean size of the smaller size group of TIE-1 BIOS remained unchanged, but the larger aggregates (1553 μm) decreased to an average size of 209 μm. Meanwhile, the mean size of both BoFeN1 and KS particulates increased to 17.4 ± 0.0 and 138 μm, respectively (Fig. S4). Finally, the colloidal size distribution decreased after freeze-thawing for TIE-1 (290 ± 7 nm) and KS (833 ± 101 nm), while it increased for BoFeN1 (491 ± 48 nm).
Carbon content in the solid phase
The TOC in the solid-phase fraction of BIOS – corresponding to EPS and cells remaining after washing – is reported in Table 2. TIE-1 has the highest TOC (2.2%), followed by BoFeN1 (1.3%) and KS (0.24%). In our study, we found that freeze-thawing decreased significantly (n = 3 for original, n = 2 for freeze-thawed, α = 0.05) the TOC in the BIOS of TIE-1 to 1.5% and KS to 0.16%, while TOC in the BIOS of BoFeN1 remained unchanged (1.3%). Because of the low concentration of TOC across all setups, the characteristic bacterial Fourier transform infrared spectrum was overwhelmed by bands that can be attributed to Fe(III) minerals (data not shown).
BIOS as electron donor and acceptor
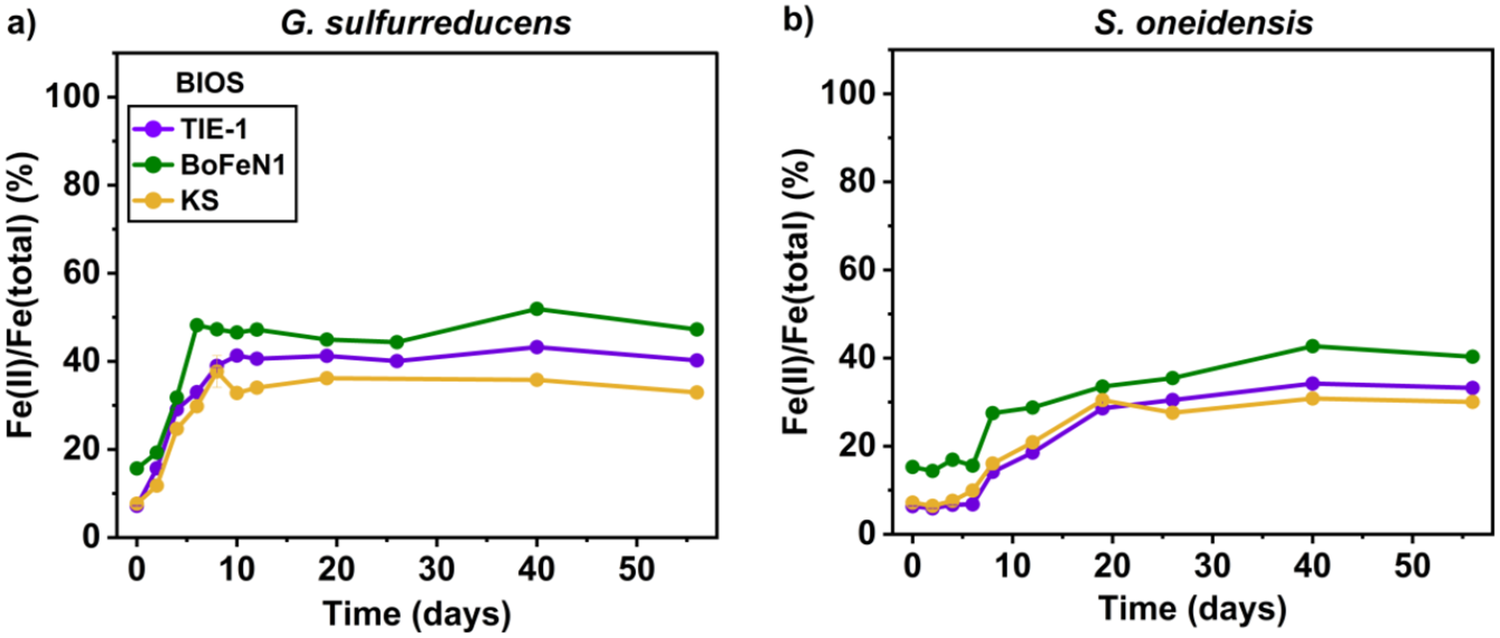
We incubated the FeRB, S. oneidensis and G. sulfurreducens without the addition of bioavailable OC sources to test the bioavailability of BIOS as both electron donor and acceptor. In the negative controls, the Fe(II)/Fe(total) ratio remained at 6.9 ± 2.3%, 15.4 ± 4.9% and 9.9 ± 4.5% with original BIOS of TIE-1, BoFeN1 and KS, respectively. At the end of the reduction experiment, the Fe(II)/Fe(total) ratio reached a maximum of 52% (Fig. 2). BoFeN1 BIOS were the most bioavailable, with a higher Fe(III) reduction extent with both FeRB, followed by TIE-1 and finally KS. BIOS of BoFeN1, TIE-1 and KS were reduced to 52%, 44% and 36% by G. sulfurreducens, respectively; and up to 43%, 34% and 31% for BIOS of BoFeN1, TIE-1 and KS by S. oneidensis, respectively (Table S2). In the setup with G. sulfurreducens, the maximum extent was reached within 10 days, at a rate of 0.16, 0.41 and 0.23 mM Fe (II) day–1 for BIOS of TIE-1, BoFeN1 and KS, respectively (Fig. 2a; Table S2). S. oneidensis reduced BIOSFe(III) in 40 days, with a lower rate of 0.09, 0.05 and 0.08 mM Fe(II) day–1 for BIOS of TIE-1, BoFeN1 and KS, respectively (Fig. 2b; Table S2). Note, however, that despite the absence of additional OC in the setups, the preculture carried leftover OC (e. g. acetate, lactate) that probably served as an electron donor (see Discussion, section Bioavailable OC controls the extent of BIOS Fe(III) reduction).
Fe(II)/Fe(total) ratio of the reduction of ~6 mM BIOSFe(III) by (a) G. sulfurreducens and (b) S. oneidensis without additional acetate or lactate. Data shown are the mean of experimental triplicates; error bars that indicate the standard deviations (n = 3) are smaller than the symbols in the figures.

Figure 2. Long description
Two side-by-side line graphs labeled a and b. Both share identical axes. The x-axis represents Time in days from 0 to 55. The y-axis represents the ratio of F e (II) all over F e (total) as a percentage from 0 to 100. Each graph contains three data series: T I E-1 (purple circles), B o F e N 1 (green circles), and K S (yellow circles).
Panel a, G. sulfurreducens: All three series show a rapid increase in the first 10 days. B o F e N 1 peaks highest at approximately 50 percent, while T I E-1 and K S reach approximately 40 percent and 35 percent respectively. After day 10, all three series plateau with minor fluctuations, maintaining their relative vertical order: B o F e N 1 highest, followed by T I E-1, and K S lowest.
Panel b, S. oneidensis: The initial increase is slower compared to panel a. Values remain below 20 percent for the first 8 days. Between days 10 and 20, there is a steady rise. By day 40, B o F e N 1 reaches a peak of approximately 42 percent, T I E-1 reaches approximately 35 percent, and K S reaches approximately 30 percent. All three series remain relatively stable from day 40 to day 55.
Fe(III) reduction in the presence of available electron donors
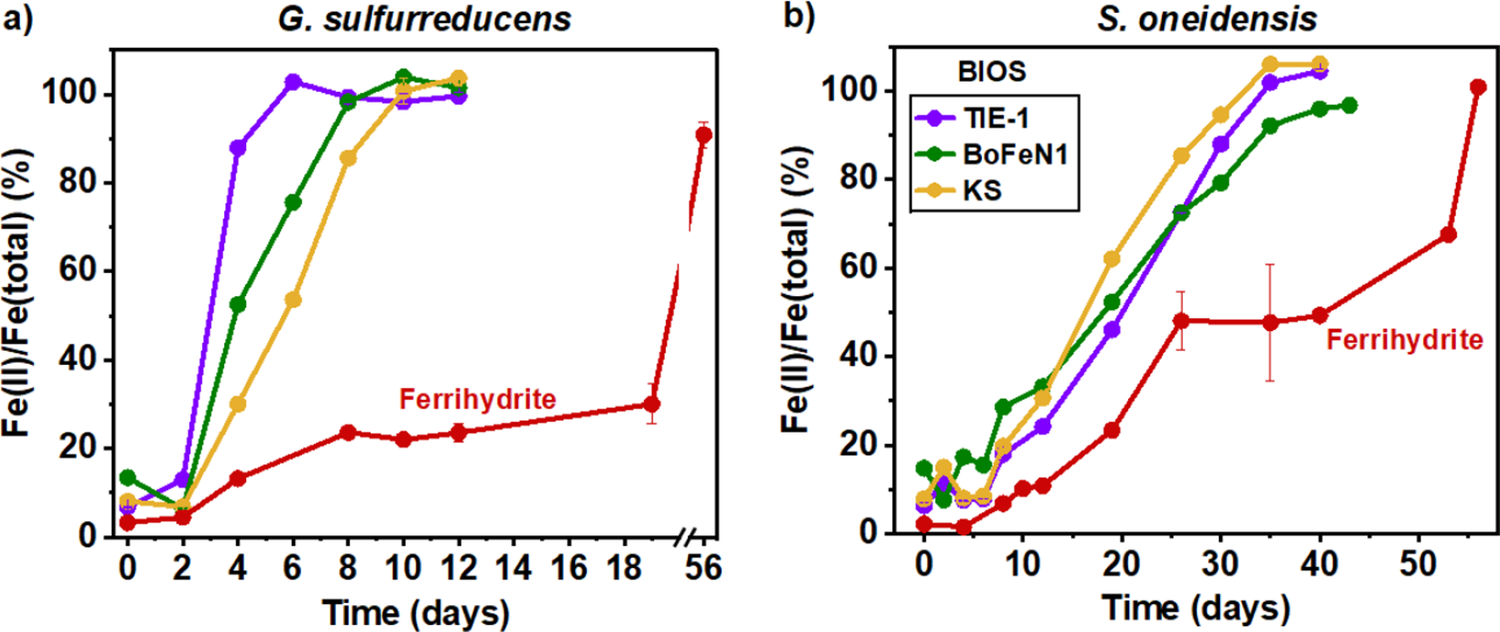
To investigate if OC was the factor limiting BIOSFe(III) reduction, 5 mM lactate or acetate were introduced into the setups as electron donors for S. oneidensis and G. sulfurreducens, respectively. In the negative control with lactate, the Fe(II)/Fe(total) ratios of original BIOS of TIE-1, BoFeN1 and KS remained at 6.3 ± 1.8%, 15.6 ± 4.9% and 7.3 ± 1.9%, respectively. In the negative control with acetate, the Fe(II)/Fe(total) ratios of BIOS of TIE-1, BoFeN1 and KS remained at 6.8 ± 1.1%, 18.3 ± 4.0% and 8.0 ± 2.9%, respectively. Both strains were able to reduce 100% of the BIOSFe(III) in all cases. G. sulfurreducens reduced the BIOS significantly (n = 3, α = 0.05) faster than S. oneidensis, reducing them within 10 days with rates of 0.72, 0.69 and 0.44 mM Fe (III) day–1 for TIE-1, BoFeN1 and KS BIOS, respectively (Fig. 3a; Table S3). S. oneidensis took longer to reduce the BIOSFe(III) (within 40 days) with rates of 0.13, 0.12 and 0.15 mM Fe(III) day–1 for TIE-1, BoFeN1 and KS BIOS, respectively (Fig. 3b; Table S3). In these setups, we also performed additional incubations with synthetic ferrihydrite as the Fe(III) source. For both FeRB, we observed a much slower reduction rate of ferrihydrite relative to the BIOS, and similar between the FeRB, 0.07 ± 0.01 and 0.08 ± 0.00 mM Fe(III) day–1 with G. sulfurreducens and S. oneidensis, respectively (Fig. 3; Table S3).
Fe(II)/Fe(total) ratio of the reduction of ~6 mM BIOSFe(III) (mixture of ferrihydrite, goethite and lepidocrocite) and synthetic two-line ferrihydrite by (a) G. sulfurreducens and (b) S. oneidensis in the presence of 5 mM of acetate or lactate, respectively. Shown are the means of experimental triplicates for BIOS and duplicates for ferrihydrite; error bars (in most cases smaller than and hidden by the symbols) indicate the standard deviation (n = 3).

Figure 3. Long description
Two line graphs, labeled a and b, share identical axes. The x-axis represents Time in days from 0 to 56. The y-axis represents the F e (I I) forward slash F e (total) ratio as a percentage from 0 to 100.
Panel a, titled G. sulfurreducens, shows four data series. Three B I O S samples (T I E - 1 in purple, B o F e N 1 in green, and K S in yellow) show rapid sigmoidal increases. T I E - 1 reaches 100 percent by day 6. B o F e N 1 reaches 100 percent by day 10. K S reaches 100 percent by day 12. The Ferrihydrite series in red shows a much slower, staggered increase, reaching only 30 percent by day 19, with a break in the x-axis before jumping to 90 percent at day 56.
Panel b, titled S. oneidensis, shows a similar but slower trend for B I O S samples. K S in yellow is the fastest, reaching 100 percent by day 35. T I E - 1 in purple reaches 100 percent by day 35. B o F e N 1 in green reaches approximately 95 percent by day 43. The Ferrihydrite series in red shows a plateau around 50 percent between days 26 and 40, before rising to 100 percent by day 56. Error bars are visible on the red Ferrihydrite line in panel b at day 35.
Effect of freeze-thawing on Fe(III) reduction
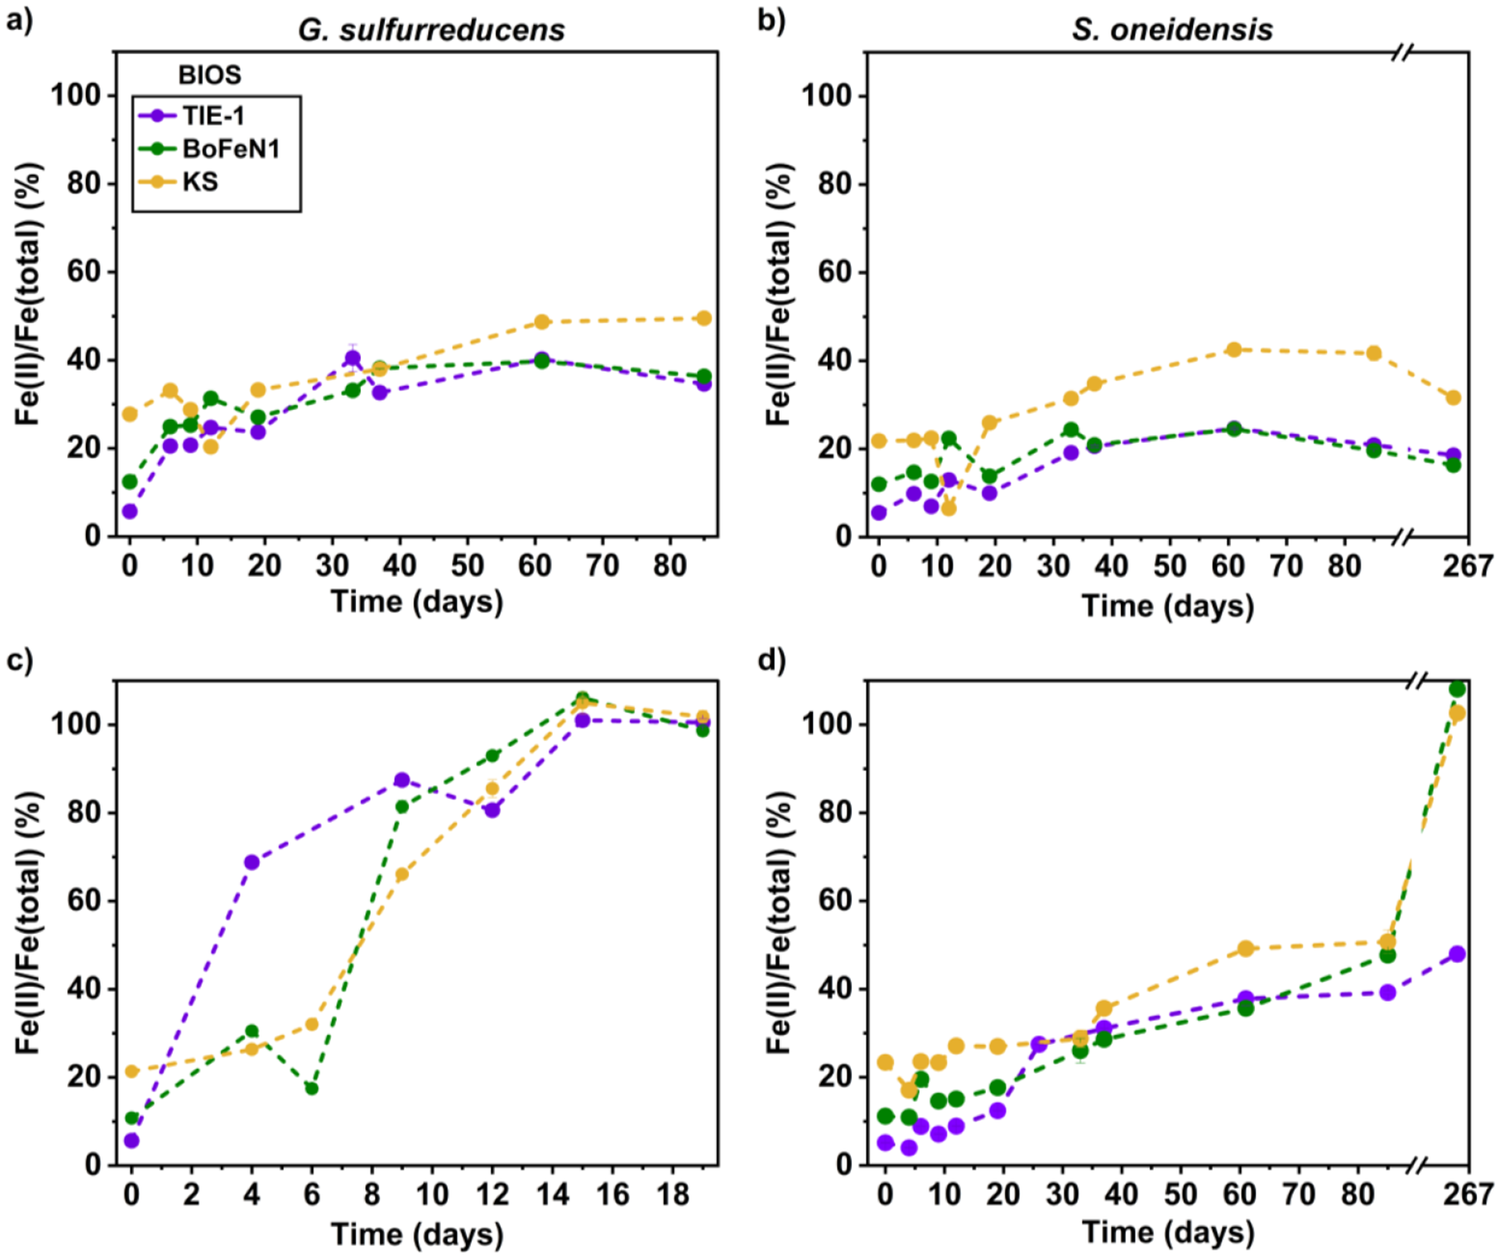
We tested the impact of freeze-thawing on the bioavailability of BIOS. The results showed that the Fe(II)/Fe(total) ratio in negative controls remained 9.4 ± 4.0%, 15.6 ± 9.1% and 28.3 ± 8.6% with freeze-thawed BIOS of TIE-1, BoFeN1 and KS, respectively, without any additional electron donor. G. sulfurreducens reached maximum BIOSFe(III) reduction extents of 49%, 40% and 40% for BIOS of KS, BoFeN1 and TIE-1, respectively (Table S2), within 61 days (Fig. 4a). Within the same period, S. oneidensis reached maximum BIOSFe(III) reduction extents of 43%, 25% and 25% for BIOS of KS, BoFeN1 and TIE-1, respectively (Fig. 4b). In all setups, the Fe(III) reduction rates between the two FeRB were statistically different (n = 3, α = 0.05). G. sulfurreducens was faster at reducing BIOSFe(III) from TIE-1, BoFeN1 and KS at 0.09 ± 0.02, 0.06 ± 0.01 and 0.29 ± 0.06 mM Fe(III) day–1, respectively, while S. oneidensis reduced them at 0.03 ± 0.01, 0.04 ± 0.02 and 0.24 ± 0.06 mM Fe(III) day–1, respectively (Table S3).
Fe(II)/Fe(total) ratio of freeze-thawed BIOSFe(III) reduction by (a) G. sulfurreducens and (b) S. oneidensis without additional carbon and in the presence of 5 mM of acetate and lactate for (c) G. sulfurreducens and (d) S. oneidensis, respectively. Data shown are the mean of experimental triplicates for BIOS and error bars (in most cases hidden by the symbols) indicate the standard deviation.

Figure 4. Long description
A multi-panel figure with four line graphs labeled a through d. All graphs share a Y-axis of F e (II) all over F e (total) percentage ranging from 0 to 100 or 110. The X-axis is Time in days. Three data series are present in each: T I E-1 (purple circles), B o F e N 1 (green circles), and K S (yellow circles).
* Panel a: G. sulfurreducens without carbon. Time 0 to 85 days. All three series show a gradual increase from approximately 10 to 30 percent at day 0 to between 35 and 50 percent by day 85. K S reaches the highest value.
* Panel b: S. oneidensis without carbon. Time 0 to 267 days with an axis break after 85. Trends are similar to panel a but lower, peaking between 20 and 45 percent. K S remains the highest.
* Panel c: G. sulfurreducens with acetate and lactate. Time 0 to 19 days. All series show a rapid, steep increase. T I E-1 reaches 100 percent by day 15. B o F e N 1 and K S reach approximately 100 percent by day 15 to 19.
* Panel d: S. oneidensis with acetate and lactate. Time 0 to 267 days with an axis break. There is a slow increase up to day 85 (reaching 40 to 50 percent), followed by a sharp spike for B o F e N 1 and K S to near 110 percent at day 267, while T I E-1 remains below 50 percent.
With additional acetate, the Fe(II)/Fe(total) ratios in negative controls remained at 9.1 ± 4.0, 16.6 ± 8.2 and 27.4 ± 5.1% Fe(II) with freeze-thawed BIOS of TIE-1, BoFeN1 and KS, respectively. G. sulfurreducens reduced 100% of the freeze-thawed BIOSFe(III) in 15 days (Fig. 4c). With lactate, the Fe(II)/Fe(total) ratios in negative controls remained at 9.4 ± 4.4, 16.4 ± 7.3 and 29.4 ± 8.9% with freeze-thawed BIOS of TIE-1, BoFeN1 and KS, respectively. Despite the addition of lactate, after 85 days S. oneidensis showed reduction extents of only 51%, 48% and 39% for BIOS of KS, BoFeN1 and TIE-1, respectively. After 267 days, an additional sampling showed that KS and BoFeN1 BIOS had been fully reduced by S. oneidensis, while TIE-1 BIOS only had a maximum reduction extent of 48% (Fig. 4d).
When comparing to untreated BIOS, freeze-thawing tended to decrease the BIOSFe(III) reduction rates (three out of six conditions) and extents (four out of six cases) in the absence of added OC. In the presence of added OC, the reduction rates tended to be lower (five out of six conditions) while the extents tended to be comparable due to the reaction reaching completion (five out of six conditions) (Tables S2, S3). The overall decrease in reduction rates ranged from 1.5- to 10-fold lower compared to untreated BIOS. The overall decrease in reduction extent typically ranged from 10% to 20% compared to untreated BIOS, with one outlier exhibiting a 52% decrease (Tables S2, S3, S4).
Discussion
Properties of BIOS compared to the literature
Fe(III) (oxyhydr)oxides are important sinks and sources of biogeochemically important nutrients. They are known carbon sinks, trapping a substantial amount of OC in terrestrial (~40%) and marine (~19%) sediments (Jia et al., Reference Jia, Li, Guo and Xie2024; Lalonde et al., Reference Lalonde, Mucci, Ouellet and Gélinas2012). Extensive work has been done to study the mineral composition of BIOS and their biomineralisation patterns, particularly on the phenomenon of encrustation that occurs in some nitrate-reducing Fe(II)-oxidising bacteria (Fig. 1). Despite this, information on their basic properties (e. g. surface areas, zeta potential, particle size distribution, TOC) is lacking. Our work adds to this incomplete body of literature and allows comparison with previous datasets.
The SSA of BIOS has been determined to range from 158 to 286 m2 g–1 (Kappler et al., Reference Kappler, Schink and Newman2005; Piepenbrock et al., Reference Piepenbrock, Schröder and Kappler2014). We measured SSA with a range of 75–144 m2 g–1 for three types of BIOS, with a value of 80 m2 g–1 specifically for BoFeN1. While the SSA values are generally high and reflect their poorly crystalline nature (Song et al., Reference Song, Wang, Van Zwieten, Bolan, Wang, Li, Cheng, Yang, Wang, Liu and Li2022), it seems that differences in growth conditions or culture batch could yield variation in SSA of BIOS from the same species (Table 2).
TIE-1 displayed the highest TOC (2.2 wt%), followed by BoFeN1 (1.3%) and KS (0.24%). TIE-1 is a photoferrotroph, which are known to secrete EPS to prevent encrustation (Wu et al., Reference Wu, Swanner, Hao, Zeitvogel, Obst, Pan and Kappler2014). In BoFeN1, cells are typically encrusted with Fe(III) oxyhydroxides, resulting in tight OC association within BIOS (Kappler et al., Reference Kappler, Schink and Newman2005; Schmid et al., Reference Schmid, Zeitvogel, Hao, Ingino, Floetenmeyer, Stierhof, Schroeppel, Burkhardt, Kappler and Obst2014). Finally, culture KS is an autotrophic nitrate-reducing Fe(II)-oxidising co-culture, in which any OC needs to be sourced from energetically expensive fixation of CO2. Hence, patterns in the TOC content are broadly consistent with their metabolisms. In comparison to the literature, the Fe–C content within the extracellular filaments of the photoferrotroph Rhodobacter sp. strain SW2 was determined to follow the relationship [Fe] = 2.5[C] + 100 (Miot et al., Reference Miot, Benzerara, Obst, Kappler, Hegler, Schädler, Bouchez, Guyot and Morin2009a), while ~1.2% TOC was determined in Gallionella-like BIOS from groundwater (Cismasu et al., Reference Cismasu, Williams and Nico2016) (Table 2).
In this study, we measured the particle-size distribution of BIOS in suspension using a Mastersizer and a Zetasizer, revealing a broad distribution from hundreds of nanometres to a few hundred micrometers (up to ~2000 μm for TIE-1). Previous studies have used electron microscopy to estimate the size of cell-mineral aggregates in FeOB, showing that individual particles are typically <1000 nm (Huang et al., Reference Huang, Mellage, Garcia, Glöckler, Mahler, Elsner, Jakus, Mansor, Jiang and Kappler2023; Jiao et al., Reference Jiao, Kappler, Croal and Newman2005). Hence, the large size ranges we measured signify the formation of aggregates composed of minerals, cells and/or EPS in suspension. Here, the mean aggregate size for the three investigated cultures was TIE-1 > BoFeN1 > KS. The larger aggregates in TIE-1 could be induced by EPS that act as binding agents, produced by the cells to prevent cell encrustation by minerals (Wu et al., Reference Wu, Swanner, Hao, Zeitvogel, Obst, Pan and Kappler2014). In comparison, other photoferrotrophs (Thiodictyon sp. F4 and Rhodobacter ferrooxidans sp. strain SW2) also produced relatively large BIOS with a size range of 10–40 μm (as measured on a Mastersizer; Posth et al., Reference Posth, Huelin, Konhauser and Kappler2010) that were larger than those of BoFeN1 (mean = 11–14 μm) and KS (mean = 8 μm).
The particle-size analysis performed here also showed conclusively the presence of colloids <1200 nm in suspension, although their amount was <5% of the total Fe. These colloids have a size range of 550–1100 nm, dependent on the BIOS source and the exact culture bottle. The zeta potential for these colloids was predominantly negative, ranging from –1.0 to –5.3 mV, with one positive value for KS at +5.4 mV. These values reflect the influence of negatively charged OC on the surfaces of BIOS from deprotonated functional groups like carboxyl and phosphate groups (Ciempiel et al., Reference Ciempiel, Czemierska, Wiącek, Szymańska, Jarosz-Wilkołazka and Krzemińska2025; Huang et al., Reference Huang, Jin, Zhou, Liu, Huang, Zhao and Chen2022), as at pH 7 the zeta potential of Fe(III) (oxyhydr)oxides should be close to 0 or positive, given their point of zero charges of 7–9 (Venema et al., Reference Venema, Hiemstra and van Riemsdijk1996; Mansor et al., Reference Mansor, Duverger, Pasquier, Gorlas, Guyot, Berg, Marine-Carbonne, Cosmidis and Picard2025; Kosmulski, Reference Kosmulski2009). Overall, colloids from BIOS are present at low concentrations and tend to be negatively charged.
Disentangling factors controlling the BIOSFe(III) reduction rate and extent
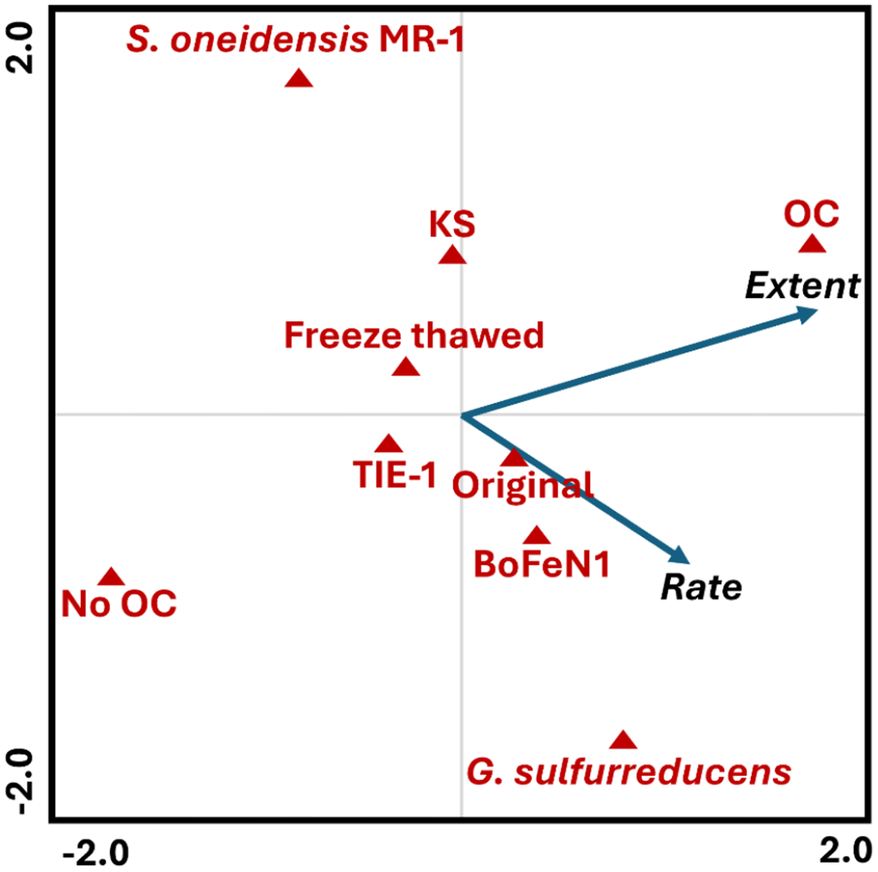
Following characterisation, we tested the bioavailability of BIOS for microbial Fe(III) reduction across multiple variables relevant to natural environments, resulting in a total of 24 conditions (Table S4). We therefore performed a redundancy analysis to identify the most important parameters controlling the extent and rate of BIOSFe(III) reduction (Fig. 5). The analysis showed that OC addition was the main factor influencing the extent of reduction. In comparison, the rate was primarily controlled by the FeRB species, with G. sulfurreducens being faster than S. oneidensis both with and without OC. Among the BIOS sources, BoFeN1 showed the highest reduction rates, both with and without OC. Finally, freeze-thawing tended to decrease the reduction rates without affecting the extent of reduction. Below, we discuss the potential mechanisms based on these trends in more detail.
Redundancy analysis to determine the factors affecting the rate and extent of microbial biogenic iron oxides (BIOS) reduction. The factors evaluated were the origin of the BIOS (Rhodopseudomonas palustris TIE-1 (TIE-1), Acidovorax sp. BoFeN1 (BoFeN1), enrichment culture KS (KS)), the Fe(III)-reducing bacteria species (G. sulfurreducens, S. oneidensis), usage of additional carbon (organic carbon (OC), no OC) and BIOS treatment (original, freeze-thawed). Blue arrows are the response variables (rate and extent) and red triangles are the predictor variables. A list with the complete set of samples can be found in Table S4 and Fig. S5 displays the results including the individual samples.

Figure 5. Long description
A scatter plot with a horizontal axis ranging from minus 2.0 to 2.0 and a vertical axis ranging from negative 2.0 to 2.0. Two blue arrows originate from the center point 0,0. The first arrow points towards the top-right quadrant labeled Extent. The second arrow points towards the bottom-right quadrant labeled Rate. Red triangles representing predictor variables are distributed as follows. In the top-left quadrant is S. oneidensis M R 1. Near the vertical center line in the upper half are K S and Freeze thawed. In the top-right quadrant is O C, positioned near the tip of the Extent arrow. In the bottom-left quadrant is No O C. Near the center point are T I E 1 and Original. In the bottom-right quadrant are BoFeN1 and G. sulfurreducens, with BoFeN1 located near the Rate arrow.
Comparison of the bioavailability of BIOS with different origins and synthetic ferrihydrite
Overall, the source of the original BIOS contributed to small differences in Fe(III) reduction rates and <10% differences in reduction extent. BIOSFe(III) from BoFeN1 were the most bioavailable, followed by TIE-1 and KS. The reason(s) for these differences are unclear, as they seem to be uncorrelated with their mineralogy, particle size, TOC, SSA and zeta potential (Table 2).
Compared to synthetic ferrihydrite (used due to its greater reactivity compared with other Fe(III) (oxyhydr)oxides; Han et al., Reference Han, Liu, Li, Li, Chen and Wu2018; Glasauer et al., Reference Glasauer, Weidler, Langley and Beveridge2003; Lovley and Phillips, Reference Lovley and Phillips1986), the Fe(III) in all BIOS used here was more reactive and had higher reduction rates (8–13 and 1.5–5 times with G. sulfurreducens and S. oneidensis, respectively; Table S3). We attribute this greater availability to the presence of OC within BIOS. The generally negative zeta potential of the BIOS suggests the presence of organic molecules on the mineral surfaces. These organics may contain redox-active species that facilitate electron transfer between the cells and the minerals. Moreover, the presence of OC could shift the redox potential towards greater reducibility. Similar interpretations have been made in the past in relation to Fe–OC coprecipitates that showed higher reduction rates and extents compared to synthetic Fe(III) (oxyhydr)oxides (Mikutta, Reference Mikutta2011; Poggenburg et al., Reference Poggenburg, Mikutta, Sander, Schippers, Marchanka, Dohrmann and Guggenberger2016).
We also considered two additional factors: mineralogy and surface areas. Mineralogy-wise, because BIOS contained goethite, we would expect it should have a lower bioavailability compared to synthetic ferrihydrite. Similarly, as ferrihydrite typically has a very large surface area (>200–400 m2 g–1; He et al., Reference He, Zhang, Diao, Sun, Zhang, Zhao, Wen and Yang2025; Macera et al., Reference Macera, Taglieri, Daniele, Passacantando and D’Orazio2020; Brinza, Reference Brinza2022), we would expect BIOS to be less bioavailable compared to ferrihydrite. Hence, it seems that despite these factors, the presence of redox-active species covering the minerals in BIOS results in a stronger effect with higher reduction rates. This concurs with the previously demonstrated greater bioavailability of BIOSFe(III) from environmental samples compared to ferrihydrite, with BIOS being reduced 1.5–3 times more quickly than ferrihydrite (Langley et al., Reference Langley, Gault, Ibrahim, Renaud, Fortin, Clark and Ferris2009a). Our results conclusively show the high bioavailability of BIOS for microbial Fe(III) reduction. They further highlight the importance of using environmentally relevant materials such as BIOS instead of purely synthetic minerals to derive reduction rates and extents relevant to nature.
Bioavailable OC controls the extent of BIOSFe(III) reduction
In setups where G. sulfurreducens and S. oneidensis were incubated with only BIOS, BIOSFe(III) reduction was incomplete, with a maximum extent of 52% (of ~6 mM Fe(III)) across all BIOS. The BIOSFe(III) reduction in these setups is attributed to the small yet present OC transferred from the precultures. In the case of G. sulfurreducens, because of the absence of washing, ~0.17 mM of acetate could be transferred from the preculture, enough to reduce ~1.36 mM of Fe, which is consistent with the ~2.0 mM of Fe(II) produced (Eq. 2) (considering this includes ~0.61 mM of initial Fe(II)). Likewise, S. oneidensis may contain ~1 mM of lactate coming from the preculture, enough to reduce 4 mM of Fe, which is higher than the ~1.9 mM of Fe(II) produced (Eq. 3).


When incubation was performed in the presence of excess of electron donor by adding acetate/lactate, all the BIOSFe(III) was reduced (Fig. 3), which confirms the high bioavailability of BIOSFe(III). This result also highlights the limited bioavailability of BIOS-associated organic carbon (BIOSOC) to G. sulfurreducens and S. oneidensis. BIOSOC could have been inaccessible because of the complexity of the organic molecules, strong chemical bonding between Fe and C, or physical inhibition by the Fe(III) oxyhydroxides. In fact, neither of the FeRB is known to degrade high-molecular-weight molecules, apart from reducing disulfide bonds in organic matter (Phan et al., Reference Phan, Macwan, Gralnick and Yee2024; Voordeckers et al., Reference Voordeckers, Kim, Izallalen and Lovley2010). In the presence of EPS – a main component of BIOSOC – Fe(III) oxyhydroxides displayed lower reduction rates than with natural organic matter (Cooper et al., Reference Cooper, Eusterhues, Wegner, Totsche and Küsel2017; Gao et al., Reference Gao, Lu, Liu, Li, Li, Song, Wang, Zhang and Zhu2019; Poggenburg et al., Reference Poggenburg, Mikutta, Schippers, Dohrmann and Guggenberger2018). Furthermore, as a result of aggregation, OC could be trapped within aggregate pores, making it less accessible to degradation. These combined factors contribute to limited bioavailability of BIOSOC to the two model FeRB species we tested here. The bioavailability of BIOSOC to other FeRB and microbial species (e. g. fermenters) remains an open question.
FeRB-specific differences in BIOSFe(III) reduction
Intriguingly, G. sulfurreducens generally displayed higher BIOSFe(III) reduction rates compared to S. oneidensis. We considered two factors to account for this difference. First, as the initial cell numbers were the same (~105 cells mL–1), differences in the Fe(III) reduction rate cannot be explained by this parameter and suggest that G. sulfurreducens has a faster cell-specific reduction rate. However, we did not track differences in cell numbers as the incubation proceeded. Second, we considered differences in reduction mechanisms between the two FeRB. G. sulfurreducens preferentially reduces Fe(III) via direct cell-mineral contact, aided by electron transfer via conductive pili (Ueki, Reference Ueki2021). In contrast, S. oneidensis preferentially uses electron shuttles (e. g. quinone moieties), which are known to enhance the reduction of Fe(III) and allow longer electron transfer distances to the terminal electron acceptor (Chen et al., Reference Chen, Wang, Jiang, Fu, Xia, Wang, Dong and Li2017; Lovley and Blunt-Harris, Reference Lovley and Blunt-Harris1999; Meng et al., Reference Meng, Zhao, Burgos, Li, Zhang, Wang, Liu, Sun, Lin and Luan2018). In the absence of added electron shuttles, S. oneidensis typically needs time in the order of 48–50 h to synthesise their own electron shuttles (e. g. flavins) (Marsili et al., Reference Marsili, Baron, Shikhare, Coursolle, Gralnick and Bond2008; Von Canstein et al., Reference Von Canstein, Ogawa, Shimizu and Lloyd2008) or to adapt to a direct contact mechanism (Kotloski and Gralnick, Reference Kotloski and Gralnick2013; Lies et al., Reference Lies, Hernandez, Kappler, Mielke, Gralnick and Newman2005), which may explain their longer lag phase compared to G. sulfurreducens in our setups.
Previous experiments have shown differing Fe(III) reduction rates of Fe–OC coprecipitates by Shewanella and Geobacter species, depending on the C/Fe ratio. Increasing C/Fe ratios led to faster Fe(III) reduction for Shewanella, attributed to the presence of quinone-containing molecules acting as electron shuttles. In contrast, increasing C/Fe ratios led to slower Fe(III) reduction for Geobacter, attributed to a surface passivation effect that prevents Geobacter from attacking mineral surfaces (Cooper et al., Reference Cooper, Eusterhues, Wegner, Totsche and Küsel2017). Thus, organic matter can influence the Fe(III) reduction rate of different FeRB species. In comparison to our experiment, two observations are important. First, the molar C/Fe ratios of 0.02, 0.10 and 0.17 for BIOS of KS, BoFeN1 and TIE-1, respectively, are at the low end of those observed for Fe–OC coprecipitates. Even at these low C/Fe ratios, a significant enhancement of reduction was observed for both Geobacter and Shewanella compared to ferrihydrite, attributed to the presence of redox-active species that enhanced electron transfer between cells and minerals (Martinez and Alvarez, Reference Martinez and Alvarez2018; Poggenburg et al., Reference Poggenburg, Mikutta, Sander, Schippers, Marchanka, Dohrmann and Guggenberger2016). Second, at comparable C/Fe ratios, the Fe(III) reduction rates for Geobacter were always faster than for S. oneidensis (Cooper et al., Reference Cooper, Eusterhues, Wegner, Totsche and Küsel2017; Eusterhues et al., Reference Eusterhues, Hädrich, Neidhardt, Küsel, Keller, Jandt and Totsche2014a, Reference Eusterhues, Neidhardt, Hädrich, Küsel and Totsche2014b; Lovley, Reference Lovley1991). Our results are therefore consistent with previous studies and further highlight the higher Fe(III) reduction rates of Geobacter compared to Shewanella species.
Effect of freeze-thawing on the properties of BIOS
Freeze-thawing is a process relevant to high-latitude zones, mountain glaciers and other temperate climate regions across Earth (Hayashi, Reference Hayashi2013). As Fe-cycling bacteria are active in these environments, it is imperative to understand the effects of freeze-thawing on the properties and bioavailability of BIOS (Nixon et al., Reference Nixon, Telling, Wadham and Cockell2017; Laufer-Meiser et al., Reference Laufer-Meiser, Michaud, Maisch, Byrne, Kappler, Patterson, Røy and Jørgensen2021; Michaud et al., Reference Michaud, Massé and Emerson2023; Toubes‐Rodrigo et al., Reference Toubes-Rodrigo, Potgieter-Vermaak, Sen, Oddsdóttir, Elliott and Cook2021). We found the effect of freeze-thawing to be complex and dependent on multiple parameters. For example, freeze-thawing consistently decreased the surface charges of colloidal BIOS regardless of origin. We speculate that this is due to the breakdown of complex organic molecules (e. g. cells and EPS) during freezing (Fellman et al., Reference Fellman, D’Amore and Hood2008; Pokrovsky et al., Reference Pokrovsky, Karlsson and Giesler2018) followed by their migration to the outer surface of the BIOS aggregates on thawing (Gu et al., Reference Gu, Schmitt, Chen, Liang and McCarthy1995). This process did not lead to changes in the TOC of BIOS of BoFeN1, while significantly (α = 0.05, n = 3) decreasing the TOC content of TIE-1 and KS BIOS.
Freezing probably led to changes in the BIOS structure, as inferred from changes in SSA and particle-size distribution. In the case of TIE-1, the decrease in SSA and particle size indicated freezing-induced compaction. For BoFeN1, the increases in SSA and particle size were more consistent with aggregation into an open structure with high accessibility to reactive sites. In the case of KS, the decrease in SSA coupled with an increase in particle size distribution implied aggregation to larger structures with limited access to reactive surfaces. We note, however, that these are only interpretations, as the Mastersizer and Zetasizer only measure the hydrodynamic diameter, i. e. it assumes a hypothetical hard sphere in solution, including its surface structure and solvation layer, without giving insight into the three-dimensional arrangement of the BIOS after freeze-thawing.
Lastly, freezing did not cause a change in mineralogy nor a large difference in crystallinity of the BIOS. Freeze-thawing also potentially caused a slight increase from a Fe(II)/Fe(total) ratio of 6.9 ± 0.6%, 13.4 ± 0.3% and 27.1 ± 0.5% to 9.3 ± 4.2%, 16.6 ± 7.8% and 28.2 ± 7.5% for BIOS of TIE-1, BoFeN1 and KS, respectively, although the values still overlap if we consider the high standard deviations.
Effect of freeze-thawing on the bioavailability of BIOS
In general, freeze-thawing tended to decrease the bioavailability of BIOSFe(III), although the effect is specific to the variables tested. One potential reason is the more negative surface charge that developed on BIOS on freezing. Because microbial cell membranes are generally negative, accessing the surface of BIOS via direct contact becomes more difficult when electrostatic repulsion needs to be overcome (Chorover, Reference Chorover2022; Marshall et al., Reference Marshall, Stout and Mitchell1971; Mills, Reference Mills2003).
To gain additional insight into the effect of freeze-thawing on bioavailability, we first considered setups in which additional labile OC was added. In most cases, the reduction extents reached 100%, highlighting the high bioavailability of BIOSFe(III) even after freeze-thawing. The one exception is for TIE-1 BIOS reduced by S. oneidensis, in which case the reaction stopped at 48% reduction extent – we consider this to be an outlier. In five out of six conditions, the reduction rates were lower after freeze-thawing. This emphasises the lower accessibility of BIOS on freeze-thawing. The one exception was for BoFeN1 BIOS reduced by G. sulfurreducens, which exhibited a higher rate after freeze-thawing. This is perhaps related to the difference in the reduction mechanism of the respective FeRB and their response to the spatial Fe–OC association within BIOS on freeze-thawing.
Next, we consider cases in which no labile OC was added. Here, TIE-1 BIOS displayed lower reduction rates and extents with both FeRB. This is consistent with the expectation of lower bioavailability due to decreased SSA and particle size after freeze-thawing. In comparison, BoFeN1 BIOS displayed lower or comparable reduction rates after freeze-thawing. This is not expected based on its increase in SSA, but is consistent with its increase in particle size that may have led to lower accessibility to the FeRB after freeze-thawing. In contrast to the other two BIOS, KS BIOS displayed higher reduction rate and extent after freeze-thawing. This is surprising considering the decrease in SSA and increase in particle size after freeze-thawing. Overall, our results suggest that SSA and particle size are poor predictors of relative reduction rate and extent after freeze-thawing treatment. This highlights the necessity of performing microbial reduction experiments to directly measure bioavailability in the presence of multiple completing variables.
Conclusion
As the transformation of Fe minerals interlinks with other elemental cycles (e. g. C, N and P), here we investigated the bioavailability of BIOS from FeOB. We tested multiple variables relevant across different environments: three different origins of BIOS, two model FeRB, with and without OC, and before and after freeze-thawing. Based on RDA, our study shows that OC availability is the primary factor controlling the bioavailability of BIOSFe(III). In the presence of excess labile OC, BIOSFe(III) can be completely reduced, exhibiting higher reduction rates compared to synthetic ferrihydrite. This is even more surprising considering that BIOS are composed of mixtures of ferrihydrite with more crystalline lepidocrocite and goethite. Hence, it emphasises the need to conduct experiments with naturally relevant materials to avoid underestimation of reaction rates relevant to the environment.
In soils that undergo freeze-thawing, such as high-altitude zones or mountain glaciers, Fe–organic matter associations and the physical properties of the minerals are potentially altered, leading to different bioavailability of the minerals and OC. The impact of freeze-thawing in BIOS properties (particle-size distribution, SSA and TOC) was FeOB-specific. Only the effect on their zeta potential was consistent, increasing their magnitude towards more negative values in all BIOS. These changes in the properties had a greater impact on the rate than on the extent of reduction. Overall, freeze-thawing was a secondary control on bioavailability, with the primary factor being the presence of labile OC.
Our study also indicated limited bioavailability of the BIOSOC for FeRB, although we cannot exclude its bioavailability in natural systems, where other microorganisms (e. g. fermentative microorganisms) could degrade and transform the associated OC to more bioavailable low-molecular-weight organic molecules. We leave this open question for further studies. We attempted to directly track if any BIOSOC was released to the solution. However, the low TOC content of BIOS (0.24–2.2 wt%) made this challenging. Conversion to OC/Fe molar ratios revealed a range of 0.02–0.17, which is much lower than observed for natural Fe–OC aggregates, ranging from <1.0 for sorption to a maximum of 6–10 for coprecipitation or chelation (Lalonde et al., Reference Lalonde, Mucci, Ouellet and Gélinas2012). Then, the role of BIOS on the fate of carbon is limited and linked to the carbon that could potentially adsorb and co-precipitate within BIOS, rather than to the amount of native BIOSOC. We stress, however, that we worked exclusively with anaerobic FeOB in this study. Environmental BIOS collected under microoxic conditions have been found to contain up to 34.5 wt% organic matter (Martinez et al., Reference Martinez, Smith, Pedersen and Ferris2003). Furthermore, the higher reactivity of BIOS compared to ferrihydrite indicates that OC associated with BIOS is more likely to be released. To unequivocally trace which molecules are derived from BIOS and determine their use, other more sensitive approaches need to be undertaken in future studies, such as 13C labelling during BIOS formation by Fe(II)-oxidising bacteria.
Supplementary material
The supplementary material for this article can be found at http://doi.org/10.1180/gbi.2026.10008.
Acknowledgements
The authors acknowledge support by the Deutsche Forschungsgemeinschaft (DFG, German Research Foundation), Project 494840258. A.K. acknowledges infrastructural support by the DFG under Germany’s Excellence Strategy, Cluster of Excellence EXC2124, project ID 390838134. The authors would like to thank Jeremiah Shuster for his assistance in the acquisition of SEM micrographs via the Tübingen Structural Microscopy Core Facility (funded by the Federal Ministry of Education and Research (BMBF) and the Baden-Württemberg Ministry of Science as part of the Excellence Strategy of the German Federal and State Governments). We also thank the German Research Foundation DFG (INST 37/1027-1 FUGG) for financial support provided for the acquisition of the cryogenic focused ion beam scanning electron microscope. Additionally, we thank Nora Kainz for her assistance in DOC measurements; Marie Mollenkopf for HPLC measurements, and Bernice Nisch for TOC measurements. We acknowledge support from the Open Access Publishing Fund of the University of Tübingen.


 Open access

