The incumbent president, Nicolas Sarkozy, will face a tough challenge during the French presidential election in May 2012. For the first time since 1981, when the right-wing president Valéry Giscard-d'Estaing was defeated by the Socialist challenger François Mitterrand, the 2012 election takes place in difficult economic times. As the sitting president for the last five years, Sarkozy will likely be held accountable for the poor performance of the French economy. The large number of declared candidates from the Right running in the first round of the election is interpreted as a sign of the dissatisfaction with Sarkozy's record among his own followers, and some speculate that he may not even get to the decisive second round.
Is the victory of Sarkozy's main challenger, the Socialist François Hollande, a foregone conclusion? To address this question, we developed a forecasting model based on local and national data whose values were known several months before the election. Based on the results of this politico-economic model, we conclude that Nicolas Sarkozy will run a competitive fight but will ultimately loose his bid for re-election. After 17 years of waiting, the return of a Socialist at the Élysée appears highly probable.
This article is divided into four parts. First, we briefly review the literature on French forecasting models. Next, we provide details about the French electoral system. Then, we introduce our model and the data used for its estimation. Finally, we present and discuss predictions derived from this model, including our forecast for the 2012 election.
FORECASTING PRESIDENTIAL ELECTIONS IN FRANCE
Polls remain the favored tool for public opinion and political parties to predict electoral outcomes. But sometimes polls go wrong. Political scientists and economists have developed alternative scientific approaches to electoral forecasting including political stock markets and statistical models (Lewis-Beck Reference Lewis-Beck2005). In line with the last approach, in this article we propose a forecasting model based on French local (namely, départements) and national data.
Contrary to the United States, forecasting models for French presidential elections remain a scarce commodity. Based on a political-economy specification, most of these use time-series data (Lafay, Facchini, and Auberger Reference Lafay, Facchini and Auberger2007; Lewis-Beck, Bélanger, and Fauvell-Aymar Reference Lewis-Beck, Bélanger and Fauvelle-Aymar2008; Nadeau, Lewis-Beck, and Bélanger Reference Nadeau, Lewis-Beck and Bélanger2010) and deal with limited observations (N = 8, the number of presidential elections since 1965). To circumvent this small N problem, scholars have turned to a combination of local and national information, using either departmental (Auberger Reference Auberger2010; Dubois and Fauvelle-Aymar Reference Dubois, Fauvelle-Aymar and Lewis-Beck2004) or regional data (Jérôme and Jérôme-Speziari Reference Jérôme, Jérôme-Speziari and Lewis-Beck2004) to estimate forecasting models.Footnote 1 Beyond increasing the number of observations, using local data captures local economic and political patterns over time (see Campbell Reference Campbell1992).
The record of forecasting models in France is mixed. On one hand, the victory of the candidate from the Right, Jacques Chirac, was accurately predicted in 1995. Backward (out-of-sample) forecasts nicely demonstrate how the evolution of the French economy heralded months in advance the two victories of Socialist candidate, François Mitterrand, as the challenger in 1981 and as the incumbent seven years later. No model, on the other hand, predicted that the second round of the 2002 election would be fought between the incumbent right-wing moderate president, Jacques Chirac, and the leader of the extreme-right, Jean-Marie Le Pen.Footnote 2 The election of Nicolas Sarkozy in 2007, despite the low popularity of the sitting right-wing president (Jacques Chirac) and prime minister (Dominique de Villepin), was also unforeseen by most forecasters. Overall, the models using both local and national data fared better. We present our own model based on this approach later in the text. First, however, we discuss the details of the French electoral system.
THE FRENCH PRESIDENTIAL ELECTION
The French polity is a semipresidential system in which the executive branch is shared by the president and the prime minister. In the French variant of this system, the president is presumed to be the dominant political figure and to act as the main agenda-setter with little initiative given to the prime minister. Adopted in 1958 under the chairmanship of General De Gaulle, the Constitution of the Fifth French Republic was tailored to assure the preeminence of the executive (the president) over the legislative branch. It granted extended powers to the president as well as an extensive seven-year mandate (since then it has been reduced to five years). The election of the president through universal suffrage was included in the Constitution in 1962 after a successful referendum. The first modern French presidential election took place in December 1965.
The French system experienced its first failure in 1986 when the Socialist president François Mitterrand, elected in 1981 for a seven-year mandate, was forced to name a right-wing prime minister after the victory of the Right in the 1986 legislative elections. This first period of divided government (called “cohabitation” in France) lasted two years and was followed by two similar episodes, from 1993 to 1995 and between 1997 and 2002. Two constitutional changes were introduced in 2000 to prevent such a dilution of presidential powers: the length of presidential mandates was aligned to that of the National Assembly (five years) and the electoral calendar was organized to ensure that the presidential election will take place a few months before the legislative elections.
These changes were designed to strengthen the executive power and reduce the odds of divided government. Consequently, the presidential election has now regained its original meaning, emphasizing the prominent role of the president on both domestic and international spheres. These changes did not go unnoticed by the French voters, who now consider legislative elections as second-order elections. Not surprisingly, turnout for presidential elections has remained high whereas participation for legislative elections has fallen dramatically. Now, many observers characterize French elections as a three-round electoral system, formed of the eliminatory and decisive rounds of the presidential elections (only the two first candidates in the first round are eligible to run for the second) and the confirmatory legislative elections whose primary function is to provide the newly elected candidate with an appropriate majority in the Assembly to fulfill his political agenda. Therefore, the importance of presidential elections in France can hardly be understated.
A FORECASTING MODEL FOR FRENCH PRESIDENTIAL ELECTIONS
Our model rests on two assumptions largely shared by forecasters: First, it assumes that national electoral outcomes in most countries can be satisfactorily explained by a limited number of political and economic variables. Second, it hypothesizes that the values taken by these variables several months in advance are often more useful to predict electoral outcomes than information picked closer to Election Day. This last assumption supposes that campaigns basically play a “clarifying” role by refocusing voters' decisions on fundamentals like partisanship, the state of the economy, and the overall record of the incumbent.
The approach adopted by most electoral forecasters consists of using aggregate indicators (unemployment, approval rate, etc.) measured with a lag to predict the outcome national elections (see Lewis-Beck and Rice Reference Lewis-Beck and Rice1992). Using disaggregated (local) information serves two main purposes: to predict local results, a task that is crucial in American presidential elections whose outcome is determined at the state level through the Electoral College system and, for practical reasons, to circumvent the small N problem because of the limited number of national elections. In this case, the purpose is to increase the degrees of freedom to arrive at more robust and reliable results. The local results do not form the primary focus of such work but rather are aggregated and averaged to obtain a national figure.
This second approach is adopted in this article. A mix of political and economic variables, measured at local and national level, explains and predicts the outcome of French presidential elections. The selection of the explanatory variables, as is clear in the text that follows, rests on the theoretical underpinnings of the well-established politico-economic model. The use of disaggregated data serves the practical purpose of increasing the number of cases, but the point can also be made that local information is more relevant to voters' choice and that models using these should provide better results.
Our model is estimated from local départements and national data and takes the following form:

The dependent variable (Votei,t) measures the vote share for the right-wing candidate in the 96 French departments in the second round of the five presidential elections held between 1981 and 2007 (t = 5; see the appendix for more details about the variables). Using the score of the left-wing candidates would have produced the same results because only two contenders can move to the second round. A methodological problem arises in 2002 when Jacques Chirac faced the extreme-right leader Jean-Marie Le Pen in the second round and won 82% of the vote. To address this problem, we use the vote share of all right-wing candidates in the first round of the 2002 election and therefore predict this aggregated vote share.
The independent variables include four variables measured at the local level: the evolution of the unemployment rate (UNEMP), the level of support for the right-wing candidate at the previous presidential election (PRESID), and two measures of the partisan strength of the Right at the local level (STRENGt−1 and STRENGt−2). A fifth variable, the popularity of the right-wing candidate (POP) is measured at the national level. All these variables are available several months (UNEMP and POP) or several years (PRESID, STRENGt−1, and STRENGt−2) before the election. Using a four-month lag for the unemployment and popularity variables (values taken in December) makes sense giving the dynamics of French electoral campaigns. The period from January to May represents the last stretch of the campaign, when declared candidates really start touring the country.
The theoretical status of the variables in the model is well established. The first variable, unemployment (UNEMP), is expected to display a negative sign on the basis that the electorate punish or reward incumbents depending on the recent evolution of the labor market (Lewis-Beck and Stegmaier Reference Lewis-Beck, Stegmaier, Dalton and Klingemann2007).Footnote 3 The second variable, POP, the national popularity of the second round right-wing candidate, is included to account for the impact of political variables on electoral outcomes (Nannestad and Paldam Reference Nannestad and Paldam1994; typical examples of such variables are wars and scandals). The interpretation of this variable, which is expected to exert a strong and positive impact on the vote, is made easier because right-wing candidates in France were incumbents in the decisive second-round in all instances save one, either as president (1981, 2002, 2007, and 2012) or prime minister (1988; the only exception is 1995; still, in the 1995 election, the incumbent prime minister Édouard Balladur ran in the first round). The third variable, the support for the Right at the previous presidential elections (PRESID), accounts for the inertia in voting patterns over time. The last two variables (STRENGt−1 and STRENGt−2) measure the difference between the national and local support for the right-wing candidate at the previous and penultimate presidential elections and account for the local strengths of the Right (the expectation is that a department highly favorable to the Right at time t − 1 is likely to behave the same way at the next election).
The model is estimated with panel data (t= 5 elections; i = 96 departments; N = t × i = 480). The political and economic information included in the specification cannot account for all possible cofactors susceptible to influence the vote, such as religion, culture, and socio-demographic indicators. The solution to this problem is to use a fixed-effect model to control for unobserved time-invariant differences between départements (practically speaking, this means including i − 1 departmental dummy variables in the model; see variable DDepi in the preceding equation). Using this estimation technique ensures that the estimated coefficients presented in table 1 are not biased due to omitted time-invariant variables. Another potential problem could arise because the popularity variable (POP) is time-variant but space-invariant (i.e., its value is the same for all departments in given year). To ensure that our estimates are not biased by a time random effect (see Greene Reference Greene2008), we performed Hausman tests (with and without the variable POP in the model) that confirm that the department-fixed effect and time-random effect model is the adequate specification for our data.
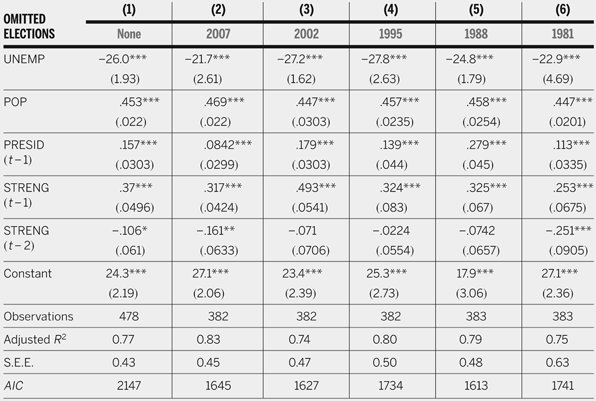
A Forecasting Model for French Presidential Elections, 1981–2007

Robust standard errors in parentheses.
* p < 0.10,
** p < 0.05,
*** p < 0.01 (one-tailed tests).
Note: Départements fixed-effects are not reported due to space limitation.
THE RESULTS
The regression analyses for our forecasting model are reported in table 1. Given the nature of our data, we use generalized least-squares (GLS), which allows for heteroscedastic and cross-sectionally correlated disturbances, to get efficient estimates of the regression parameters (see Greene Reference Greene2008). The estimates in column (1) are based on the five elections under study and are used to obtain within-sample predictions as well as our out-of-sample forecast for the 2012 election. The results in columns 2 to 6 present estimates when elections are deleted in turn (t = 4) and serve to perform out-of-sample forecasts for previous elections (1981 to 2007).
A first look at the overall performance of the model is needed. The model fits the data well, explaining close to four-fifths of the variance (Adjusted R 2 = .77) in the level of support for the candidates of the Right across the French departments during the sampling period. Moreover, all the explanatory variables are statistically significant and properly signed. Finally, the robustness of the results is clear. The values of the adjusted R 2 and the standard error of estimates vary within a narrow range (from .74 to .83 and from .45 to .63, respectively) when elections are deleted and all the coefficients but one (STRENGt−2) are significant and adequately signed in the regressions.
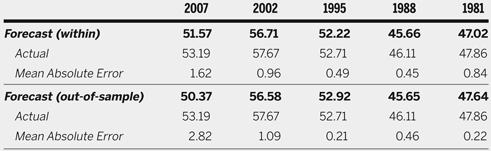
The key concern is about the quality of the predictions derived from our model. To recall, within and out-of-sample forecasts are first computed for the 96 departments and then averaged to arrive at a single estimate for each election (a weighting procedure is used to account for the departments variable population sizes). The observed and forecasted levels of support for the right-wing candidates in the second round of presidential elections are displayed in table 2. The precision of the model is striking. The mean absolute error for the within-sample forecasts is low, .87, and the winner is adequately determined for the five elections under study (the Left won in 1981 and 1988 and the Right in 1995, 2002, and 2007).
Out-of-Sample and within Forecasts, 1981–2007 (in %)

The crucial test bears on the quality of the out-of-sample forecasts. The results in table 2 show that the model performs well. The mean absolute error for the out-of-sample predictions is low, 1.06, and once again, the model picked the correct winner in all cases. One outcome is admittedly less accurately predicted, namely the victory of Nicolas Sarkozy in 2007 (error = 2.8). One reason for this larger error may be the “open election” character of this race. In 2007, Sarkozy succeeded in distancing himself from the incumbent government (of which he had been a prominent figure for years) and consequently avoided losing too much support due to its unpopularity.
Overall, our parsimonious specification—based on the evolution of unemployment, popularity ratings, and departmental political trends—performs very well and, with a lead time of four months, proved to predict the major political shifts (from the Right to the Left in 1981 and again to the Right in 1995) in France over the last decades.Footnote 4 Based on this model, what would be the outcome of the forthcoming French election? Is there another major political shift in sight after 17 years of domination of the Right at the apex of the French political system?
The 2012 French presidential election will be held on April 26 (first round) and May 6, 2012 (second round). Our forecast is based on the results displayed in the first column of table 1 and based on information available in December 2011 or before. The prediction is about the vote share for Nicolas Sarkozy, the sitting president, assuming that he will face the Socialist François Hollande in the second round. According to our estimates, the vote for the candidate of the moderate Right decreases by 2.6 percentage points for every 1 percentage point increase in the evolution of the rate of unemployment when the Right is in power (and increase accordingly it forms the opposition). More importantly, an increase of 1 percentage point in the popularity of the candidate of the moderate Right can bring him a gain of 0.45% of vote share.
What is the expected support for Nicolas Sarkozy in May 2012 given the level of these variables four months before the election? According to official data from the INSEE, the unemployment rate increased on average by 1% in the French departments between the second and the fourth quarters of 2011 (see the appendix for more details). The level of approval for the current president reached 36% in December 2011 according to IFOP.Footnote 5 Including these values in our model, with the appropriate information for the other predictors (PRESID, STRENGt−1, and STRENGt−2) and the estimates for departmental fixed-effects, brings us to the conclusion that the candidate of the moderate Right, the incumbent president Nicolas Sarkozy, will receive 48.1% of the vote in the second round of the French presidential election in May 2012 against 51.9% for the candidate of the moderate Left, the Socialist François Hollande. Of course, this prediction is conditional on the statistical margin of error and the political uncertainty about the identity of the two candidates who will make their way to the second round. Given the level of the standard error of the estimate for the model (0.43) and the mean absolute error for the out-of-sample forecasts for previous elections (1.06), our prediction is on safe ground, statistically speaking. Also, the possibility that a candidate from the extreme-left or the extreme-right gets enough support to qualify for the second round appears unlikely. All in all, the prediction that the next president of France will be a Socialist seems to rest on solid grounds, politically and statistically.
APPENDIX
Dependent Variable (Vote) = Vote share of the right-wing candidate in the second round of presidential elections (1981, 1988, 1995, 2007). For 2002: Vote share of the right-wing candidates in the first round of the presidential election.
INDEPENDENT VARIABLES
UNEMP: change in the unemployment rate at the department level between the fourth and the second quarter during the year preceding the election.
POP: Popularity of the right-wing candidate measured by the percentage of respondents satisfied with the performance of the incumbent President (1981, 2002, and 2007) or Prime Minister (1988, 1995) in the month of December preceding the election.
Presid (t − 1): Vote share of the right-wing candidate at the previous election.
Streng (t − 1): Difference between the vote share of the right-wing candidate at the departmental and national level in the second round at the previous presidential election (1981, 1988, 1995, 2007). For 2002: Difference between the vote share of the right-wing candidate at the departmental and national level in the first round at the previous presidential election.
Streng (t − 2): Difference between the vote share of the right-wing candidate at the departmental land national level in the second round at the penultimate presidential election (1981, 1988, 1995, 2007). For 2002: Difference between the vote share of the right-wing candidate at the departmental and national level in the first round at the penultimate presidential election.
DDep: (i − 1 = 95) department dummies.
SOURCES
Electoral outcomes (Vote, Presid, Streng) data come from the CDSP (Centre de Données Socio-Politiques/Science Po Paris): http://cdsp.sciences-po.fr.
Popularity data come from the IFOP Barometer (monthly data): www.ifop.fr.
Unemployment data come from the INSEE (Institut National de la Statistique et des Etudes Economiques): http://www.insee.fr/fr/themes/tableau.asp?reg_id=99&ref_id=CMRSOS03312.