Introduction
The progress of wireless communication technologies has enabled a wide range of emerging applications, including wireless sensor networks, Internet of things (IoT), and connected industrial and urban areas. These technologies form the backbone of smart city ecosystems, supporting various domains such as precision agriculture, healthcare, public safety, transportation, logistics, smart metering, and wearable devices [Reference Huawei1]. Reliable operation of these systems heavily relies on antennas, which are expected to be compact and easily integrated into devices and their surrounding environment.
Transparent antennas have gained significant attention in smart city, automotive, and IoT applications as they can be integrated unobtrusively into their surroundings. Among available substrate materials, glass is particularly well suited as it occupies extensive areas in modern architecture, such as windows, doors, facades, partitions, and glass walls, providing abundant surface space for antenna integration in smart buildings. Historically, transparent antennas were first adopted in cases where photovoltaic panels and antennas had to coexist within limited real estate, for instance in small satellite platforms, in order to balance harvesting of solar power with communication needs [Reference Saberin and Furse2]. A notable early demonstration was the AgHT-8 microstrip patch on Plexiglass, reported in a 1997 NASA technical memorandum, which showed promising antenna performance [Reference Simons and Lee3].
With the growing demand for integrating antennas seamlessly into architectural elements of smart buildings, on-glass antenna designs have emerged as a practical solution. Although glass is abundant and mechanically robust, the types commonly employed in architectural applications tend to exhibit relatively high dielectric losses, which can degrade antenna performance. Furthermore, transparent conductors such as indium tin oxide (ITO) and metallic meshes, which are widely used to realize transparent radiating elements, involve an inherent compromise between optical transparency and electrical conductivity. Consequently, achieving higher levels of transparency typically reduces antenna efficiency, as increased ohmic losses occur within the radiating structure [Reference Saberin and Furse4].
Recent studies have demonstrated that metal mesh-based transparent antennas can improve radiation efficiency while maintaining high optical transparency. A dual-band transparent antenna employing a frame-structured metal mesh conductive film on a glass substrate was reported for LTE sub-6 GHz applications, operating over 1.9–2.4 GHz and 3.4–4.1 GHz. By reinforcing the antenna edges with additional metallic paths, current leakage was suppressed, resulting in efficiency improvements exceeding 50% at 2.1 GHz and 3.6 GHz while preserving approximately 80% optical transparency [Reference Lin, Wu and Chang5]. Similarly, a dual-band circularly polarized transparent antenna integrated onto a vehicle glass sunroof for Global Navigation Satellite System (GNSS) reception utilized a fine printed metal mesh radiator on glass at 1.176 GHz and 1.582 GHz, achieving realized gains of 4.4 dBi and 5.5 dBi with radiation efficiencies of about 50% and 75%, respectively. These works collectively indicate that carefully engineered metal mesh structures can partially mitigate the efficiency–transparency trade-off, particularly for large-area glass-integrated antennas in vehicular and architectural applications [Reference Dang, Nguyen-Trong, Kaufmann, Saarnimo, Hide and Fumeaux6].
As reported in the literature, antennas employing transparent thin conductive film radiators often exhibit lower radiation efficiency and gain compared to conventional metallic antennas on low-loss substrates. For instance, a coplanar waveguide (CPW)-fed transparent ITO antenna on glass achieved poor efficiency (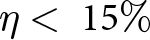 $\eta \lt {\text{ }}15\% $) and exhibited negative gain [Reference Trujillo-Flores, Torrealba-Meléndez, Muñoz-Pacheco, Vásquez-Agustín, Tamariz-Flores, Colín-Beltrán and López-López7]. Likewise, a monopole ITO antenna on glass, reported in [Reference Colombel, Castel, Himdi, Legeay, Vigneron and Motta Cruz8], provided low gain performance despite its nearly invisible appearance. A ultra-high frequency radio frequency identification (UHF-RFID) tag antenna fabricated on Corning glass demonstrated 37% efficiency [Reference Salik, Ali, Uzair, Matthew and Chalermwisutkul9]. By contrast, a CPW-fed antenna patterned with 650 nm ITO on 150 µm flexible glass achieved 42.5% efficiency, highlighting its potential for wearable and flexible electronics [Reference Poliks, Sung, Lombardi, Malay, Dederick, Westgate, Huang, Garner, Pollard and Daly10]. Another example is an optically transparent microstrip patch integrated with a commercial solar module, which attained 3.96 dBi gain at 3.5 GHz, suitable for solar energy systems [Reference Roo-Ons, Shynu, Ammann, McCormack and Norton11]. At even higher frequencies, where skin depth effects are reduced, a coaxial-fed 300 nm ITO microstrip patch on quartz glass operating at 9.85 GHz (X-band) achieved 4.27 dBi gain and 56% radiation efficiency [Reference Sun, Muneer and Zhu12]. The strong variation in radiation efficiency is typical for transparent antennas in which ITO is used to fabricate the radiating element. This behavior arises from differences in the sheet resistance of the ITO films used in fabrication. These films generally consist of a transparent, non-conducting substrate such as polyethylene terephthalate coated with a thin conductive ITO layer. Increasing the thickness of the ITO layer reduces optical transparency but lowers the sheet resistance, thereby improving the radiation efficiency.
Optically transparent metasurfaces have been explored for antenna gain enhancement. A transparent metasurface-based resonant cavity antenna operating at 5.6 GHz was realized using a micro-metal-mesh conductive film (MMMC-film) on a glass substrate. The metasurface, composed of square MMMC patches, exhibited approximately 75% optical transmittance with a sheet resistance of 0.7 Ω/sq. An air-filled cavity of about λ/2 formed between the metasurface and the patch feed increased the antenna gain from 4.7 dBi to 13.2 dBi, demonstrating the potential of glass-based transparent metasurfaces for high-gain antenna applications [Reference Li, Chen and Hu13].
Beyond individual antenna implementations, several review articles have systematically examined the development of optically transparent antennas for modern wireless systems. Domínguez et al. reviewed transparent antennas for 5G and beyond, classifying transparency-enabling techniques for antennas on transparent substrates with conventional metallic radiators, and fully transparent antennas employing both transparent substrates and radiators. Similarly, Chishti et al. surveyed state-of-the-art transparent antennas based on thin conductive films, metal mesh grids, and hybrid structures, emphasizing that most reported designs rely on transparent substrates combined with transparent radiators, which inherently introduces a trade-off between optical transparency and radiation efficiency [Reference Domínguez, Silva, Baghel, Albuquerque and Pinho14, Reference Chishti, Aziz, Qureshi, Abbasi, Algarni, Zerguine, Hussain and Hussain15].
While previous studies have emphasized transparency, it is not always required for on-glass antennas. When transparency is not critical, replacing ITO or metal mesh with conventional conducting materials to fabricate the radiating element can significantly improve radiation efficiency, resulting in higher gain and extended communication or sensing range. In many practical scenarios, antennas made from traditional metallic conductors such as copper can be mounted directly onto glass surfaces while maintaining structural integrity and visual harmony. Beyond aesthetic considerations, on-glass antennas are also valuable for security-oriented applications, such as access control in smart buildings. They can be discreetly integrated into existing structures while avoiding the privacy concerns often associated with camera-based systems.
In addition to transparent radiating elements, metasurface-based approaches have been widely explored for antenna performance enhancement. A comprehensive review on advanced metasurface-based antennas summarized the use of artificial magnetic conductors (AMCs) and related metastructures to improve antenna gain, bandwidth, and radiation characteristics. The review emphasized that AMC-backed antennas are particularly attractive for low-profile implementations, as they enhance efficiency and gain while suppressing backward radiation [Reference Yang, Li, Chen, Cao, Xue and Che16]. Among the various AMC configurations reported in the literature, structurally simple and compact unit cells are particularly attractive for practical fabrication and integration. Ali et al. demonstrated improved performance of a dual-band textile antenna using a compact AMC reflector that enhanced forward gain and suppressed backward radiation, while employing a simple geometry suitable for low-cost fabrication. Motivated by its simplicity and proven gain enhancement capability, a similar AMC topology is adopted in this work and implemented on a glass substrate [Reference Ali, Basir, Zada, Ullah, Kamal and Yoo17].
Building on our earlier work [Reference Uzair, Acharjee, Boonpoonga, Heberling and Chalermwisutkul18], where we demonstrated the feasibility of a wideband bidirectional on-glass antenna for IoT and smart building applications, this extended study explores how the radiation performance can be further enhanced. In this work, we further optimize the antenna to achieve a wider bandwidth and investigate its integration with an on-glass AMC. This integration enables a unidirectional radiation pattern with higher gain while maintaining a low-profile form factor suitable for building integration. This approach highlights the potential of architectural glass widely used for structural functions as a functional platform for seamlessly embedding wireless connectivity without consuming additional space. By exploiting existing glass surfaces, the proposed concept enables unobtrusive communication and sensing capabilities that are well suited to smart building and smart city scenarios, including indoor connectivity, localization, and asset tracking. These advances establish the proposed antenna as a promising candidate for next-generation smart building elements such as doors, windows, and facades.
Characterization of architectural glass types
This is an extended study based on a conference paper. An earlier version of this paper was presented at the 19th Conference of Antennas and Propagation (EuCAP 2025) and was published in its Proceedings [Reference Uzair, Acharjee, Boonpoonga, Heberling and Chalermwisutkul18]. The glass samples were supplied by our industrial partner for characterization. Five commonly used architectural glass types were examined: green-tinted, blue-tinted, clear, low-iron ultra-clear, and reflective glass. Their dielectric constant ( ${\varepsilon _r}$) and loss tangent (
 $\tan \delta $) were measured using a Keysight N1501A high-temperature dielectric probe over the frequency range of 0.4–6.5 GHz. To ensure accuracy, multiple points on each sample were measured (see Fig. 1), and the reported
 ${\varepsilon _r}$ and
 $\tan \delta $ values are the averages across all locations. Since even a small air gap between the probe and the sample would compromise measurement accuracy, a lab jack was used to press the glass firmly against the probe during testing. Figure 2 shows the measured
 ${\varepsilon _r}$ and
 $\tan \delta $ values for the selected glass types. The
 ${\varepsilon _r}$ values of all five glasses lie within 7.0 ± 0.2, while exhibits a noticeable rise above 3 GHz. Table 1 provides a summary of the
 ${\varepsilon _r}$ and
 $\tan \delta $ values for each glass sample at 2.1 GHz and 2.4 GHz.
(a) Probing locations for characterization of the glass samples and (b) photograph of the measurement setup.

(a) Measured dielectric constant ( ${\varepsilon _r}$) and (b) measured loss tangent (
 $\tan \delta $) of various glass samples.

Figure 2 Long description
A line graph with the horizontal axis labeled, Frequency (GHz) and the vertical axis labeled, Dielectric Constant (epsilon subscript r). The horizontal axis ranges from 0 to 7. The vertical axis ranges from 0 to 10. A legend lists, Green Tint Glass, Blue Tint Glass, Clear Glass, Low Iron Ultra Clear Glass, Reflective Glass. The five lines are drawn as solid lines and are visually distinguished by different line colors. Dielectric Constant (epsilon subscript r) plotted against Frequency (GHz): No point markers are shown. The lines stay close to 7 across the full frequency range. The lines show small changes with frequency and remain within a narrow band. The image B showing a line graph with the horizontal axis labeled, Frequency (GHz) and the vertical axis labeled, Loss Tangent (tan delta). The horizontal axis ranges from 0 to 7. The vertical axis ranges from 0 to 0.2. A legend lists, Green Tint Glass, Blue Tint Glass, Clear Glass, Low Iron Ultra Clear Glass, Reflective Glass. The five lines are drawn as solid lines and are visually distinguished by different line colors. Loss Tangent (tan delta) plotted against Frequency (GHz): No point markers are shown. One line starts higher near the left side of the plot and decreases toward about 0.02 by around 2 gigahertz, then stays near that level. The other four lines start near 0.01 to 0.02 and rise after about 3 gigahertz. By the right side of the plot near 7 gigahertz, the highest line is near 0.12 and the other rising lines are near 0.10 and near 0.09.
Measured  ${\varepsilon _r}$ and
 $\tan \delta $ of the glass samples at 2.1 GHz and 2.4 GHz

Table 1 Long description
Measurements are given for five glass samples at two frequencies, 2.1 gigahertz and 2.4 gigahertz, reporting relative permittivity and loss tangent for each frequency. At 2.1 gigahertz, green tinted glass has relative permittivity 7.05 and loss tangent 0.015; blue tinted glass 6.87 and 0.006; clear glass 6.63 and 0.010; low iron ultra clear glass 7.17 and 0.014; reflective glass 6.99 and 0.014. At 2.4 gigahertz, green tinted glass has relative permittivity 7.13 and loss tangent 0.018; blue tinted glass 6.89 and 0.006; clear glass 6.64 and 0.013; low iron ultra clear glass 7.18 and 0.017; reflective glass 6.99 and 0.018. Relative permittivity increases slightly from 2.1 to 2.4 gigahertz for green tinted, blue tinted, clear, and low iron ultra clear glass, and stays the same for reflective glass. Loss tangent increases from 2.1 to 2.4 gigahertz for green tinted, clear, low iron ultra clear, and reflective glass, and stays the same for blue tinted glass.
Among the tested samples, blue-tinted glass showed the lowest loss tangent, followed by clear glass. Since clear glass is the most widely used material in building construction, a 3 mm sheet was selected as the antenna substrate. Its measured dielectric constant and loss tangent were then used to model the substrate in the Ansys HFSS simulations.
Design and simulation of the initial bidirectional on-glass antenna
Antenna design
The bidirectional antenna presented in this work is based on a modified rectangular monopole with an asymmetric coplanar ground, originally reported in [Reference Uzair, Acharjee, Boonpoonga, Heberling and Chalermwisutkul18]. While the overall geometry of the radiating elements was retained, the dimensions were re-optimized to improve the −10 dB bandwidth. The initial design with full dimensions is shown in Fig. 3(a). The main modifications, relative to [Reference Uzair, Acharjee, Boonpoonga, Heberling and Chalermwisutkul18], concern the size of the rectangular monopole and the right arm of the coplanar ground. As described in the previous section, “Characterization of Architectural Glass Types”, 3 mm clear glass was selected as the substrate, resulting in a total antenna area of 60 × 60 mm2. The prototype was fabricated by cutting adhesive copper tape to shape and transferring it onto the glass substrate. A photograph of the fabricated bidirectional antenna is shown in Fig. 3(b).
(a) Proposed wideband on-glass IoT antenna structure (all dimensions are in mm) and (b) fabricated antenna prototype.

Figure 3 Long description
A proposed wideband on-glass IoT antenna structure with detailed dimensions labeled in millimeters. The design features a modified rectangular monopole with an asymmetric coplanar ground. The main rectangular element measures 22.00 millimeters in width and 8.95 millimeters in height, positioned centrally within the structure. Surrounding this, the coplanar ground extends to the left and right, with dimensions of 18.50 millimeters and 20.00 millimeters respectively. The total height of the structure is 60.00 millimeters, with various smaller sections labeled, including a 3.00 millimeter gap at the top and a 1.50 millimeter gap at the bottom. The image B showing the fabricated antenna prototype, which is mounted on a grid background. The prototype retains the same structural design as the diagram, with adhesive copper tape cut to shape and applied to a glass substrate. The central rectangular element and the coplanar ground are visible, with a connector attached at the bottom center. The grid background provides a scale reference, with numbers visible along the top and side edges.
Simulation and measurement results of the bidirectional on-glass antenna
Figure 4 shows a photograph of the antenna measurement setup in the anechoic chamber. The comparison between simulated and measured S11 is presented in Fig. 5, with Fig. 5(a) showing results for the original bidirectional antenna reported in [Reference Uzair, Acharjee, Boonpoonga, Heberling and Chalermwisutkul18] and Fig. 5(b) for the re-optimized design proposed in this work. Both versions demonstrate good 50 Ω impedance matching across the frequency range of interest. However, the modified antenna (Fig. 3) achieves a substantially wider −10 dB bandwidth of approximately 1.5–2.6 GHz, compared to 1.9–2.5 GHz for the previous version [Reference Uzair, Acharjee, Boonpoonga, Heberling and Chalermwisutkul18]. This bandwidth extension enables coverage of additional IoT frequency bands, including 1.8 GHz and 1.9 GHz. The simulated radiation efficiency of the modified antenna is 90.86% at 2.1 GHz and 81.56% at 2.4 GHz. Considering the simulated efficiency, it is evident that our design performs significantly better than the other works discussed in the introduction, which typically report efficiencies below 60%. Most on-glass antennas in the literature prioritize transparency and therefore use ITO films or metal meshes. These materials have higher sheet resistance than copper, which leads to lower radiation efficiency. In contrast, our work does not prioritize transparency at this stage; instead, the focus is on extending the IoT communication range and achieving high radiation efficiency to support long battery life. In addition, the antenna is designed to provide a large operating bandwidth to support multiple IoT standards, including WiFi and NB-IoT.
Antenna measurement setup in the anechoic chamber.

Simulated and measured |S11| of the proposed on-glass bidirectional antenna (a) earlier study from [Reference Uzair, Acharjee, Boonpoonga, Heberling and Chalermwisutkul18], (b) optimized version reported in this work.

Figure 5 Long description
A line graph with the y-axis labeled, S subscript 11 left parenthesis decibel right parenthesis and the x-axis labeled, Frequency left parenthesis gigahertz right parenthesis. The x-axis runs from 1 to 4. The y-axis runs from minus 35 to 0. A legend lists three series: Simulation left parenthesis HFSS right parenthesis, Measurement 01 and Measurement 02. The Simulation left parenthesis HFSS right parenthesis curve starts near 0 at 1, drops to about minus 15 near 1.3, rises to about minus 7 near 1.7, then drops to about minus 12 near 2.0. It reaches a deepest dip near 2.5 at about minus 24, rises to about minus 4 near 3.0, dips again near 3.2 to about minus 10, then rises toward about minus 2 by 4. The Measurement 01 and Measurement 02 curves follow similar shapes. Both drop to about minus 14 to minus 16 near 1.3, rise to about minus 7 near 1.7, then dip near 2.0 to about minus 12 to minus 14. Both show a dip near 2.5 that is shallower than the simulation, around minus 16 to minus 18, then rise to around minus 4 near 3.0, dip near 3.2 to around minus 10 and rise toward about minus 2 by 4. The image B showing a line graph with the y-axis labeled, S subscript 11 left parenthesis decibel right parenthesis and the x-axis labeled, Frequency left parenthesis gigahertz right parenthesis. The x-axis runs from 1 to 4. The y-axis runs from minus 35 to 0. A legend lists two series: Simulation left parenthesis HFSS right parenthesis and Measurement. The Simulation left parenthesis HFSS right parenthesis curve starts near 0 at 1, drops below minus 10 by about 1.6, reaches about minus 22 near 2.0, then rises to about minus 10 near 2.4. It then drops to a deepest dip near 2.6 at about minus 31, rises sharply to about minus 6 near 2.9 and then stays between about minus 6 and minus 2 from about 3.0 to 4.0. The Measurement curve starts near 0 at 1, drops below minus 10 by about 1.6, reaches about minus 16 near 2.0, rises to about minus 10 near 2.4, then drops near 2.6 to about minus 22. It rises to about minus 6 near 2.9, then stays between about minus 6 and minus 2 from about 3.0 to 4.0, ending near about minus 2 at 4.
The simulated and measured radiation patterns of the modified antenna at 2.1 GHz and 2.4 GHz are shown in Fig. 6, with good agreement observed at both frequencies. To further illustrate the radiation mechanism, the average surface current distribution on the radiating elements was simulated, as presented in Fig. 7. The simulated surface current shows that at the lower frequency (1.9 GHz), the surface current is concentrated in the left arm of the asymmetric coplanar ground. As the frequency increases, the surface current shifts toward the right arm of the coplanar ground structure.
Simulated and measured gain of the proposed antenna at (a) 2.1 GHz and (b) 2.4 GHz.

Figure 6 Long description
Two polar line plots labeled, phi equals 0 degree and, phi equals 90 degree, with two series in each plot labeled, Simulation and, Measurement. Angle markings run from 0 to 345 in steps of 15. Radial tick labels are 0, minus 3, minus 6, minus 9, minus 12, minus 15. In the plot labeled, phi equals 0 degree, the Simulation curve stays close to the 0 to minus 3 rings for most angles and dips inward near 180 degrees. The Measurement curve follows a similar outline and is slightly closer to the center than the Simulation curve across many angles. In the plot labeled, phi equals 90 degree, both curves form a two lobe shape, with larger radius near 0 degrees and 180 degrees and smaller radius near 90 degrees and 270 degrees. The Measurement curve remains close to the Simulation curve and is slightly closer to the center in several angle sectors. Two polar line plots labeled, phi equals 0 degree and, phi equals 90 degree, with two series in each plot labeled, Simulation and, Measurement. Angle markings run from 0 to 345 in steps of 15. Radial tick labels are 0, minus 3, minus 6, minus 9, minus 12, minus 15. In the plot labeled, phi equals 0 degree, the Simulation curve forms an oval with a more pronounced inward notch near 180 degrees than in image. The Measurement curve follows the same general outline and is slightly closer to the center than the Simulation curve across multiple angles. In the plot labeled, phi equals 90 degree, both curves again form a two lobe shape, with larger radius near 0 degrees and 180 degrees and smaller radius near 90 degrees and 270 degrees. The Measurement curve stays close to the Simulation curve and is slightly closer to the center in several angle sectors.
Simulated maximum surface current magnitude of the proposed antenna at (a) 1.9 GHz, (b) 2.2 GHz, and (c) 2.5 GHz.

Figure 7 Long description
A three part heatmap figure with sublabels a, b and c. Each part shows the same antenna layout outline with a large rectangular cutout and a narrow vertical feed strip connected at the outer perimeter and extending into the cutout. No x axis or y axis is shown. A single color scale applies to all three parts and is labeled, Joint Jmag. The scale tick labels are 0.00, 2.50, 5.00, 7.50, 10.0, 12.5, 15.0, 17.5, 20.0, 22.5, 25.0 and 27.0. The image A showing the Joint Jmag heatmap at 1.9 GHz. The highest intensity region is on the narrow feed strip and at the feed strip end where it meets the cutout boundary. Most of the remaining outer perimeter region is at lower intensity values on the same scale. The image B showing the Joint Jmag heatmap at 2.2 GHz. The highest intensity region remains on the narrow feed strip and at the feed strip end at the cutout boundary. The outer perimeter region shows additional mid range intensity patches compared with image A, while large areas remain at lower intensity values on the same scale. The image C showing the Joint Jmag heatmap at 2.5 GHz. The highest intensity region remains on the narrow feed strip and at the feed strip end at the cutout boundary. Additional higher intensity regions appear along sections of the outer perimeter compared with images A and B. The rest of the layout remains at lower intensity values on the same scale.
A detailed comparison of the simulated and measured antenna parameters between the earlier design and the optimized version is provided in Table 2. The simulated −10 dB bandwidth of the optimized antenna is 1.06 GHz, while the measured bandwidth is 1.10 GHz, spanning from 1.53 GHz to 2.63 GHz. This wide coverage encompasses the major NB-IoT frequency bands as well as the 2.4 GHz WiFi band. Hence, the proposed wideband on-glass antenna shows strong potential for IoT and smart building applications. It is noted that measured efficiency results are not provided due to the lack of suitable measurement facilities, such as a reverberation chamber. The Wheeler cap method is also not applicable, as it requires the antenna to be electrically small, which is not the case for the proposed design. Nevertheless, the measured gain values in Table 2 offer an indirect indication of efficiency. At 2.1 GHz, the measured and simulated gains are very close, suggesting that the actual efficiency is comparable to the simulated result. At 2.45 GHz, the slightly lower measured gain on the rear side indicates a modest reduction in efficiency relative to the simulation.
Simulated vs measured antenna parameters of the proposed on-glass antenna, previous work [Reference Uzair, Acharjee, Boonpoonga, Heberling and Chalermwisutkul18] vs this study

Table 2 Long description
Columns compare previous study and this study, each with simulated and measured values, for antenna parameters including minimum S11, gain at 2.1 GHz and 2.4 GHz for front and back, minus 10 dB bandwidth, lowest resonant frequency, highest resonant frequency, and total radiation efficiency at 2.1 GHz and 2.4 GHz. Minimum S11 is minus 23.88 dB simulated and minus 17.33 dB measured in the previous study, and minus 31.45 dB simulated and minus 26.32 dB measured in this study. At 2.1 GHz, front gain is 3.28 dBi simulated and 2.82 dBi measured previously, and 2.89 dBi simulated and 2.96 dBi measured in this study; back gain is 3.5 dBi simulated and 1.72 dBi measured previously, and 3.22 dBi simulated and 3.17 dBi measured in this study. At 2.4 GHz, front gain is 3.7 dBi simulated and 3.7 dBi measured previously, and 2.67 dBi simulated and 2.69 dBi measured in this study; back gain is 4.0 dBi simulated and 3.9 dBi measured previously, and 3.08 dBi simulated and 2.64 dBi measured in this study. Minus 10 dB bandwidth is 760 MHz simulated and 650 MHz measured previously, and 1.06 GHz simulated and 1.10 GHz measured in this study. Lowest resonant frequency is 1.84 GHz simulated and 1.89 GHz measured previously, and 1.59 GHz simulated and 1.53 GHz measured in this study; highest resonant frequency is 2.60 GHz simulated and 2.52 GHz measured previously, and 2.65 GHz simulated and 2.63 GHz measured in this study. Total radiation efficiency at 2.1 GHz is 94.82 percent simulated previously and 90.86 percent simulated in this study, and at 2.4 GHz is 95.72 percent simulated previously and 81.56 percent simulated in this study; measured efficiency cells are marked with an asterisk and show the label, N slash A.
* Efficiency not measured due to the lack of a suitable measurement facility, e.g. reverberation chamber.
For bidirectional antenna use, the design offers adequate standalone performance. However, in scenarios requiring unidirectional radiation and higher gain, the antenna is further integrated with an AMC, as discussed in the following sections.
Unidirectional on-glass antenna with integrated AMC reflector
In the previous section, a wideband bidirectional on-glass antenna for IoT applications was presented. For scenarios requiring higher gain and a unidirectional radiation pattern, a reflector can be employed. A conventional metallic reflector introduces a 180° phase shift upon reflection, necessitating a separation of approximately half a wavelength from the radiator to achieve constructive reinforcement in the forward direction. This requirement, however, results in a bulky structure. To enable a low-profile design, an AMC can be used, which provides a near-zero reflection phase. Ideally, the radiator can be mounted directly on the AMC, thereby enhancing forward radiation while suppressing back radiation. In practice, a small gap is still needed, though significantly less than the half-wavelength spacing of a metallic reflector. In this work, a dual-band, compact, and structurally simple AMC is designed, inspired by the work reported by Ali et al. [Reference Ali, Basir, Zada, Ullah, Kamal and Yoo17], which demonstrated effective gain enhancement. The AMC is adapted here for implementation on a glass substrate and integrated with the bidirectional antenna to achieve unidirectional operation. The design, fabrication, and performance of the AMC-integrated antenna are discussed in the following subsections.
On-glass AMC design
Figure 8(a) shows the unit cell of the proposed dual-band AMC surface, implemented on a 3 mm clear glass substrate and composed of square concentric rings backed by a metallic ground plane. The unit cell has overall dimensions of 30 × 30 mm2. A fabricated 5 × 5 AMC array is presented in Fig. 8(b). Both the concentric rings and the ground plane were realized using adhesive copper tape, employing the same low-cost fabrication method used for the on-glass bidirectional antenna in the previous section “Design and simulation of the initial bidirectional on-glass antenna”.
(a) Unit cell configuration of the proposed on-glass dual-band AMC (all dimensions are in mm) and (b) fabricated AMC prototype consisting of a 5 × 5 unit-cell array.

AMC simulation results
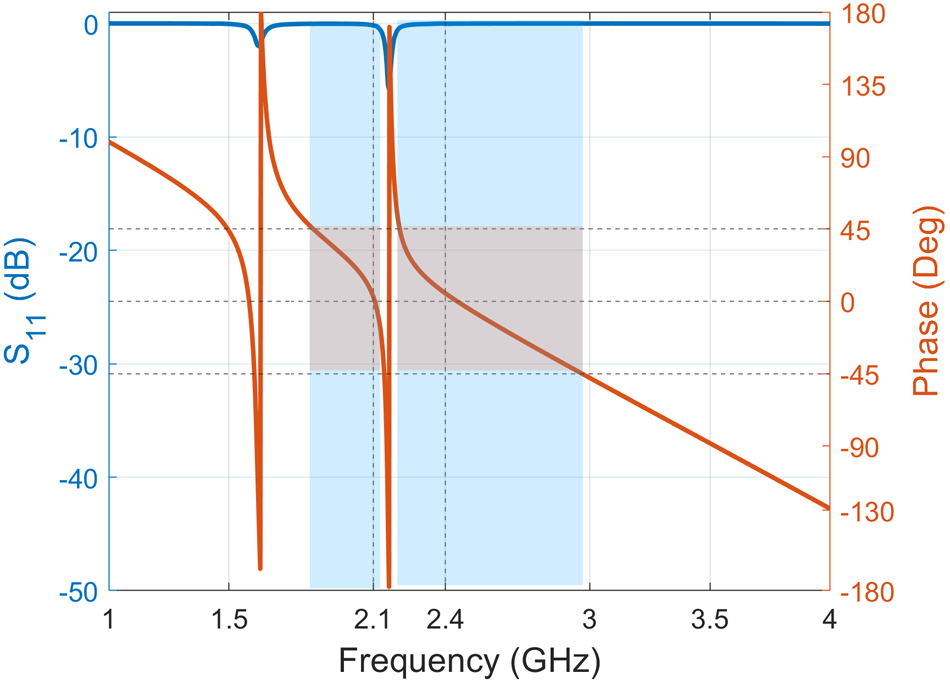
The simulated performance of the proposed dual-band AMC surface is shown in Fig. 9 in terms of reflection coefficient magnitude and reflected phase. The reflection magnitude (blue curve) remains close to 0 dB at 2.1 GHz and 2.4 GHz, indicating low reflection loss. The reflected phase (red curve) varies rapidly around the resonances and crosses 0° at both target frequencies, confirming the AMC behavior. The usable AMC bandwidth is defined as the frequency range where the reflected phase lies within ±45°, highlighted by the blue shaded region in Fig. 9. Within this range, the surface provides in-phase reflection, enabling antenna gain enhancement. The results demonstrate that the AMC achieves dual-band operation around 2.1 GHz and 2.4 GHz with adequate phase bandwidth to cover both bands, making it suitable for integration with the wideband bidirectional on-glass antenna presented in the section “Design and simulation of the initial bidirectional on-glass antenna”.
Simulated S11 magnitude and reflection phase of the proposed on-glass dual-band AMC designed for zero phase reflection at 2.1 GHz and 2.4 GHz.

Figure 9 Long description
Two overlaid line plots share the same horizontal axis. The horizontal axis label is, Frequency (GHz), with tick labels at 1, 1.5, 2, 2.1, 2.4, 3, 3.5 and 4. The left vertical axis label is, S one one (dB). The scale runs from minus 50 to 0, with tick labels at minus 50, minus 40, minus 30, minus 20, minus 10 and 0. One curve stays near 0 for most frequencies and forms two narrow dips: one dip centered near 2.1 GHz reaching about minus 50 and a second dip centered near 2.4 GHz reaching about minus 50. The right vertical axis label is, Phase (deg). The scale runs from minus 180 to 180, with tick labels at minus 180, minus 135, minus 90, minus 45, 0, 45, 90, 135 and 180. A second curve starts near 0 degrees at 1 GHz, decreases to about minus 45 degrees near 1.5 GHz, then rises sharply to about 180 degrees near 2.1 GHz. It then drops sharply to about minus 180 degrees just after 2.1 GHz, rises again to about 180 degrees near 2.4 GHz, then drops sharply to about minus 180 degrees just after 2.4 GHz. From about 2.5 GHz to 4 GHz, the curve increases gradually from about minus 180 degrees to about minus 90 degrees.
Unidirectional on-glass antenna with integrated AMC
After verifying the AMC unit cell as a near-zero phase shift reflecting element through HFSS simulation, a 5 × 5 array (Fig. 8(b)) was integrated with the bidirectional antenna from “Design and simulation of the initial bidirectional on-glass antenna”. The resulting unidirectional on-glass antenna with AMC reflector was then simulated, fabricated, and measured to evaluate its performance, as detailed in the following subsections.
Simulation, fabrication, and measurement of the unidirectional on-glass antenna
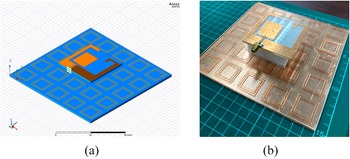
The bidirectional on-glass antenna from the section “Design and simulation of the initial bidirectional on-glass antenna” was integrated with the dual-band AMC of the subsection “AMC simuation results” to enhance gain and achieve a unidirectional radiation pattern. Figure 10(a) shows the antenna–AMC configuration modelled in Ansys HFSS, where the antenna is centered above the AMC array at a distance of 16 mm (≈0.112λ at 2.1 GHz). This spacing and alignment were optimized to ensure the reflected wave constructively reinforces forward radiation across the operating bands. A photograph of the fabricated prototype is presented in Fig. 10(b). The required separation between the antenna and the AMC was maintained using an expanded polyethylene foam spacer. Owing to its high air content, the foam exhibits an effective relative permittivity close to unity, resulting in negligible electromagnetic perturbation while providing sufficient mechanical stability. Alternative solutions, such as discrete plastic spacers creating an air gap, were considered; however, these would locally disturb the electromagnetic fields and partially obstruct the AMC unit cells. For practical deployment, the proposed concept is compatible with dual-pane architectural glazing, where the window frame naturally defines a stable air gap between two glass panes, allowing the antenna and AMC to be implemented on separate panes without the need for a foam spacer. In contrast to the SubMiniature version A (SMA) connector used in this prototype, the antenna can be fed using a 50 Ω coplanar waveguide or a slim coaxial cable routed from the rear side of the glass substrate and connected to an IoT board housed within the frame of the glass panel. The integrated structure was then measured in an anechoic chamber to validate the simulated performance across the targeted frequency bands.
(a) Simulated model of the unidirectional on-glass antenna with integrated AMC and (b) fabricated prototype of the unidirectional on-glass antenna.

Simulation and measurement results of proposed unidirectional antenna
Figure 11(a) shows the measurement setup for S 11 and radiation pattern evaluation in the anechoic chamber, while Fig. 11(b) compares the simulated and measured |S 11| of the antenna integrated with the AMC, confirming good impedance matching across the frequency band of interest. Figures 12(a) and 12(b) present the simulated and measured gain at 2.1 GHz and 2.4 GHz, respectively. The simulated radiation efficiency is 69.18% at 2.1 GHz and 76.26% at 2.4 GHz. The measured radiation patterns agree well with simulations, with only minor deviations at Φ = 90° at 2.4 GHz, likely caused by the antenna test fixture. Figure 13 presents the simulated surface current distribution of the proposed antenna integrated with AMC at 2.1 GHz, 2.2 GHz, and 2.4 GHz, illustrating its operating principle in a manner consistent with the earlier standalone analysis. At 2.1 GHz, the surface current is primarily concentrated along the left arm of the asymmetric coplanar ground. As the frequency increases, the current gradually shifts toward the right arm of the coplanar ground structure.
(a) S-parameter and radiation pattern measurement in an anechoic chamber and (b) simulated vs measured |S11| of the proposed on-glass antenna integrated with the AMC reflector.

Figure 11 Long description
A measurement setup with a rectangular frame structure in the foreground and a vertical support pole. A small label, a, appears below the image. The image B showing a line graph with two plotted curves and a legend. A small label, b, appears below the graph. The x-axis is labeled, Frequency (gigahertz), with tick labels at 1, 1.5, 2, 2.5, 3, 3.5 and 4. The y-axis is labeled, S subscript 11 (decibel), with tick labels at 0, minus 5, minus 10, minus 15, minus 20, minus 25, minus 30, minus 35, minus 40 and minus 45. The legend lists Simulation (HFSS) and Measurement. The Simulation (HFSS) curve starts near 0 decibel at 1 gigahertz, drops to about minus 10 decibel near 1.5 gigahertz, rises to about minus 5 decibel near 1.7 gigahertz, then drops to about minus 20 decibel near 2.2 gigahertz. It rises to about minus 10 decibel near 2.3 gigahertz, drops again to about minus 20 decibel near 2.5 gigahertz, then rises to about minus 5 decibel near 3 gigahertz and stays between about minus 2 and minus 6 decibel from 3 to 4 gigahertz. The Measurement curve starts near 0 decibel at 1 gigahertz, drops to about minus 35 decibel near 1.5 gigahertz, rises to about minus 5 decibel near 1.7 gigahertz, then drops to about minus 30 decibel near 2.0 gigahertz. It rises to about minus 5 decibel near 2.2 gigahertz, drops to about minus 25 decibel near 2.5 gigahertz, then rises to about minus 5 decibel near 3 gigahertz and stays between about minus 2 and minus 6 decibel from 3 to 4 gigahertz. Two vertical shaded bands are drawn over the frequency range, one centered near 2.0 gigahertz and one centered near 2.5 gigahertz.
Simulated and measured radiation pattern of the proposed antenna integrated with the AMC at (a) 2.1 GHz and (b) 2.4 GHz.

Figure 12 Long description
Two polar line plots labeled, phi equals 0 degree and, phi equals 90 degree. A label below indicates, a. Each plot overlays two series labeled, Simulation and Measurement. The angular axis is angle in degrees, marked from 0 to 345 in steps of 15. The radial scale is labeled with tick values 0, minus 3, minus 6, minus 9, minus 12 and minus 15. In the phi equals 0 degree plot, both series peak near 0 at 0 degrees and drop toward about minus 12 to minus 15 near 180 degrees. In the phi equals 90 degree plot, both series peak near 0 at 0 degrees and show a narrow feature near 180 degrees close to the minus 12 to minus 15 region. The image B showing two polar line plots labeled, phi equals 0 degree and, phi equals 90 degree. A label below indicates, b. Each plot overlays two series labeled, Simulation and Measurement. The angular axis is angle in degrees, marked from 0 to 345 in steps of 15. The radial scale is labeled with tick values 0, minus 3, minus 6, minus 9, minus 12 and minus 15. In the phi equals 0 degree plot, both series peak near 0 at 0 degrees and drop toward about minus 12 to minus 15 near 180 degrees, with a small narrow loop near 180 degrees. In the phi equals 90 degree plot, both series peak near 0 at 0 degrees and the Measurement series shows a deeper narrow feature near 180 degrees than the Simulation series, with both series close to the minus 12 to minus 15 region.
Simulated maximum surface current magnitude of the proposed antenna with the AMC reflector at (a) 2.1 GHz, (b) 2.2 GHz, and (c) 2.4 GHz.

Figure 13 Long description
A showing a heatmap distribution on an antenna layout, with the feed line entering from the bottom into a central square conductor region and surrounding trace patterns. A vertical color scale at the right is labeled, Current Magnitude, with tick labels 0, 5, 10, 15, 20, 25 and 30, with no unit shown. The highest mapped level is at the feed line and at the feed junction into the central conductor, reaching the top of the scale near 30. Lower mapped levels cover the central square region and parts of the surrounding traces. B showing the same antenna layout and the same, Current Magnitude, scale with tick labels 0, 5, 10, 15, 20, 25 and 30, with no unit shown. The highest mapped level is again at the feed line and feed junction, reaching near 30. A band of higher levels extends along a perimeter segment of the central conductor and along one vertical perimeter segment, while the central square region remains at lower levels. C showing the same antenna layout and the same, Current Magnitude, scale with tick labels 0, 5, 10, 15, 20, 25 and 30, with no unit shown. The highest mapped level is at the feed line and feed junction, reaching near 30. An additional localized high level region appears on a corner segment of the central conductor away from the feed, while the rest of the central square region and surrounding traces remain at lower levels.
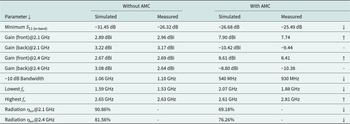
The discrepancies in the measured S-parameters can be attributed to the presence of the measurement cable, minor fabrication tolerances in the AMC concentric square rings, and slight deviations in the antenna-to-AMC spacing from the designed 16 mm as illustrated in Fig. 14. A detailed comparison of simulated and measured antenna parameters, both with and without the AMC, is provided in Table 3. The simulated −10 dB bandwidth is 540 MHz, whereas the measured bandwidth is 930 MHz, covering 1.88–2.81 GHz and thus encompassing the 1.9 GHz and 2.1 GHz NB-IoT bands as well as the 2.4 GHz WiFi band. A reduction in bandwidth is observed compared to the standalone bidirectional antenna, though further optimization of the AMC design could mitigate this effect. Overall, the results confirm that the proposed AMC-integrated on-glass antenna offers wideband operation with enhanced forward gain, establishing it as a strong candidate for high-gain, unidirectional on-glass antenna solutions in IoT and smart building applications.
Main sources of discrepancies between simulation and measurement: (a) cable effects, (b) AMC fabrication imperfections, and (c) antenna-to-AMC spacing.

Simulated vs measured antenna parameters of the proposed on-glass antenna, without and with AMC reflector

Table 3 Long description
Parameters are listed for an on glass antenna in two conditions, without AMC and with AMC, each with simulated and measured columns. Minimum S11 in band is minus 31.45 dB simulated and minus 26.32 dB measured without AMC, and minus 26.68 dB simulated and minus 25.49 dB measured with AMC. Front gain at 2.1 GHz is 2.89 dBi simulated and 2.96 dBi measured without AMC, and 7.90 dBi simulated and 7.74 measured with AMC; back gain at 2.1 GHz is 3.22 dBi simulated and 3.17 dBi measured without AMC, and minus 10.42 dBi simulated and minus 9.44 measured with AMC. Front gain at 2.4 GHz is 2.67 dBi simulated and 2.69 dBi measured without AMC, and 8.61 dBi simulated and 8.41 measured with AMC; back gain at 2.4 GHz is 3.08 dBi simulated and 2.64 dBi measured without AMC, and minus 8.80 dBi simulated and minus 10.38 measured with AMC. The minus 10 dB bandwidth is 1.06 GHz simulated and 1.10 GHz measured without AMC, and 540 MHz simulated and 930 MHz measured with AMC. Lowest fo is 1.59 GHz simulated and 1.53 GHz measured without AMC, and 2.07 GHz simulated and 1.88 GHz measured with AMC; highest fo is 2.65 GHz simulated and 2.63 GHz measured without AMC, and 2.61 GHz simulated and 2.81 GHz measured with AMC. Radiation eta tot is reported only for simulated values: at 2.1 GHz, 90.86 percent without AMC and 69.18 percent with AMC; at 2.4 GHz, 81.56 percent without AMC and 76.26 percent with AMC.
Finally, the proposed antenna is compared with other transparent and on-glass antennas reported in the literature. The comparison is presented in Table 4. Reported transparent antennas with transparent radiator made of ITO [Reference Lin, Wu and Chang5, Reference Colombel, Castel, Himdi, Legeay, Vigneron and Motta Cruz8, Reference Roo-Ons, Shynu, Ammann, McCormack and Norton11] exhibit negative gain due to low power efficiency caused by the dielectric loss of the substrate and the conductive loss of the transparent radiator. In contrast, with metallic radiator, reported on-glass antennas provide positive gain values from approximately 5 dBi [Reference Sun, Muneer and Zhu12, Reference Li, Chen and Hu13]. For millimeter wave applications, reported on-glass antennas from [Reference Sun, Muneer and Zhu12] and [Reference Domínguez, Silva, Baghel, Albuquerque and Pinho14] can provide positive gain with metallic radiators. Compared to other reported on-glass antennas, it is observed that our proposed antenna is the only one which can cover the IoT frequency bands from 1.8 GHz to 2.45 GHz bands in the bidirectional case. For the directional case with an integrated AMC reflector, our proposed antenna can still cover the operating frequency from 2.07 to 2.61 GHz with a significant gain improvement up to 5.7 dB. By further optimizing the AMC unit cell, the bandwidth of the unidirectional antenna can be further increased which is subject to future work.
Comparison of the proposed on-glass antenna with previous studies in literature

Table 4 Long description
Columns list reference, operation frequency, antenna size in cubic millimeters, substrate, radiator, start and stop frequency range, and bore sight antenna gain in dBi. Reference 7 operates at 2.1 and 8.25 GHz with size 50 by 17 by 1.1 on glass using ITO, with ranges 1.82 to 2.5 GHz and 4.66 to 11.84 GHz, and gains minus 0.167 at 2.1 GHz and minus 0.145 at 5.9 GHz. Reference 10 operates at 5.8 GHz on Willow Glass using ITO, range 4.5 to 6.1 GHz, gain minus 0.9 at 5.8 GHz, and the size cell is shown as not available. Reference 19 operates at 5.0 GHz with size 50 by 50 by 1.1 on glass using ITO, range 1.0 to 7.0 GHz, gain minus 4 at 5.0 GHz. Reference 20 operates at 28 GHz with size 50 by 50 by 3.2 on vehicle window glass using copper, range 26 to 30 GHz, gain 5.0 at 28 GHz. Reference 21 operates at 5.8 GHz with size 50 by 40 by 1 on glass using mesh grid, range 3.08 to 6.02 GHz, gain 5.01 at 5.8 GHz. Reference 5 operates at 2.1 and 3.6 GHz with size 50 by 50 by 0.5 on glass using frame structure MMC film, with ranges 1.9 to 2.4 GHz and 3.4 to 4.1 GHz, and gains minus 9.5 at 2.1 GHz and minus 6.1 at 3.6 GHz. Reference 6 operates at 1.17 and 1.58 GHz with size 180 by 180 by 5.1 on vehicle sun roof glass using printed copper metal mesh, with ranges 1.16 to 1.18 GHz and 1.55 to 1.60 GHz, and gains 4.4 at 1.17 GHz and 5.5 at 1.58 GHz. The row labeled, This work lists operation at 2.1 GHz with size 60 by 60 by 3 on glass using copper, range 1.53 to 2.63 GHz, and gains 2.96 at 2.1 GHz and 2.69 at 2.4 GHz.
Conclusion
In this work, a wideband on-glass antenna integrated with an AMC reflector was proposed. The on-glass unidirectional antenna was designed, fabricated, and experimentally validated for potential IoT and smart building applications. Five commonly used architectural glass types were characterized for the dielectric properties. A 3 mm clear glass substrate was selected as the substrate material. The antenna, a rectangular monopole with an asymmetric coplanar ground, was designed in Ansys HFSS. The antenna was realized by cutting copper tape to the specified design and mounting it on the glass substrate. The antenna prototype was measured in an anechoic chamber to verify the design and simulation. The bidirectional design which is an optimized version of a previous work achieved a 1.10 GHz impedance bandwidth with high radiation efficiency and approximately 3 dBi gain, suitable for applications requiring coverage on both sides of the glass. For unidirectional operation with higher gain and suppressed back radiation, the antenna was integrated with a dual-band AMC reflector, boosting the gain to 7.74 dBi at 2.1 GHz and 8.41 dBi at 2.4 GHz while effectively reducing backward radiation. Simulation and measurement results were in close agreement, validating the proposed design. With its wide bandwidth, high efficiency, and flexibility for bidirectional or unidirectional operation, the AMC-integrated on-glass antenna is a promising candidate for next-generation IoT-enabled smart building elements. For real-world applications, such as double-glazed windows, the air gap between the glass panes can replace the foam spacer used between the antenna and the AMC. Future work will therefore focus on co-optimizing the antenna and AMC geometries for such integrated glass assemblies, as well as investigating transparent conductive materials, such as ITO, to realize fully see-through antenna and AMC structures for seamless integration into architectural glass.
Acknowledgements
The authors gratefully acknowledge the Program Management Unit for Competitiveness (PMUC), Thailand, for funding this research through the PMUC Glassense Project (Grant No. C05F670047) at the High Frequency Systems (HFS) Laboratory, King Mongkut’s University of Technology North Bangkok (KMUTNB). We extend our sincere thanks to our industrial partner, Thai Techno Glass Group Public Company Limited, for their valuable support. We also thank CADFEM Thailand Company Limited for providing the Ansys HFSS software license used in this study. Additional support was received from the KMUTNB postdoctoral research program under contract No. KMUTNB-Post-67-10.
Competing interests
The authors declare none.

Muhammad Uzair received his B.Sc. in Mechatronics Engineering from Air University, Islamabad, Pakistan in 2018, and his M.Eng. in Electrical and Software System Engineering from The Sirindhorn International Thai-German Graduate School of Engineering (TGGS), King Mongkut’s University of Technology North Bangkok (KMUTNB), Thailand in 2022. He also participated in an exchange program at RWTH University, Aachen, Germany, conducting research on AMC metasurfaces. He is currently pursuing a doctoral degree at the High Frequency Systems Laboratory (HFS), TGGS, KMUTNB. His research interests include planar antennas, metasurfaces, antenna-on-glass technology, and innovative solar antennas.

Juin Acharjee received her Ph.D. from the National Institute of Technology, Durgapur in 2020. She was a postdoctoral research fellow in 2024 at the Sirindhorn International Thai-German Graduate School of Engineering, King Mongkut’s University of Technology North Bangkok, Thailand, and is currently affiliated with the Department of ECE, St. Thomas’ College of Engineering and Technology, Kolkata, West Bengal. She has authored or co-authored over 30 refereed international journal papers and holds an international patent. Her research focuses on circularly polarized antennas, MIMO antennas for sub-6 GHz and mm-wave applications, and microstrip antenna performance enhancement using frequency selective surfaces, metasurfaces, and microwave absorbers. Dr Acharjee has received the IEEE EWCIS 2020 Best Paper Award and CODEC 2019 Best Poster Award. She serves as a reviewer for journals including IET Microwaves, PIER, Microwave and Optical Technology Letters, AEU, and the International Journal of Communication Systems.

Thipamas Phakaew was born in Nan Province, Thailand in 1992. She received the B.Eng. degree in Electrical Engineering (Telecommunication) and M.Eng. degree in electrical and information engineering from King Mongkut’s University of Technology North Bangkok (KMUTNB), Thailand in 2015 and 2018, respectively. She is currently affiliated with the High Frequency Systems Laboratory (HFS) at the Sirindhorn International Thai-German Graduate School of Engineering (TGGS), KMUTNB, and pursuing her PhD in Electrical &
Software System Engineering under the NSTDA-KMUTNB gold medal scholarship. Her current research interest is antenna design for radar applications and communication systems.

Akkarat Boonpoonga received the B.Eng. degree in electrical engineering from the King Mongkut’s University of Technology North Bangkok (KMUTNB), Bangkok, Thailand, in 2002, and the M.Eng. degree in telecommunications engineering and the D.Eng. degree in electrical engineering from the King Mongkut’s Institute of Technology Ladkrabang (KMITL), Bangkok, in 2004 and 2008, respectively. He is currently an Associate Professor with the Department of Electrical and Computer Engineering, Faculty of Engineering, KMUTNB. His research interests include ground-penetrating radar (GPR), radar systems, radar target identification, chipless RFID systems, and signal processing for EM applications. Dr Boonpoonga is a member of the ECTI Association. He was a Board Committee Member of the ECTI Association, Thailand, from 2016 to 2017 and from 2020 to 2021.

Dirk Heberling received the Ph.D. degree (Dr-Ing.) in 1993. In the same year, he joined IMST GmbH, Kamp-Lintfort, Germany, where he established a new antenna section and later served as Head of the Antennas Department from 1995 to 2003. From 2003 to 2008, he led the Department of Information and Communication Systems at IMST GmbH. In 2008, he moved to RWTH Aachen University, where he is currently Chair of High Frequency Technology and Head of the Institute. Since 2016, he has also been Head of the Fraunhofer Institute for High Frequency Physics and Radar Techniques (FHR). He has been actively involved in several European antenna competence projects (COST 260, COST 284, IC0603, IC1102), serving as German delegate and secretary. He is a member of VDE, EuCAP committees, AMTA (President in 2018), and was a member of the DFG Technical Review Board from 2016 to 2019.

Suramate Chalermwisutkul received the Dipl.-Ing. and Dr-Ing. degrees in Electrical Engineering from RWTH Aachen University, Germany, in 2001 and 2007, respectively. In 2007, he joined The Sirindhorn International Thai-German Graduate School of Engineering (TGGS), King Mongkut’s University of Technology North Bangkok (KMUTNB), where he established the High Frequency Systems Laboratory and has served as its Head since inception. He was the Communication Subsystem Manager of the KNACKSAT project, which developed and launched the first Thai-made satellite in 2018 via the SpaceX Falcon 9 (SSO-A mission). He has been a visiting lecturer at RWTH Aachen University, teaching a seminar on electromagnetic sensors, and since 2022 has served as an external adjunct academic at the Institute of High Frequency Technology (IHF), RWTH Aachen University. He has been Area Chair in electromagnetics, microwave, and antennas of the ECTI Association since 2021. His research interests include RF systems for CubeSats, smart antennas, reconfigurable RF systems, and electromagnetic sensors.