Introduction
Ultra-wideband (UWB) antennas have attracted significant attention due to their capability to support high data rates, fine spatial resolution, and reliable performance over a wide frequency spectrum. Among various UWB radiators, Vivaldi antennas are particularly attractive owing to end-fire radiation characteristics, broad impedance bandwidth, stable radiation patterns, and planar configuration.
As a result, such systems have been widely employed in applications such as microwave imaging, non-destructive testing (NDT), ground-penetrating radar, through-wall imaging, satellite communications, and emerging wireless systems [Reference Wang, Crocco, Li and Cavagnaro1–Reference Ramyasree and Suman5].
The Vivaldi antenna was originally introduced by Gibson as a coplanar tapered slot antenna [Reference Gibson6]. Subsequent developments led to the antipodal Vivaldi antenna (AVA), which offers improved impedance bandwidth and gain performance [Reference Gazit7]. AVAs generally exhibit higher cross-polarization levels and larger electrical dimensions compared to conventional tapered slot Vivaldi antennas (TSVAs), which limits the suitability for compact and portable systems [Reference Kim and Chang8, Reference Vu, Dooghabadi, Sudalaiyandi, Hjortland, Næss, Lande and Hamran9]. In imaging and NDT applications, antenna performance is strongly influenced by operating frequency, as lower frequencies provide deeper penetration in lossy media, whereas higher frequencies offer improved spatial resolution. This trade-off necessitates antennas with UWB operation and stable radiation characteristics across a wide frequency range [Reference Akhtar10–Reference Hasar12]. A key challenge associated with UWB antennas is electromagnetic (EM) interference from coexisting narrowband wireless systems, such as IEEE 802.16 WiMAX (3.3–3.8 GHz), IEEE 802.11 WLAN (5.15–5.85 GHz), and X-band satellite uplinks (7.9–8.4 GHz). Such interference can significantly degrade system performance and imaging accuracy. Conventional mitigation approaches based on external band-stop filters increase system complexity, insertion loss, and overall size. Consequently, antenna-integrated band-notched techniques have been extensively investigated, including the incorporation of slots, parasitic elements, and resonant structures within the radiating or ground planes [Reference Saleh, Saeidi and Timmons13–Reference Xu, Wang, Ge, Wang and Wu22]. Various resonator-based approaches employing split-ring resonators (SRRs), complementary SRRs (CSRRs), stepped-impedance resonators, and slot configurations have been reported to achieve single-, dual-, and multi-band rejection [Reference Chaabane and Guerroui23–Reference Yang26].
In addition to interference suppression, gain enhancement remains a critical issue for compact Vivaldi antennas, particularly at lower frequencies. Several techniques, including edge corrugations [Reference Paul and Islam27], tapered slot profile optimization [Reference Wang28], aperture shaping [Reference Moosazadeh and Kharkovsky29], and parasitic element loading [Reference Nassar and Weller30], have been proposed to improve radiation performance. Although dielectric lenses and metamaterial-based superstructures can significantly enhance gain, such structures often increase antenna size and structural complexity, thereby limiting applicability in portable imaging and NDT systems [Reference Islam, Mahmud, Kibria and Samsuzzaman31, Reference Cicchetti, Cicchetti, Faraone, Foged and Testa32, Reference Cicchetti, Cicchetti, Faraone and Testa33]. More recently, metamaterial integration has emerged as an effective approach for compact gain enhancement. Zero-index metamaterials (ZIMs) and epsilon-near-zero structures improve end-fire radiation by enabling controlled wave propagation and field collimation [Reference Bhaskar, Johari, Akhter and Akhtar34–Reference Sun, Chen and Qing36, Reference Shi39, Reference Jaiswal, Bhattacharya and Kumar40, Reference Saeidi, Ismail, Noghanian, Alhawari, Abbasi and Imran53]. In particular, anisotropic zero-index metamaterials (AZIMs) provide additional degrees of freedom for tailoring EM responses, allowing gain enhancement without increasing antenna dimensions [Reference Das and Mitra37, Reference Portosi38]. Nevertheless, compact TSVAs operating over an ultra-wide frequency range extending down to 1 GHz while maintaining high directivity and stable radiation characteristics remain relatively unexplored.
Motivated by the above challenges, this paper proposes a compact corrugated double-tapered slot Vivaldi antenna (DTSVA) integrated with spatially distributed resonant elements and AZIM loading. The proposed antenna is fabricated on a low-cost FR-4 substrate (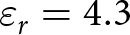 $\varepsilon_r = 4.3$,
 $\tan\delta = 0.025$) with overall dimensions of
 $110 \times 84 \times 0.8~\mathrm{mm}^3$ and achieves UWB operation from 1 to 20 GHz with triple band-notched characteristics to suppress interference from WiMAX, WLAN, and X-band satellite communication systems. Furthermore, corrugation and AZIM loading are employed to enhance antenna gain while preserving compact size and stable radiation behavior, making the proposed design well-suited for portable microwave imaging and NDT applications.
Proposed antenna design and configuration
The proposed methodology follows a systematic design optimization validation framework for the development of a compact corrugated DTSVA fabricated on a low-cost FR-4 substrate.
The layout of the proposed antenna is illustrated in Figure 1. The overall structure is oriented in the  $x$–
 $y$ plane, with the feeding network implemented on the back side of the substrate to facilitate compact integration. The antenna is based on a double exponential tapered slot geometry characterized by a tapered length
 $TL$ and a tapered width
 $TW$. The impedance profile of the tapered slot aperture follows the classical exponential formulation for tapered slot antennas [Reference Gibson6], and is given by Equation 1
 \begin{equation}
y = A e^{mx} - \left(-\frac{W_o}{2} + A\right),
\end{equation}
where “ $m$” is computed using Equation 2.
 \begin{equation}
m = \frac{1}{TL} \ln \left( \frac{TW/2 - (W_o/2 - A)}{A} \right),
\end{equation}
constant  $A = 0.55$,
 $W_o$ is the initial slotline width according to 100
 $\Omega$. To enhance radiation characteristics and improve impedance matching, a circular aperture of diameter
 $2R_c$ is introduced at the center of the tapered slot.
Geometry of the proposed corrugated DTSVA: (a) top view showing the tapered slot, corrugations, loading resonator, and AZIM unit-cell elements; and (b) bottom view illustrating the microstrip feed configuration with key dimensions.

Figure 1 Long description
The image shows two views of a corrugated double-tapered slot Vivaldi antenna. The left side illustrates the top view, featuring the tapered slot, corrugations, loading resonator and AZIM unit-cell elements. Key dimensions such as tapered length (TL) and tapered width (TW) are marked. The right side presents the bottom view, highlighting the microstrip feed configuration with dimensions labeled, including W subscript 3, L subscript 2 and R subscript c. Both views are oriented in the x-y plane, with the feeding network on the back side of the substrate for compact integration.
The antenna is excited through a microstrip feed line consisting of two cascaded sections corresponding to 50 and 100  $\Omega$ transmission lines. A radial stub with radius
 $R_s$ and flare angle
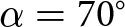 $\alpha = 70^\circ$ is employed to realize a smooth transition from the unbalanced microstrip line to the balanced slot line, thereby functioning as a wideband balun. To achieve triple band-notched characteristics, several resonant elements are incorporated on the top surface of the substrate. Each resonator is electromagnetically coupled to a different current path, enabling independent notch tuning. A CSRR etched beneath the radial stub suppresses the IEEE 802.16 WiMAX band (3.3–3.8 GHz). A pair of horizontally oriented U-shaped slots located below the 100
 $\Omega$ feed line rejects the IEEE 802.11 WLAN band (5.15–5.85 GHz), while a vertically oriented U-slot positioned beneath the 50
 $\Omega$ line near the input port suppresses the X-band satellite uplink band (7.9–8.4 GHz).
In addition, triangular corrugations are introduced along the tapered edges to enhance radiation performance at lower frequencies. An AZIM unit cell is embedded between the tapered arms to improve the peak realized gain without increasing the antenna size. While the AZIM loading primarily enhances gain above 4 GHz, the triangular corrugation significantly improves performance in the 1–3 GHz range. The combined design features result in a compact, high-performance UWB antenna with selective interference suppression, making it well suited for microwave imaging and NDT applications.
Triple-band notch DTSVA design: geometrical parameters and location of loaded resonators analysis
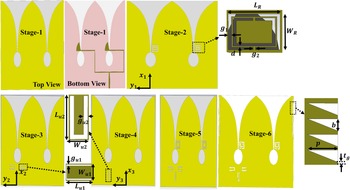
To achieve selective suppression of narrowband interferences within the UWB spectrum while maintaining good impedance matching, a progressive and systematic design methodology is adopted. The design evolution, illustrated in Figure 2 (Stages 1–6), demonstrates the step-by-step incorporation of resonant elements and structural modifications to realize triple band-notched characteristics along with improved radiation performance.
Evolution of the proposed antenna geometry through six design stages. Stage 1 shows the reference antenna (top and bottom views), Stage 2 introduces the CSRR for band rejection, Stage 3 and Stage 4 incorporate horizontal and vertical U-shaped slots, Stage 5 combines multiple notching elements, and Stage 6 further integrates triangular slit corrugations. Insets illustrate the detailed geometrical parameters of the CSRR, U-slots, and corrugation profile.
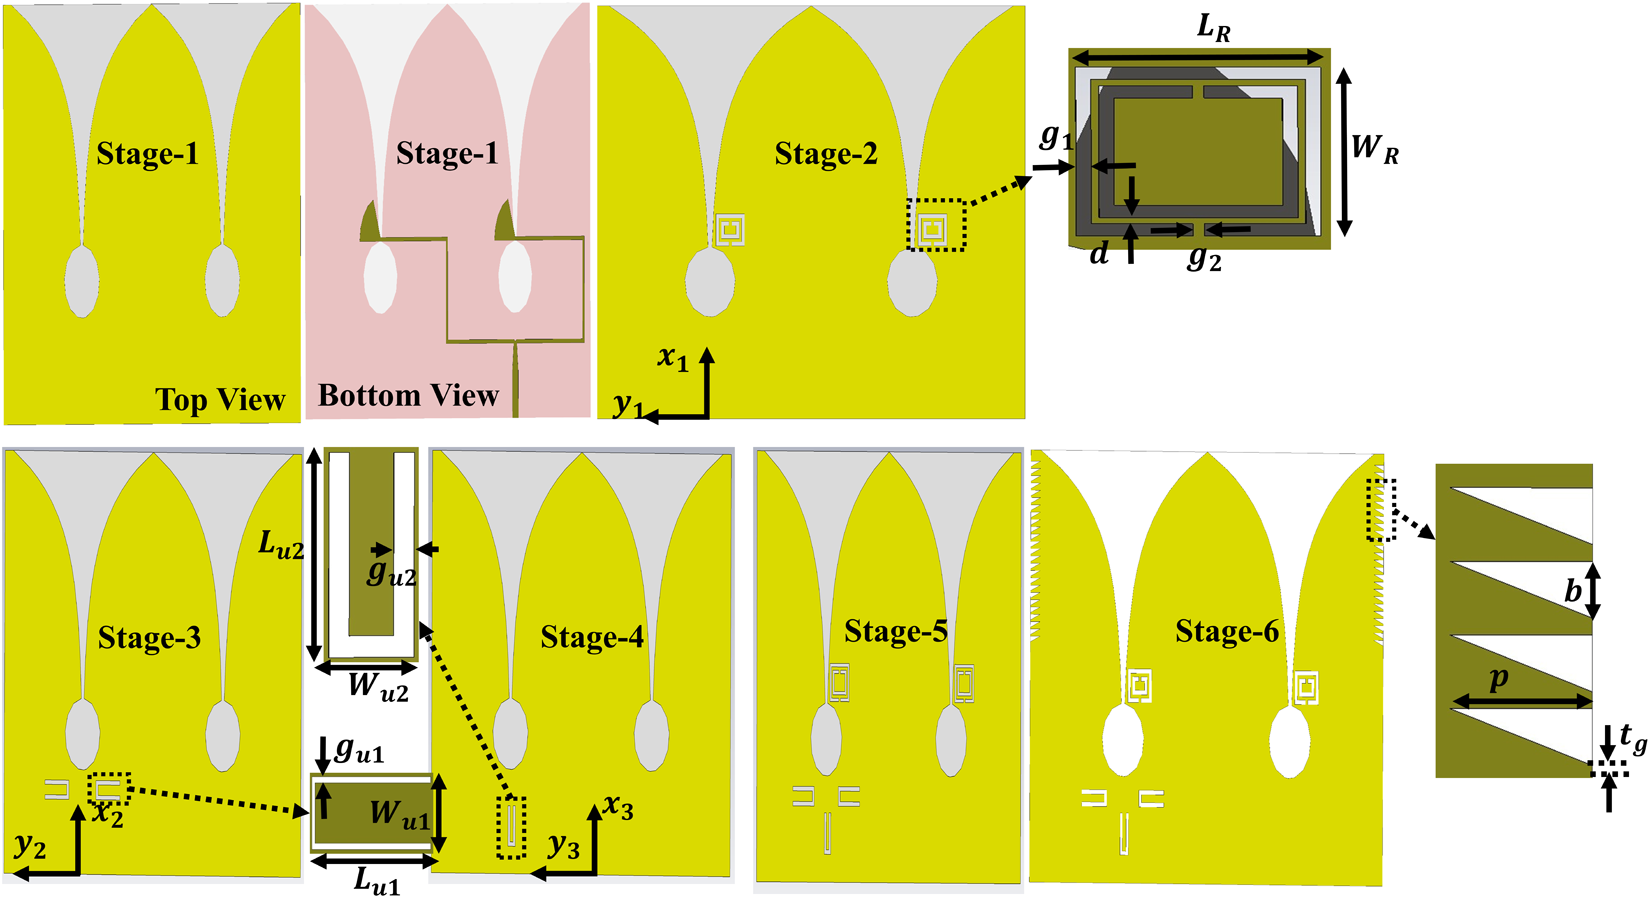
Figure 2 Long description
The image shows six stages of antenna design evolution. Stage 1 presents the reference antenna in top and bottom views. Stage 2 introduces a CSRR for band rejection. Stage 3 and Stage 4 incorporate horizontal and vertical U-shaped slots. Stage 5 combines multiple notching elements. Stage 6 further integrates triangular slit corrugations. Insets illustrate detailed geometrical parameters of the CSRR, U-slots and corrugation profile, including dimensions labeled as L subscript G, W subscript G, g and others.
Stage 1 represents the reference configuration corresponding to the basic DTSVA without any notching elements. This configuration provides stable UWB impedance matching over the 1–20 GHz frequency range, as shown in Figure 3, but remains vulnerable to interference from coexisting narrowband wireless systems. To mitigate this issue, a rectangular CSRR is integrated into the radiating surface in Stage 2, as shown in Figure 2.
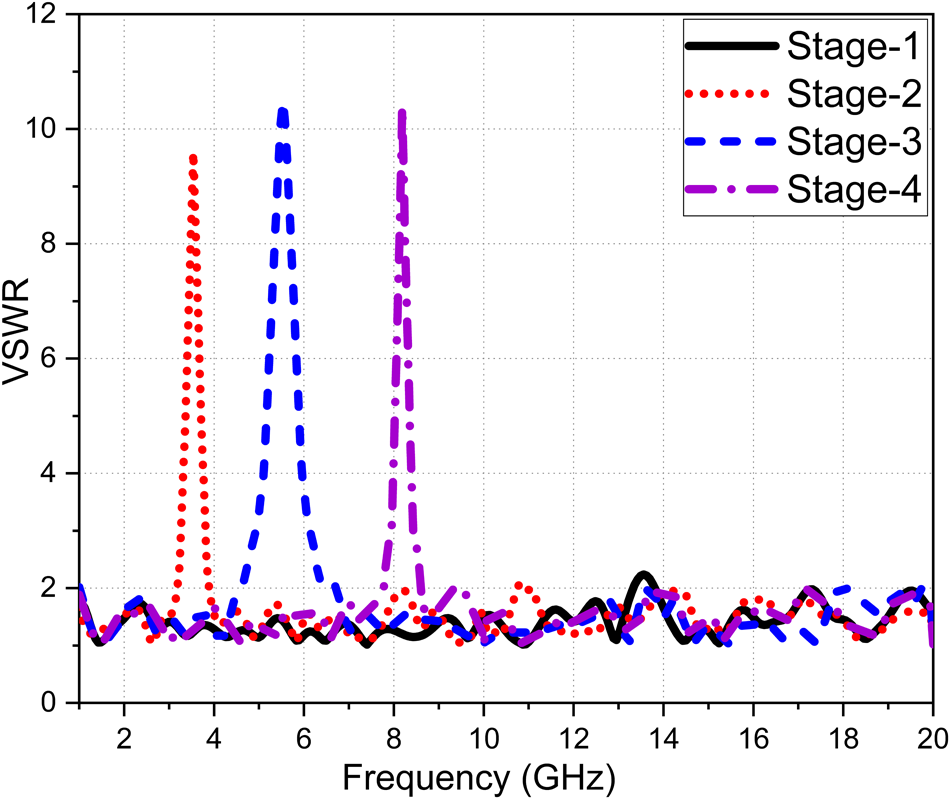
Variation of the simulated VSWR with operating frequency for the four design stages (Stage 1 to Stage 4).
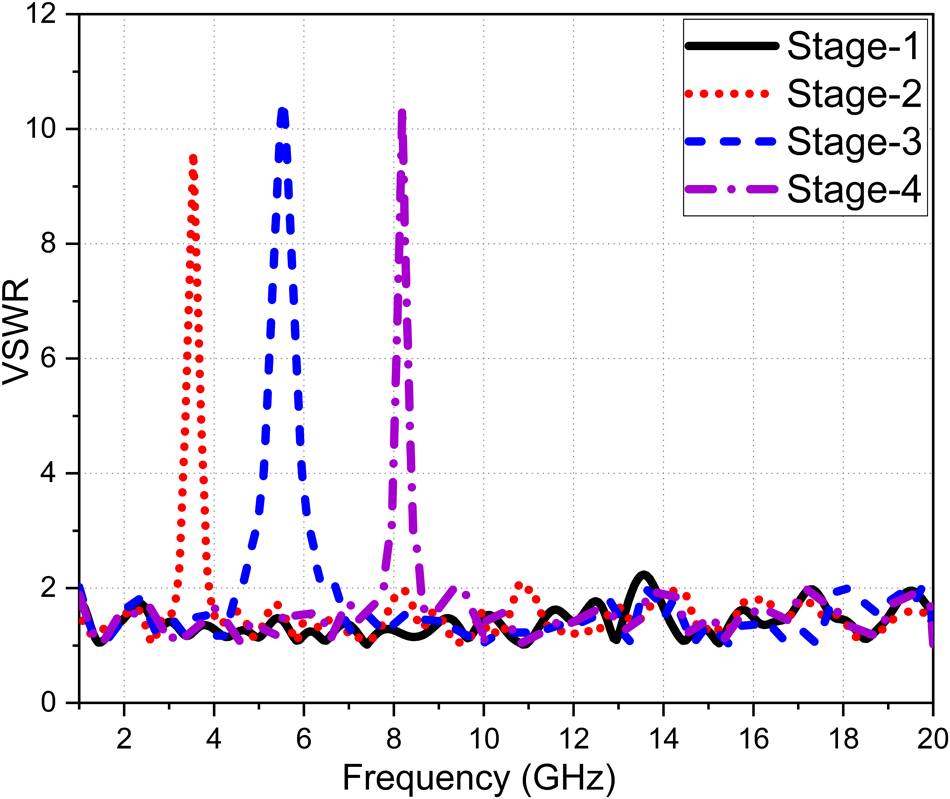
Figure 3 Long description
A line graph showing the variation of Voltage Standing Wave Ratio (VSWR) with frequency in gigahertz (GHz) for four design stages. The x-axis is labeled 'Frequency (GHz)' ranging from 1 to 20 and the y-axis is labeled 'VSWR' ranging from 0 to 12. Four curves are plotted: Stage-1 (solid black line), Stage-2 (dotted red line), Stage-3 (dashed blue line) and Stage-4 (dash-dotted purple line). Stage-1 maintains a stable VSWR close to 1 across the frequency range. Stage-2 shows a peak around 3 GHz. Stage-3 has a peak near 8 GHz and Stage-4 shows a peak around 10 GHz. The graph illustrates how each stage affects the VSWR across the frequency spectrum.
The CSRR is designed to suppress the IEEE 802.16 WiMAX band (3.3–3.8 GHz). The CSRR geometry is characterized by its outer length  $L_R$, width
 $W_R$, outer and inner slot gaps
 $g_1$, coupling strip width
 $g_2$, and inner strip width
 $d$. The resonant frequency
 $f_1$ of the CSRR can be approximately expressed using Equation 3 [Reference Marqués41, Reference Atallah and Hamad42].
 \begin{equation}
f_1 = \sqrt{\frac{1}{2\pi^3 r_o L_o C}},
\end{equation}
where  $L_o$ denotes the inductance per unit length between the annular slots,
 $C$ is the total capacitance of the resonator, and
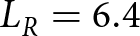
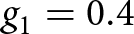
 $r_o$ is the mean radius of the CSRR. Although no closed-form expression directly correlates the CSRR dimensions with its resonant frequency, increasing the overall resonator size generally shifts the notched band toward lower frequencies. Using CST Microwave Studio (CST-MWS), the CSRR dimensions are optimized to
 $L_R = 6.4$ mm,
 $W_R = 5.5$ mm,
 $g_1 = 0.4$ mm, and
 $g_2 = d = 0.2$ mm, resulting in a sharp rejection band centered at 3.55 GHz.To generate the second and third notched bands corresponding to the IEEE 802.11 WLAN band (5.15–5.85 GHz) and the X-band satellite uplink (7.9–8.4 GHz), U-shaped slot resonators are incorporated into the antenna structure. As illustrated in Stage 3, a pair of horizontal U-shaped slots is etched beneath the 100
 $\Omega$ transmission line, while a vertically oriented U-shaped slot is positioned beneath the 50
 $\Omega$ feed line near the input port in Stage 4. The design of the U-shaped slots follows the condition that the effective slot perimeter is approximately equal to half of the guided wavelength at the desired notch frequency, given by Equation 4.
 \begin{equation}
P_{u1} = \frac{c}{2 f_2 \sqrt{\varepsilon_{\text{eff}}}}, \quad
P_{u2} = \frac{c}{2 f_3 \sqrt{\varepsilon_{\text{eff}}}},
\end{equation}
where  $P_{u1}$ and
 $P_{u2}$ represent the effective perimeters of the horizontal and vertical U-slots, respectively. The perimeters are defined via Equations 5 and 6.
 \begin{equation}
P_{u1} = 2(L_{u1} - g_{u1}) + (W_{u1} - 2g_{u1}),
\end{equation}
 \begin{equation}
P_{u2} = 2(L_{u2} - g_{u2}) + (W_{u2} - 2g_{u2}).
\end{equation}
The effective dielectric constant  $\varepsilon_{\text{eff}}$ is estimated using Equation 7 [Reference Pozar43].
 \begin{equation}
\varepsilon_{\text{eff}} = \frac{\varepsilon_r + 1}{2} +
\frac{\varepsilon_r - 1}{2}
\left(1 + \frac{12H_s}{W_m}\right)^{-1/2},
\end{equation}
where  $\varepsilon_r$ is the relative permittivity of the substrate,
 $H_s$ is the substrate thickness, and
 $W_m$ is the microstrip line width. Based on these relations, the effective perimeters required to realize notches at 5.5 and 8.15 GHz are approximately 15 and 11 mm, respectively,
 $g_{u1}$ and
 $g_{u2}$ fixed at 0.3 mm. Accordingly, the initial dimensions are selected as
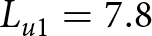 $L_{u1} = 7.8$ mm,
 $W_{u1} = 2.4$ mm and
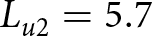 $L_{u2} = 5.7$ mm,
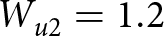 $W_{u2} = 1.2$ mm. Simulation results confirm the formation of two distinct rejection bands at the desired frequencies.
The spatial placement of the resonant elements plays a critical role in controlling the notch behavior. The CSRR is positioned at 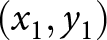 $(x_1, y_1)$, as shown in Stage 2 of Figure 2, to maximize coupling with the surface current distribution. The horizontal U-slot pair is placed at a distance
 $x_2$ beneath the 100
 $\Omega$ transmission line, while the vertical U-slot is located at a distance
 $y_3$ beneath the 50
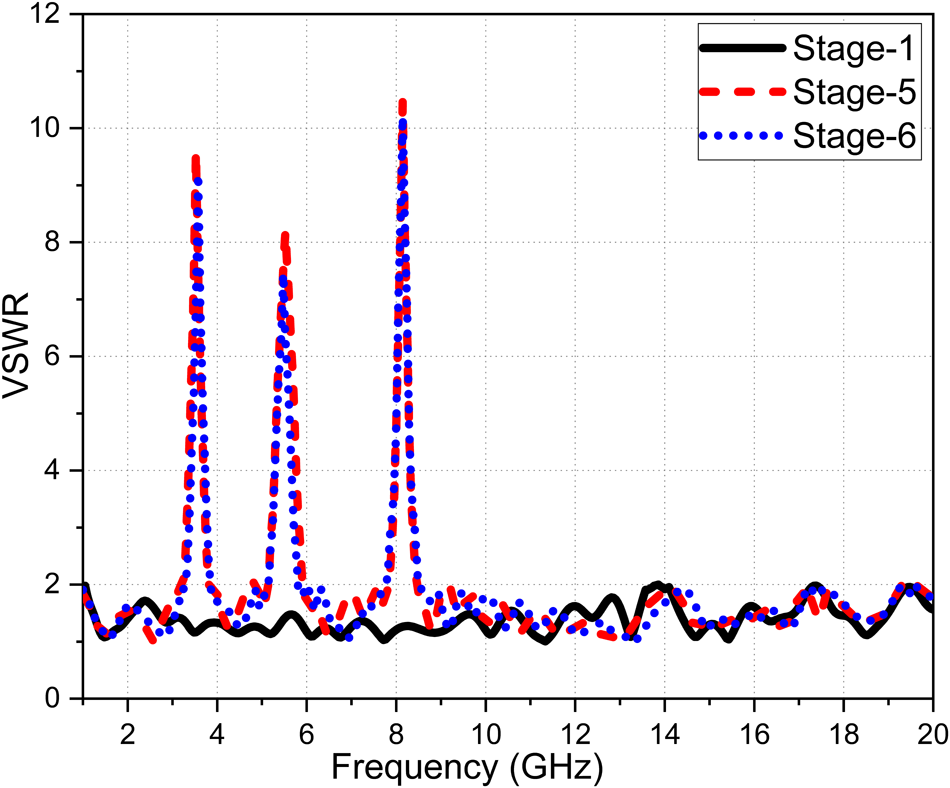
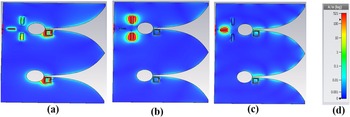
 $\Omega$ feed line. Figure 3 illustrates the evolution of the VSWR response through successive design stages. Stage 1 exhibits stable UWB impedance matching, whereas Stage 2 introduces a sharp notch around 3.5 GHz due to the CSRR loading. In Stage 3 and Stage 4, additional notches centered at 5.6 and 8.2 GHz are realized through the horizontal and vertical U-shaped slots, respectively. Outside the rejected bands, all stages maintain VSWR values below 2, confirming preserved UWB performance. Finally, Stage 5 integrates all three resonators, which are strategically positioned to ensure independent operation with minimal mutual coupling, thereby enabling effective triple band-notched behavior without degrading the UWB impedance characteristics. The VSWR responses of Stage 1, Stage 5, and Stage 6 are compared in Figure 4. The VSWR response of Stage 5 clearly demonstrates the formation of three sharp notched bands with minimal mutual coupling among the resonators. After introducing triangular trimming in Stage 6, the VSWR response remains nearly identical to that of Stage 5, indicating that the corrugations do not adversely affect the triple band-notched behavior or the overall UWB impedance matching. Figure 5 illustrates the simulated surface current distributions at the three notched frequencies. At 3.5 GHz, strong current confinement around the CSRR confirms its role in generating the WiMAX rejection band. At 5.6 GHz, intense currents are localized along the horizontal U-shaped slots, validating the WLAN notch mechanism. Similarly, at 8.2 GHz, the current concentration around the vertical U-shaped slot verifies effective suppression of the X-band interference.
Variation of the simulated VSWR with operating frequency for Stage 1, Stage 5, and Stage 6 antenna configurations.

Figure 4 Long description
A line graph comparing the variation of Voltage Standing Wave Ratio (VSWR) with frequency in gigahertz (GHz) for three antenna configurations: Stage-1, Stage-5 and Stage-6. The x-axis represents Frequency in gigahertz, ranging from 0 to 20. The y-axis represents VSWR, ranging from 0 to 12. The graph shows three curves: Stage-1 in solid black, Stage-5 in dashed red and Stage-6 in dotted blue. Stage-1 maintains a stable VSWR below 2 across the frequency range. Stage-5 and Stage-6 exhibit three sharp peaks, indicating notched bands, around 3.5 GHz, 5.6 GHz and 8.2 GHz, with VSWR values exceeding 10 at these frequencies. Outside these notched bands, Stage-5 and Stage-6 maintain VSWR values below 2, similar to Stage-1.
Surface current distribution at (a) 3.5 GHz, (b) 5.6 GHz, and (c) 8.2 GHz with the color scale shown in (d).

Figure 5 Long description
The image A shows surface current distribution at 3.5 gigahertz with highlighted areas around specific elements. The image B shows surface current distribution at 5.6 gigahertz with different highlighted areas. The image C shows surface current distribution at 8.2 gigahertz with distinct highlighted regions. The image D provides a color scale indicating the intensity of the current distribution, ranging from low to high values.
Equivalent circuit modeling of Stage 5 DTSVA incorporating three resonators
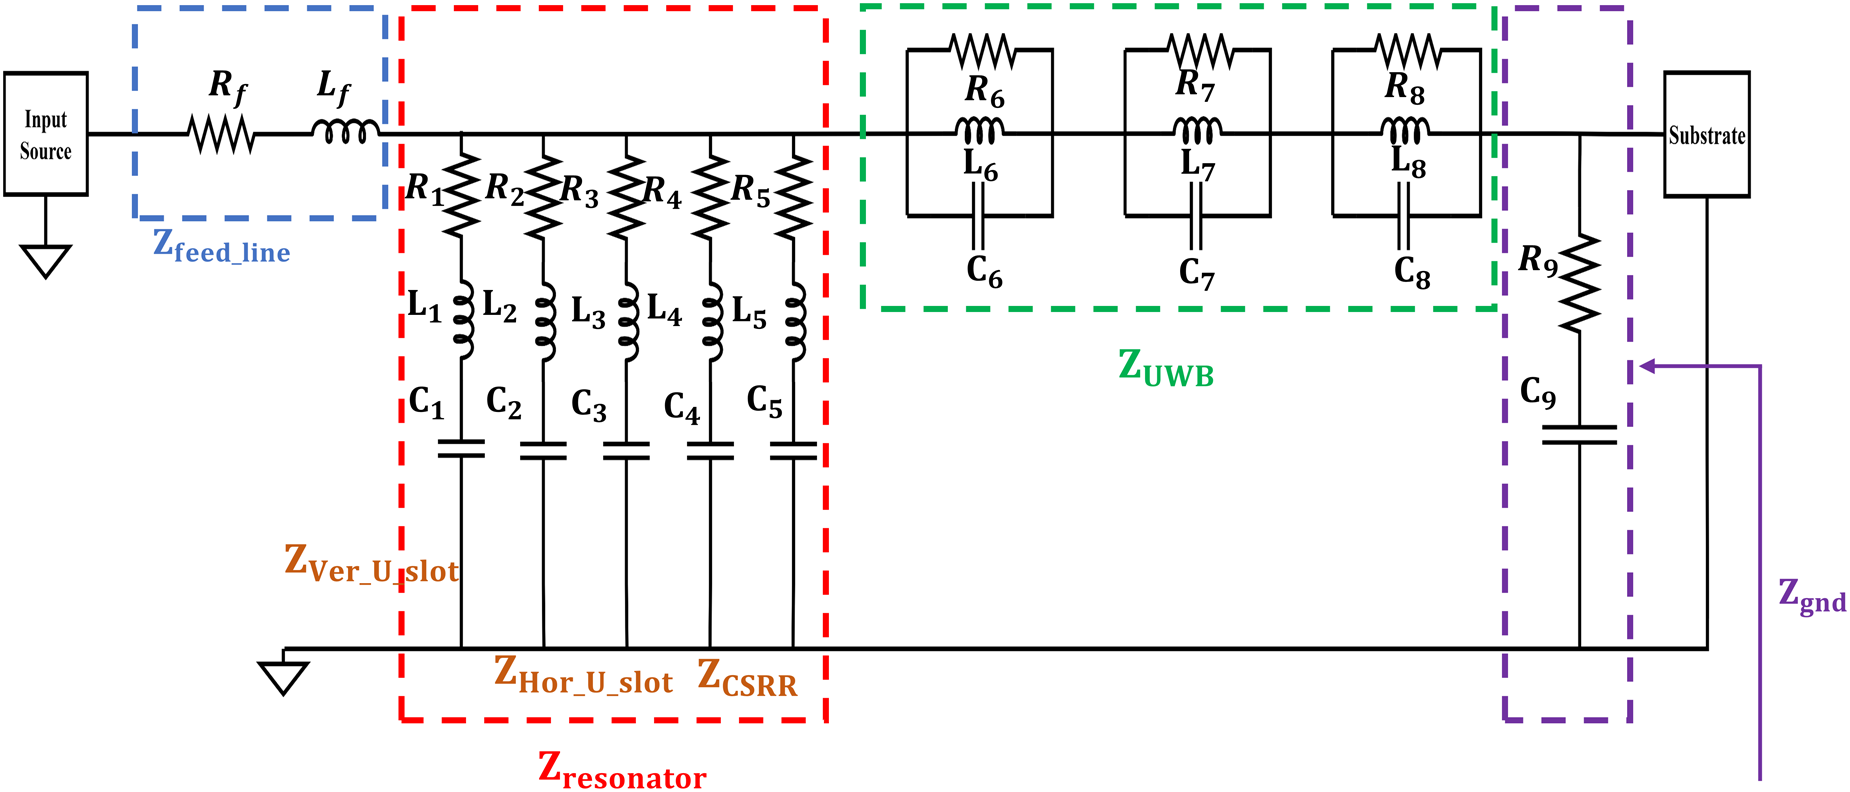
The equivalent circuit model of the Stage 5 antenna is illustrated in Figure 6. The overall structure comprises a grounded feed line, a resonating network, a UWB section and the substrate. The impedance of the feed line ( $Z_{\text{feed\_line}}$) is modeled using a series combination of resistance (
 $R_f$) and inductance (
 $L_f$). The resonating structure is represented by
 $Z_{\text{resonator}}$, which includes contributions from the horizontal U-slot, vertical U-slot, and CSRR.
Equivalent circuit model of the DTSVA with three resonators corresponding to Stage 5.

Figure 6 Long description
The diagram illustrates an equivalent circuit model comprising several components. The input source is connected to a feed line, modeled by a series combination of resistance R subscript f and inductance L subscript f, labeled as Z subscript feed line. The resonator section includes three resonators: Z subscript ver U slot, Z subscript hor U slot and Z subscript CSRR, each with inductors L subscript 1 to L subscript 5 and capacitors C subscript 1 to C subscript 5. The UWB section is represented by resistors R subscript 6 to R subscript 8 and capacitors C subscript 6 to C subscript 8, labeled as Z subscript UWB. The substrate is connected to the ground through Z subscript gnd, with resistors R subscript 9 and R subscript 10 and capacitors C subscript 9 and C subscript 10. The overall structure is grounded, showing the interconnected components and their respective labels.
The CSRR and U-shaped slots [Reference Chu and Yang56, Reference Zeain, Abu, Althuwayb, Alsariera, Al-Gburi, Abdulbari and Zakaria57] etched in the radiating patch are modeled as series RLC resonators connected in shunt with the feed line and the UWB impedance. Specifically, the vertical U-slot is modeled using ( $R_1$,
 $L_1$,
 $C_1$), while the paired horizontal U-slot is represented by (
 $R_2$,
 $R_3$,
 $L_2$,
 $L_3$,
 $C_2$,
 $C_3$). Similarly, the paired CSRR structure is modeled using (
 $R_4$,
 $R_5$,
 $L_4$,
 $L_5$,
 $C_4$,
 $C_5$). The UWB behavior of the antenna is characterized by a distributed impedance profile arising from the tapered Vivaldi structure. This behavior is approximated using an equivalent parallel RLC network connected in series with the feed line [Reference Paul, Rana, Azad, Nandi and Mohan54, Reference Lai, Lei, Xie, Ning and Yang55]. To capture the distributed impedance nature of the tapered Vivaldi profile, the equivalent lumped elements are subdivided into multiple parallel RLC sections, represented by
 $R_6$,
 $R_7$,
 $R_8$,
 $L_6$,
 $L_7$,
 $L_8$, and
 $C_6$,
 $C_7$,
 $C_8$. Finally, the substrate effect is modeled using an equivalent impedance (
 $Z_{\text{sub}}$), represented by resistance (
 $R_9$) and capacitance (
 $C_9$), accounting for dielectric losses and capacitive coupling.
The input impedance for the equivalent circuit is expressed via Equations 8–16.
 \begin{equation}
Z_{\text{input}} = Z_{\text{feed\_line}} + \left( Z_{\text{resonator}} \parallel Z_{\text{UWB}} \parallel Z_{\text{sub}} \right)
\end{equation}
where
 \begin{equation}
Z_{\text{feed\_line}} = R_f + j\omega L_f
\end{equation}
 \begin{equation}
Z_{\text{resonator}} = \left[ Z_{\text{Hor\_U\_Slot}} \parallel Z_{\text{Ver\_U\_Slot}} \parallel Z_{\text{CSRR}} \right]
\end{equation}
 \begin{equation}
Z_{\text{Hor\_U\_Slot}} = R_1 + j\omega L_1 - \frac{j}{\omega C_1}
\end{equation}
 \begin{equation}
Z_{\text{Ver\_U\_Slot}} = \left[ R_2 + j\omega L_2 - \frac{j}{\omega C_2} \right] \parallel \left[ R_3 + j\omega L_3 - \frac{j}{\omega C_3} \right]
\end{equation}
 \begin{equation}
Z_{\text{CSRR}} = \left[ R_4 + j\omega L_4 - \frac{j}{\omega C_4} \right] \parallel \left[ R_5 + j\omega L_5 - \frac{j}{\omega C_5} \right]
\end{equation}
 \begin{equation}
Z_{\text{UWB}} = \sum_{k=6}^{8}
\left( \frac{1}{R_k} + \frac{1}{j\omega L_k} + j\omega C_k \right)^{-1}
\end{equation}
 \begin{equation}
Z_{\text{sub}} = R_9 - \frac{j}{\omega C_9}
\end{equation}
 \begin{equation}
Z_{\text{gnd}} = j Z_{\text{sub}} \tan(\beta \cdot \text{thickness})
\end{equation}
where 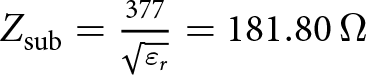 $Z_{\text{sub}} = \frac{377}{\sqrt{\varepsilon_r}} = 181.80\,\Omega$ represents the characteristic impedance of the short-circuited transmission line, and
 $\beta = \frac{\omega \sqrt{\varepsilon_r}}{c} = 0.69 \times 10^{-0.8} \, \omega \,\text{rad/m}$ is the phase constant of the wave in the substrate.
The reflection coefficient is obtained by using Equation 17.
 \begin{equation}
S_{11} = \frac{Z_{\text{input}}(\omega) - 50}{Z_{\text{input}}(\omega) + 50}
\end{equation}
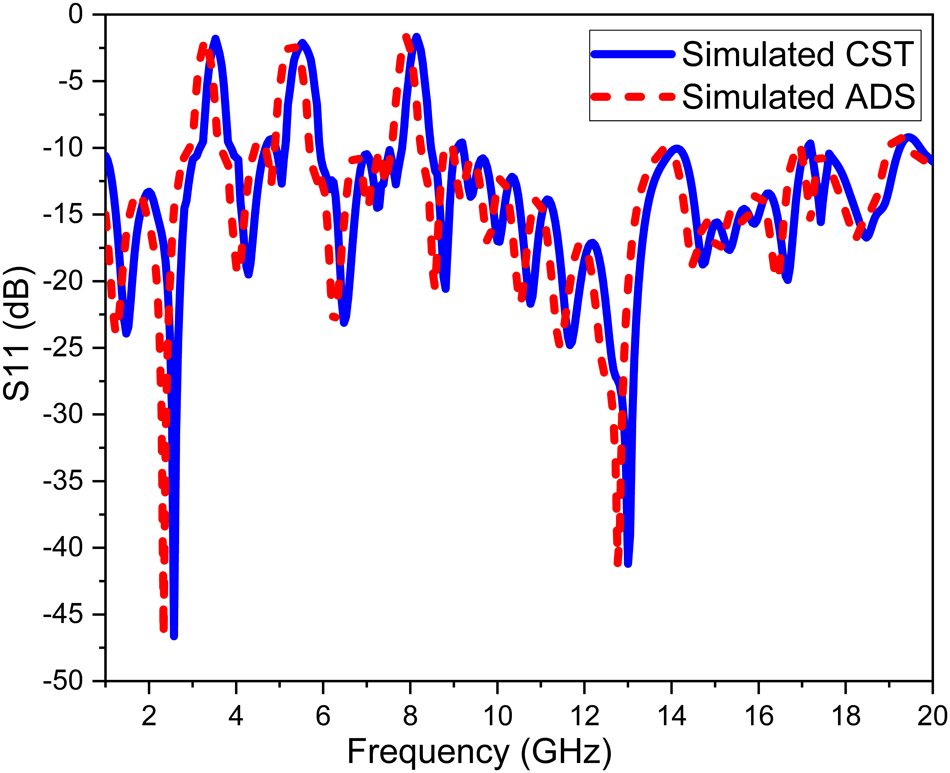
The design is simulated using CST. The obtained  $S_{11}$ results are further validated through the equivalent circuit model using the Keysight ADS simulation tool, as illustrated in Figure 6. The extracted passive element values are as follows:
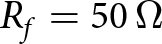 $R_f = 50\,\Omega$,
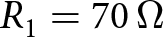 $R_1 = 70\,\Omega$,
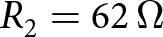 $R_2 = 62\,\Omega$,
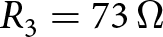 $R_3 = 73\,\Omega$,
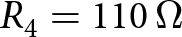 $R_4 = 110\,\Omega$,
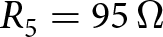 $R_5 = 95\,\Omega$,
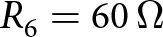 $R_6 = 60\,\Omega$,
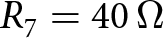 $R_7 = 40\,\Omega$,
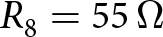 $R_8 = 55\,\Omega$,
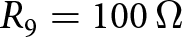 $R_9 = 100\,\Omega$;
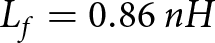 $L_f = 0.86\,nH$,
 $L_1 = 0.8\,nH$,
 $L_2 = 1.8\,nH$,
 $L_3 = 1.51\,nH$,
 $L_4 = 3.5\,\text{nH}$,
 $L_5 = 2.7\,\text{nH}$,
 $L_6 = 2.5\,\text{nH}$,
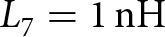 $L_7 = 1\,\text{nH}$,
 $L_8 = 0.25\,\text{nH}$;
 $C_1 = 0.48\,\text{pF}$,
 $C_2 = 0.53\,\text{pF}$,
 $C_3 = 0.48\,\text{pF}$,
 $C_4 = 0.66\,\text{pF}$,
 $C_5 = 0.62\,\text{pF}$,
 $C_6 = 1.12\,\text{pF}$,
 $C_7 = 1.54\,\text{pF}$,
 $C_8 = 0.41\,\text{pF}$, and
 $C_9 = 1.2\,\text{pF}$.
Figure 7 illustrates the comparison of  $S_{11}$ obtained from CST simulation and the ADS-based equivalent circuit model. A good agreement between the two results is observed, with minor deviations of approximately
 $\pm 5\%$ within acceptable tolerance limits.
Comparison of simulated  $S_{11}$ results of the Stage 5 antenna obtained from CST and ADS.

Figure 7 Long description
The x-axis is labeled 'Frequency (GHz)' and the y-axis is labeled 'S subscript 11 (dB)'. The blue solid line represents the CST simulation, while the red dashed line represents the ADS simulation. Both lines show fluctuations in S subscript 11 values, with peaks and troughs throughout the frequency range. The values range from approximately -50 to -10 decibels, indicating variations in performance across the frequency spectrum.
Effect of triangular trimming in triple-notched DTSVA
To further enhance the peak realized gain in the lower frequency range of 1–3 GHz, triangular corrugations are introduced along the tapered edges of the antenna, as illustrated in Stage 6. The corrugation geometry, defined by the parameters  $p$,
 $b$, and
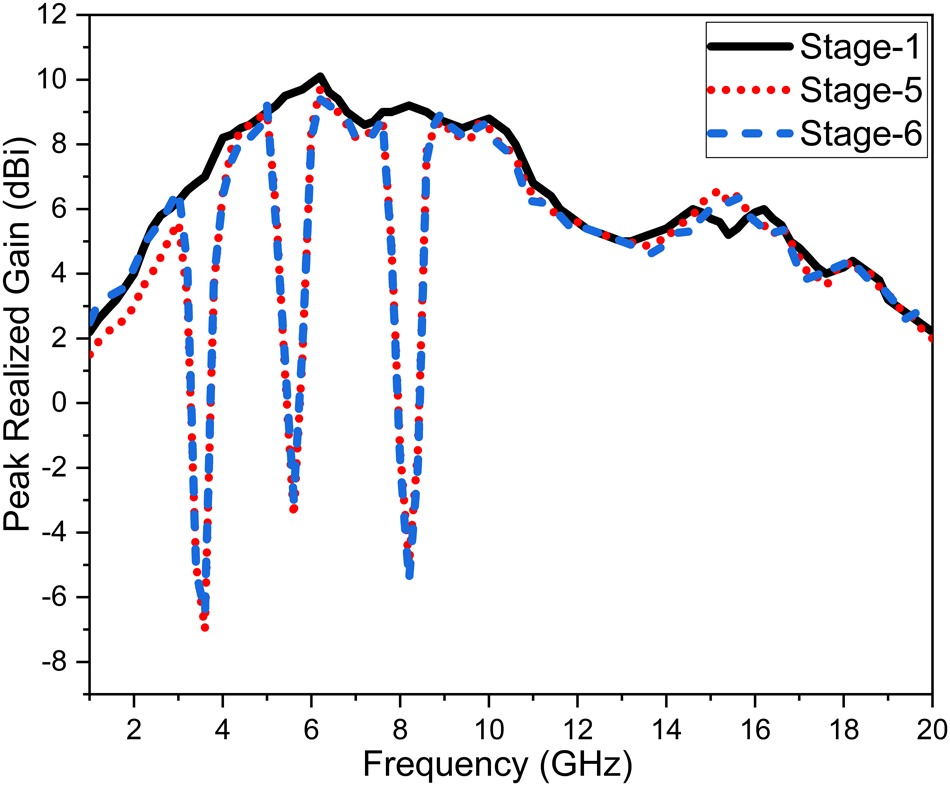
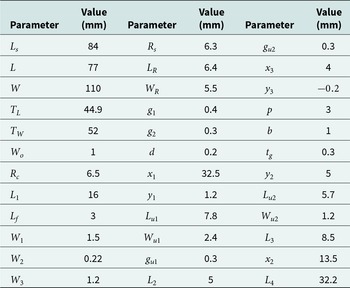
 $t$, is carefully optimized to improve end-fire radiation while preserving the impedance characteristics of the triple-notched design. The optimized value of all geometric parameters shown in Figures 1 and 2 are provided in Table 1. The simulated peak realized gain characteristics of Stage 1, Stage 5, and Stage 6 are presented in Figure 8. The reference antenna (Stage 1) exhibits a peak realized gain of approximately 10 dBi. However, the introduction of multiple resonators in Stage 5 results in gain degradation in the 1–3 GHz frequency range due to increased current perturbation and localized field confinement. With the incorporation of triangular corrugations in Stage 6, the realized gain is noticeably improved over the 1–3 GHz band compared to Stage 5, while maintaining a maximum gain of approximately 10 dBi. Further gain enhancement across the entire operating bandwidth without increasing the antenna size is achieved in the subsequent stage through the integration of AZIM unit cells.
Simulated peak realized gain of the antenna for Stage 1, Stage 5, and Stage 6 configurations over the operating frequency band.

Figure 8 Long description
A line graph showing peak realized gain in decibels on the y-axis and frequency in gigahertz on the x-axis. Three curves represent different stages: Stage-1 (solid line), Stage-5 (dotted line) and Stage-6 (dashed line). The graph covers a frequency range from 0 to 20 gigahertz. Stage-1 shows a relatively stable gain, Stage-5 exhibits significant dips and Stage-6 shows improved gain over the 1 to 3 gigahertz range compared to Stage-5.
Optimized geometrical parameters of the proposed antenna

Table 1 Long description
The table provides a detailed list of optimized geometrical parameters for a proposed antenna, measured in millimeters. Key parameters include the overall length and width, with the largest values being 77 mm and 110 mm, respectively. Smaller parameters such as gaps and offsets range from 0.2 mm to 6.5 mm. Notable values include a length of 84 mm for one component and a width of 52 mm for another. The table highlights the diversity in size and scale of the antenna's components, which are crucial for its design and functionality. These measurements are essential for understanding the antenna's structure and performance.
AZIM unit cell design and analysis
Metamaterials whose refractive index approaches zero, defined as 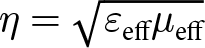 $\eta = \sqrt{\varepsilon_{\text{eff}} \mu_{\text{eff}}}$, are referred to as ZIMs. These artificial structures exhibit unique EM properties that enable precise manipulation of wave propagation, including phase uniformity and field collimation. In the proposed antenna design, AZIM unit cells are employed to collect the radiated EM energy and collimate it into a narrow beam directed along the antenna broadside. Such materials, characterized by conditions where
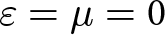 $\varepsilon = \mu = 0$, or
 $\varepsilon = 0$ with
 $\mu \neq 0$, or
 $\mu = 0$ with
 $\varepsilon \neq 0$, are capable of suppressing backscattered reflections while simultaneously enhancing forward radiation, thereby improving antenna directivity and realized gain [Reference Jiang, Wang, Sun, Li, Zhang, Li and Chen44].
For periodic metallic patterns printed on a dielectric substrate, the effective permittivity  $\varepsilon_{\text{eff}}$ approaches zero as the excitation frequency approaches the plasma frequency
 $\omega_p$. This frequency-dependent behavior is expressed via Equation 18
 \begin{equation}
\varepsilon_{\text{eff}} = 1 - \frac{\omega_p^2}{\omega^2},
\end{equation}
where  $\omega$ is the angular frequency of the incident EM wave. To shift the plasma frequency into the microwave regime, the geometry of the unit cells must be carefully tailored. Pendry et al. [Reference Pendry, Holden, Stewart and Youngs45] demonstrated that increasing the effective inductance and capacitance of the unit cell structure lowers
 $\omega_p$, thereby enabling plasmonic behavior at microwave frequencies. The effective EM parameters of the AZIM unit cell are retrieved using the scattering-parameter-based method proposed by Smith et al. [Reference Smith, Schultz, Markoš and Soukoulis46, Reference Smith, Vier, Koschny and Soukoulis47]. When a normally incident plane wave excites the unit cell, the reflection (
 $S_{11}$) and transmission (
 $S_{21}$) coefficients are obtained from full-wave simulations. Using these parameters, the effective wave impedance
 $Z$ and refractive index
 $\eta$ are calculated using Equations 19 and 20.
 \begin{equation}
Z = \pm \sqrt{\frac{(1+S_{11})^2 - S_{21}^2}{(1-S_{11})^2 - S_{21}^2}},
\end{equation}
 \begin{equation}
\eta = \frac{1}{k_0 d}
\left\{\mathrm{Im}\!\left[\ln\!\left(e^{j n k_0 d}\right)\right] + 2p\pi
- j\,\mathrm{Re}\!\left[\ln\!\left(e^{j n k_0 d}\right)\right] \right\},
\end{equation}
where  $k_0$ is the free-space wave number,
 $d$ is the unit-cell thickness, where
 $p$ is an integer chosen to maintain the physical branch of the refractive index. The integer
 $p$ is computed using Equation 21.
 \begin{equation}
p = \mathrm{round}\left\{
-\frac{1}{2\pi}
\left[
\ln\!\left(
\frac{S_{21}}
{1 - S_{11}\left(\frac{Z - 1}{Z + 1}\right)}
\right)
\right]
\right\}
\end{equation}
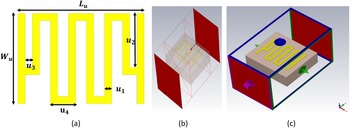
The configuration and simulation setup of the AZIM unit cell using CST-MWS are illustrated in Figure 9. Figure 9(a) shows the proposed meander-line-based AZIM unit cell geometry employed to achieve near-zero refractive index characteristics. To accurately extract the scattering parameters, a de-embedded port arrangement is adopted, as depicted in Figure 9(b). Figure 9(c) presents the applied boundary conditions, where the electric field is orientated along the  $x$-direction, the magnetic field along the
 $z$-direction, and the EM wave propagates in the
 $y$-direction. The optimized unit cell is fabricated on the same FR-4 substrate with a thickness of 0.8 mm to maintain compatibility with the proposed antenna.
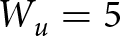
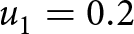
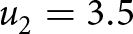
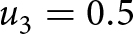
AZIM metamaterial unit cell: (a) optimized geometrical parameters (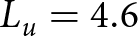 $L_u = 4.6$ mm,
 $W_u = 5$ mm,
 $u_1 = 0.2$ mm,
 $u_2 = 3.5$ mm,
 $u_3 = 0.5$ mm,
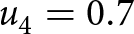 $u_4 = 0.7$ mm); (b) simulation setup with ports de-embedded to the unit cell edges for accurate S-parameter extraction; and (c) applied boundary conditions with wave propagation and field orientations for unit cell analysis.

Figure 9 Long description
The image A shows the AZIM unit cell geometry with labeled dimensions: L subscript u, W subscript u, u subscript 1, u subscript 2, u subscript 3 and u subscript 4. The image B shows the simulation setup with ports de-embedded to the unit cell edges. The image C shows the applied boundary conditions with wave propagation and field orientations, including electric and magnetic fields, within a 3D simulation environment.
The simulated de-embedded magnitude and phase of reflection and transmission coefficients of the proposed AZIM unit cell are analyzed in Figure 10. The magnitude response, shown in Figure 10, demonstrates a high transmission coefficient ( $|S_{21}|$) alongside a suppressed return loss (
 $|S_{11}|$), signifying efficient energy tunneling and minimal reflection at the design frequency. Furthermore, the phase of the transmission coefficient (
 $S_{21}$) is illustrated in Figure 10 ( scale shown in right side of the figure). The observed linear phase response within the operational band confirms the near-zero refractive index characteristic of the medium. This linear phase variation
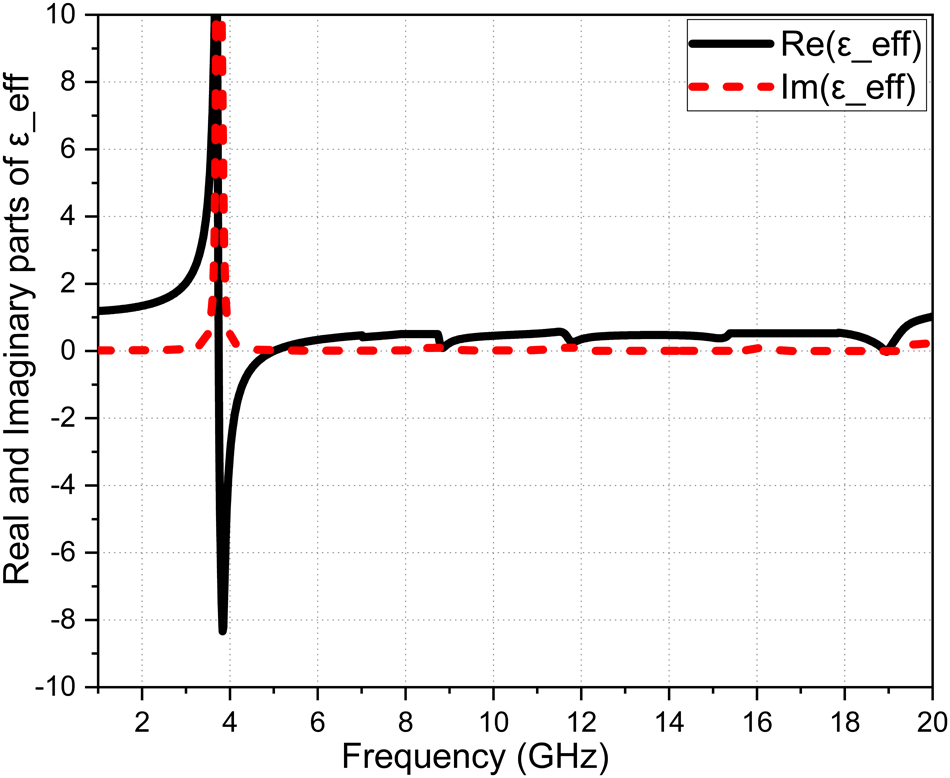
 $S_{21}$ indicates that the EM wave propagates through the anisotropic slab with an infinite phase velocity, maintaining spatial phase uniformity – a hallmark of ZIM structures [Reference Smith, Schultz, Markoš and Soukoulis46]. After de-embedding the S-parameters to the unit-cell boundaries, a MATLAB-based retrieval algorithm is employed to extract the effective parameters. As shown in Figure 11, the AZIM cell exhibits near-zero permittivity in the frequency range of 5–19.5 GHz, confirming its suitability for enhancing antenna gain and directivity in the higher operating band.
Magnitude and phase response of the simulated S-parameters ( $S_{11}$ and
 $S_{21}$) for the proposed AZIM unit cell. The left vertical axis indicates the magnitude of the scattering parameters, while the right vertical axis represents the phase in degrees.

Figure 10 Long description
A graph showing the magnitude and phase of S-parameters plotted against frequency in gigahertz. The x-axis is labeled 'Frequency (GHz)' and the left y-axis is labeled 'Magnitude of S-parameters', while the right y-axis is labeled 'Phase of S-Parameters (Degree)'. Four curves are present: a solid black line labeled 'S11M', a solid magenta line labeled 'S21M', a red dotted line labeled 'S11P' and a blue dashed line labeled 'S21P'. The graph shows variations in magnitude and phase across the frequency range from 0 to 20 gigahertz.
Retrieved effective permittivity ( $\epsilon_{\mathrm{eff}}$) of the proposed AZIM unit cell showing real and imaginary components versus frequency.

Figure 11 Long description
A graph showing the real and imaginary parts of effective permittivity versus frequency in gigahertz. The x-axis is labeled 'Frequency (GHz)' ranging from 0 to 20. The y-axis is labeled 'Real and Imaginary parts of epsilon subscript eff' ranging from negative 10 to 10. The real part, represented by a solid line, shows a sharp dip around 3 GHz and stabilizes around 2. The imaginary part, represented by a dashed line, peaks near 3 GHz and stabilizes around 0. The legend indicates the solid line as 'Re(eff)' and the dashed line as 'Im(eff)'.
Enlarged view illustrating the placement of AZIM metamaterial unit cells loaded within the tapered slot region of the proposed antenna, highlighting their integration along the taper profile.

Figure 12 Long description
The illustration shows a tapered slot design with multiple horizontal lines arranged in several columns. The lines are evenly spaced and aligned within the slot, which narrows towards the bottom. The background features two curved sections on either side of the slot.
AZIM cell loaded on Stage 6 antenna: design and analysis
The integration of AZIM cells into the proposed antenna requires careful consideration of the antenna geometry, excitation mechanism, and beam orientation. The placement of the AZIM cells must ensure that the feed structure and impedance matching characteristics of the antenna remain unaffected. Moreover, the number of AZIM cells is governed by the symmetry of the tapered slot profile and the available spacing between the radiating arms. To identify the optimal configuration, extensive full-wave simulations were performed using CST-MWS, with the primary objective of maximizing forward radiation while preserving UWB impedance matching. Through an iterative optimization process, the most effective location for embedding the AZIM cells was identified within the tapered slot region, as illustrated in Figure 1(a), with a magnified view shown in Figure 12. This placement enables strong interaction between the radiated EM fields and the AZIM cells, facilitating efficient field collimation without introducing additional mismatch.
The optimized antenna configuration incorporating AZIM unit cell loading in stage 6 is referred to as the proposed antenna. To further elucidate the underlying physical mechanism, the electric-field distributions of Stage 1 (reference antenna) and the proposed antenna are examined at 10 GHz, as shown in Figure 13. Compared to the reference antenna, the AZIM-loaded configuration exhibits noticeably flatter phase fronts compared to spherical fronts in the reference antenna and concentrated field regions in the forward direction, indicating a strong focusing effect. A 3-D radiation pattern at 10 GHz of the reference and the proposed antenna are shown in Figure 14(a) and (b) respectively. The three-dimensional radiation patterns at 10 GHz indicate that the AZIM-cell-loaded DTSVA exhibits improved beam shaping with enhanced forward gain and effective sidelobe suppression compared to the reference antenna. These results confirm that embedding AZIM cells within the tapered slot structure is an effective approach for improving antenna gain and directivity without compromising the wide impedance range bandwidth.
Electric field distribution at 10 GHz: (a) reference DTSVA antenna and (b) proposed AZIM unit-cell-loaded DTSVA antenna.

Figure 13 Long description
The image A shows the electric field distribution of a reference DTSVA antenna at 10 GHz, characterized by spherical phase fronts and concentrated field regions. The image B shows the electric field distribution of a proposed AZIM unit-cell-loaded DTSVA antenna at 10 GHz, featuring flatter phase fronts and concentrated field regions in the forward direction, indicating a strong focusing effect. Both images include a color scale on the right side indicating field intensity levels.
Three-dimensional radiation patterns at 10 GHz for (a) the reference DTSVA antenna and (b) the proposed AZIM-loaded DTSVA antenna.

Figure 14 Long description
The image shows two three-dimensional radiation patterns at 10 GHz. The left pattern, labeled (a), represents the reference DTSVA antenna. The right pattern, labeled (b), represents the proposed AZIM-loaded DTSVA antenna. Both patterns display a central red region indicating high intensity, surrounded by layers of varying intensity. The proposed antenna in (b) shows a more concentrated forward direction compared to the reference in (a).
Results and discussion
The performance of the proposed antenna and the reference antenna was initially investigated through full-wave EM simulations using CST-MWS (v2016) and subsequently validated through experimental measurements. The measurements were performed using a Rohde & Schwarz ZVA50 Vector Network Analyzer (VNA) (10 MHz–50 GHz), which fully covers the 1–20 GHz band, eliminating the need for segmented measurements. A full short-open-load-through (SOLT) calibration was conducted prior to testing to ensure accuracy. S-parameters, gain, and radiation patterns were measured in an anechoic chamber using a standard two-antenna setup with broadband horn antennas. High-quality RF cables and SMA connectors were employed to minimize mismatch and measurement uncertainties. The fabricated prototypes of the reference antenna and the proposed antenna are shown in Figure 15. A comprehensive evaluation was carried out in both the frequency and time domains. In the frequency domain, antenna performance was assessed in terms of VSWR, radiation efficiency, far-field radiation patterns, and peak realized gain. Time-domain analysis focused on the group delay and the transmission transfer function, represented by the magnitude of  $S_{21}$ (isolation), to verify the suitability of the antenna for UWB and imaging applications. The simulated and measured VSWR and
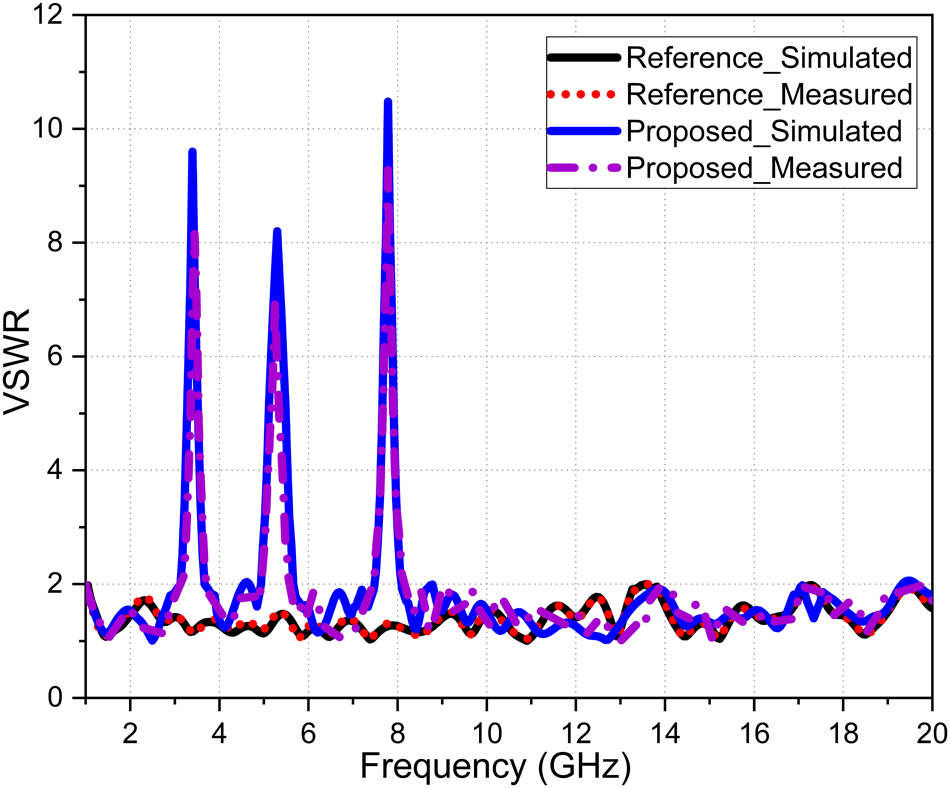
 $S_{11}$ responses of both antennas are presented in Figure 16 and 17, respectively. A good agreement between simulation and measurement is observed across the operating band for both the reference and proposed antennas. The proposed antenna exhibits distinct band-rejection characteristics, evidenced by sharp VSWR peaks or
 $S_{11} \gt -2.5\,\mathrm{dB}$ at the notched frequencies, while maintaining
 $\mathrm{VSWR} \lt 2$ or approximately
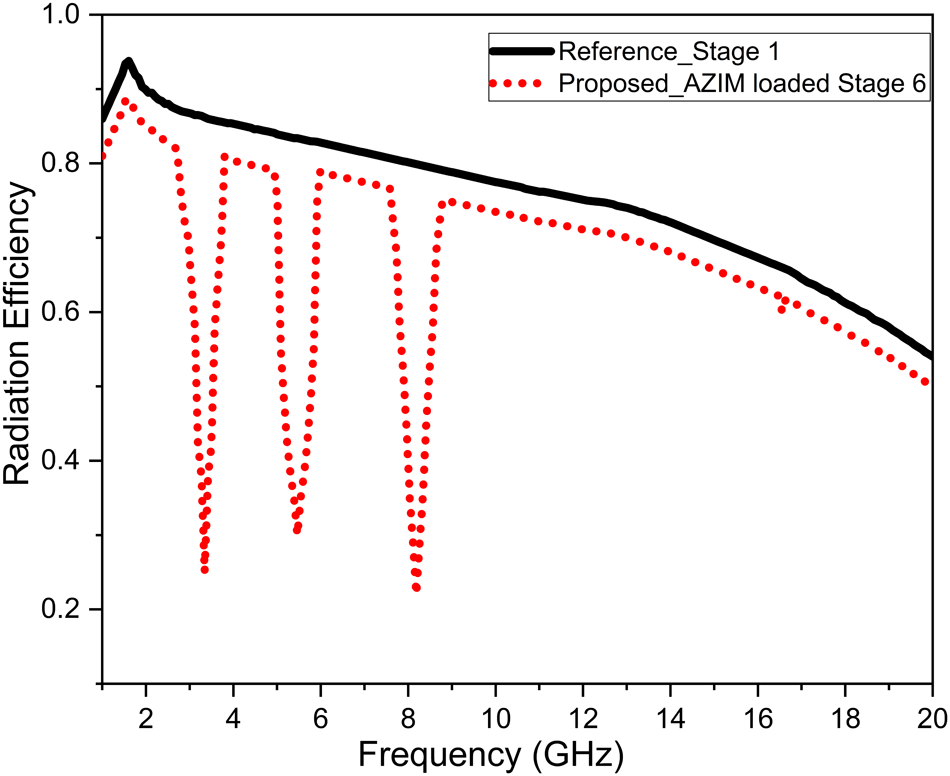
 $S_{11} \lt -10\,\mathrm{dB}$ over the remaining UWB range. Good agreement between the simulated and measured results is observed, validating the design approach. Minor discrepancies between the simulated and measured results are mainly attributed to fabrication tolerances and measurement uncertainties. The variation in radiation efficiency of the reference DTSVA and the proposed AZIM unit-cell- and resonator-loaded DTSVA is illustrated in Figure 18. Due to the lossy nature of the FR-4 substrate, a gradual reduction in radiation efficiency from approximately 92% to 55% is observed with increasing frequency for both designs. Despite this degradation, the proposed antenna maintains radiation efficiency above 55% up to 19.6 GHz, confirming its effective operation over the wide frequency range of 2.8–19.5 GHz. The sharp efficiency dips at the rejected bands further validate the intended band-notch behavior introduced by the AZIM loading.
Fabricated prototypes of the antennas: (a) top layer and (b) bottom layer of the reference DTSVA antenna; and (c) top layer and (d) bottom layer of the proposed AZIM-loaded DTSVA antenna.

Figure 15 Long description
The image shows four distinct antenna prototypes labeled as (a), (b), (c) and (d). Each prototype is placed next to a ruler and a coin for scale. Image (a) displays the top layer of a reference antenna with circular cutouts. Image (b) shows the bottom layer of the same reference antenna with a rectangular pattern. Image (c) presents the top layer of a proposed antenna with additional square elements. Image (d) depicts the bottom layer of the proposed antenna with a similar rectangular pattern as in (b).
Simulated and measured VSWR responses of the reference and proposed AZIM-loaded DTSVA antennas.

Figure 16 Long description
A line graph showing the Voltage Standing Wave Ratio (VSWR) on the y-axis and Frequency in gigahertz (GHz) on the x-axis, ranging from 1 to 20 GHz. The graph includes four curves: ReferenceSimulated, ReferenceMeasured, ProposedSimulated and ProposedMeasured. The ReferenceSimulated and ReferenceMeasured curves are closely aligned, showing lower VSWR values across the frequency range. The ProposedSimulated and ProposedMeasured curves exhibit sharp peaks at certain frequencies, indicating band-rejection characteristics. The VSWR values for these peaks reach up to 12, while the rest of the frequency range maintains a VSWR below 2. The graph illustrates the performance differences between the reference and proposed antennas in terms of VSWR response.
Simulated and measured return loss responses of the reference and proposed AZIM-loaded DTSVA antennas.

Figure 17 Long description
A line graph showing S11 in decibels on the y-axis and frequency in gigahertz on the x-axis, ranging from 1 to 20 gigahertz. Four curves are plotted: ReferenceSimulated, ReferenceMeasured, ProposedSimulated and ProposedMeasured. The ReferenceSimulated curve shows fluctuations between -10 and -50 decibels. The ReferenceMeasured curve follows a similar pattern with slight variations. The ProposedSimulated curve shows peaks and troughs, mostly between -10 and -40 decibels. The ProposedMeasured curve closely follows the Proposed_Simulated curve with minor deviations. The graph illustrates the performance of both reference and proposed antennas across the frequency range.
Simulated radiation efficiency comparison of the reference DTSVA and proposed AZIM-loaded DTSVA antennas.

Figure 18 Long description
A line graph comparing the radiation efficiency of two antenna designs over a frequency range from 1 to 20 gigahertz. The x-axis is labeled 'Frequency (GHz)' and the y-axis is labeled 'Radiation Efficiency'. The graph features two curves: a solid black line representing 'Reference Stage 1' and a dotted red line representing 'Proposed AZIM loaded Stage 6'. The black line shows a gradual decline in efficiency from approximately 0.9 to 0.6 as frequency increases. The red dotted line shows multiple sharp dips in efficiency at specific frequencies, indicating band-rejection characteristics, but generally follows a similar declining trend as the black line. The efficiency of the proposed design remains above 0.55 up to 19.6 gigahertz, despite the dips.
The measurement setup of the proposed antenna within an anechoic chamber is illustrated in Figure 19(a) to evaluate the far-field radiation patterns and gain characteristics. An enlarged perspective of the fabricated antenna prototype mounted on the positioner is shown in Figure 19(b), while the experimental configuration for measuring the return loss and impedance bandwidth using a calibrated VNA is presented in Figure 19(c).
(a) Anechoic chamber, (b) zoom view, and (c) measured  $S_{11}$ through VNA of the proposed antenna in open space.

Figure 19 Long description
The image A shows an anechoic chamber with a setup for evaluating far-field radiation patterns and gain characteristics. The image B shows a close-up of a fabricated antenna prototype mounted on a positioner. The image C shows a Vector Network Analyzer setup with labeled components including the VNA, antenna, SMA connector and test cables, used for measuring return loss and impedance bandwidth.
The two-dimensional (2-D) polar far-field radiation characteristics of the reference and proposed antennas were analyzed at 4, 7, 11, 15, and 18 GHz using simulated and measured E-plane ( $XY$-plane,
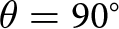 $\theta = 90^\circ$) and H-plane (
 $XZ$-plane,
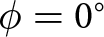 $\phi = 0^\circ$) radiation patterns, as shown in Figure 20(a)–(e) and 21(a)–(e), respectively. The 2-D polar radiation patterns in both planes demonstrate that the proposed AZIM-loaded DTSVA maintains stable end-fire radiation characteristics across the 4–18 GHz band. While the radiation patterns at 4 GHz remain nearly identical to those of the reference antenna due to the AZIM unit cell’s operational threshold of 5 GHz (as shown in Figure 11), a noticeable narrowing of the main lobe is observed from 7 to 18 GHz. This beam sharpening confirms that the AZIM loading effectively compensates for phase errors at the antenna aperture, transforming spherical wavefronts into planar ones and thereby enhancing directivity. The close agreement between simulated and measured results further validates the effectiveness of the aperiodic metamaterial integration for high-gain wideband applications.
Two-dimensional polar radiation patterns in the E-plane showing simulated and measured results of the reference and proposed AZIM-loaded DTSVA antennas at (a) 4 GHz, (b) 7 GHz, (c) 11 GHz, (d) 15 GHz, and (e) 18 GHz; and (f) legend used for comparison.

Figure 20 Long description
The image consists of five polar plots labeled (a) to (e), each depicting the simulated and measured radiation patterns of reference and proposed antennas at different frequencies: 4 GHz, 7 GHz, 11 GHz, 15 GHz and 18 GHz. Each plot includes four curves: ReferenceSimulated, ReferenceMeasured, ProposedSimulated and ProposedMeasured. The legend in (f) identifies the curves with different symbols and line styles. The plots illustrate the differences in radiation patterns between the reference and proposed antennas across the specified frequencies.
Two-dimensional polar radiation patterns in the H-plane showing simulated and measured results of the reference and proposed AZIM-loaded DTSVA antennas at (a) 4 GHz, (b) 7 GHz, (c) 11 GHz, (d) 15 GHz, and (e) 18 GHz; and (f) legend used for comparison.

Figure 21 Long description
The image consists of five polar plots labeled (a) to (e), each showing the simulated and measured radiation patterns of reference and proposed antennas. Plot (a) shows patterns at 4 GHz, plot (b) at 7 GHz, plot (c) at 11 GHz, plot (d) at 15 GHz and plot (e) at 18 GHz. Each plot includes four curves: ReferenceSimulated, ReferenceMeasured, ProposedSimulated and ProposedMeasured. The legend in (f) identifies the curves with different symbols and colors for each category.
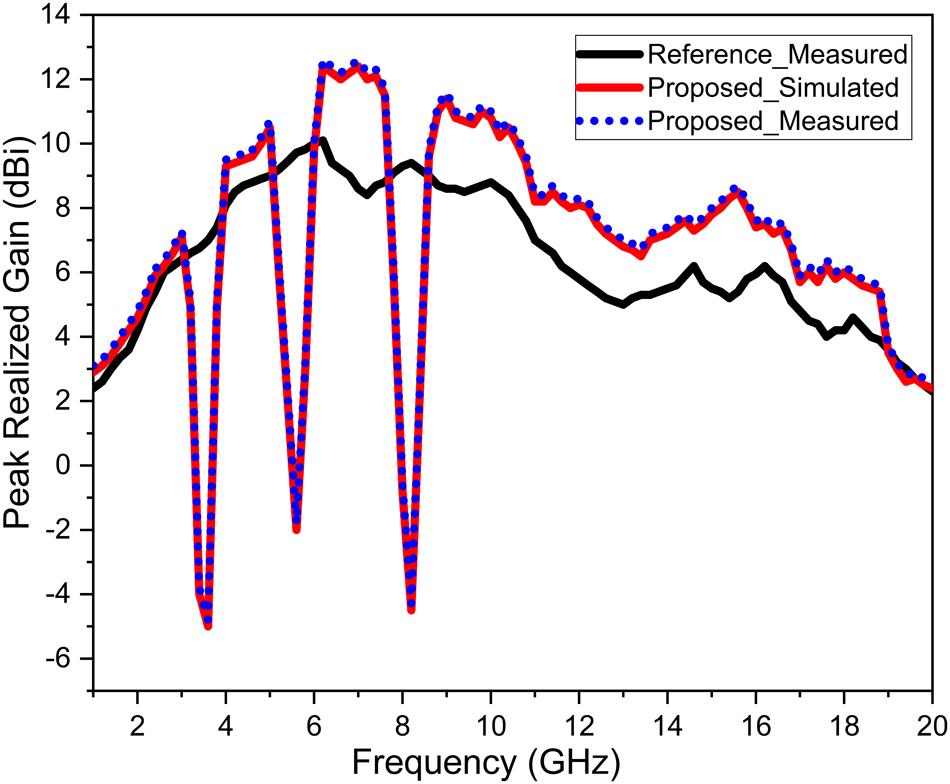
A comparison between the simulated and measured peak realized gains of the proposed antenna and the measured peak realized gain of the reference antenna is presented in Figure 22. The incorporation of AZIM unit cells in Stage 6 results in a significant gain enhancement over the frequency range of 5–19 GHz.
Peak realized gain versus frequency showing simulated and measured results of the proposed AZIM-loaded DTSVA antenna and measured results of the reference DTSVA antenna.

Figure 22 Long description
A line graph showing peak realized gain in decibels on the y-axis versus frequency in gigahertz on the x-axis, ranging from 1 to 20 gigahertz. Three curves are plotted: a solid black line for reference measured results, a solid red line for proposed simulated results and a dashed blue line for proposed measured results. The proposed antenna shows significant gain enhancement over the reference, particularly between 5 and 19 gigahertz.
A maximum gain improvement of approximately 3.8 dBi is observed at 7.2 GHz, yielding a peak realized gain of 12.45 dBi. Furthermore, compared with a single-slot TSVA of identical physical dimensions, the AZIM-loaded double-tapered slot antenna exhibits an additional peak realized gain improvement of approximately 4.7 dBi. Deep gain nulls at the notched bands further confirm effective selective interference suppression while maintaining high gain across the remaining operating band.
The close agreement between simulated and measured results (as shown in Figures 16, 17, 20, 21, and 22) is attributed to the inherently smooth impedance transition of the Vivaldi antenna, which reduces sensitivity to fabrication tolerances. Additionally, accurate simulation settings, proper SOLT calibration, and measurements performed in an anechoic environment contribute to minimizing discrepancies. The use of a high-quality SMA connector further ensures reliable wideband performance. Minor discrepancies, though not visually prominent, arise from controlled measurement uncertainties such as FR-4 dielectric constant variation ( $\pm$0.2–0.4), SMA connector and soldering parasitics, and cable losses with VNA repeatability.
The measured group delay and isolation responses of the reference and proposed antennas are shown in Figure 23. The obtained measurements were performed using a face-to-face far-field configuration. The group delay (right vertical axis) is measured in the far-field region with an inter-antenna separation 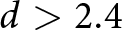 $d \gt 2.4$ m at the lowest frequency of 1 GHz, while the isolation (
 $S_{21}$, left vertical axis) is measured with a fixed separation of
 $d = 500$ mm. The group delay remains nearly constant over the 1–20 GHz range, indicating good time-domain fidelity. Pronounced peaks are observed at 3.5, 5.6, and 8.2 GHz, confirming effective signal rejection at the designed notched bands. The
 $S_{21}$ characteristics, simulated using two identical antennas separated by 500 mm, exhibit deep transmission nulls at the same frequencies for the proposed antenna, whereas the reference antenna shows smooth transmission across the entire band. Outside the notched regions, comparable
 $S_{21}$ levels indicate stable UWB transmission behavior. The gradual reduction in
 $S_{21}$ magnitude at higher frequencies is primarily attributed to increased dielectric and conductor losses of the FR-4 substrate, which become more pronounced at higher frequencies and lead to increased transmission attenuation.
Measured group delay and isolation ( $S_{21}$) responses of the reference and proposed antennas.

Figure 23 Long description
A graph showing isolation (S subscript 21) in decibels on the left vertical axis and group delay in nanoseconds on the right vertical axis, plotted against frequency in gigahertz on the horizontal axis. The graph includes four curves: S subscript 21 Reference (black solid line), S subscript 21 Proposed (red dotted line), Group delay Proposed (blue solid line) and Group delay Reference (purple dashed line). The S subscript 21 Proposed curve shows deep nulls at approximately 3.5, 5.6 and 8.2 gigahertz, while the S subscript 21 Reference curve remains relatively smooth. The group delay curves show a nearly constant behavior over the frequency range. An inset diagram illustrates the antenna setup with a labeled distance 'd'.
The group delay was measured using a Rohde & Schwarz ZVA50 VNA in a two-antenna transmission configuration. Two identical antennas were placed in a face-to-face arrangement under far-field conditions (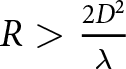 $R \gt \frac{2D^2}{\lambda}$), where
 $\lambda$ corresponds to the wavelength at the highest operating frequency (20 GHz), and connected to Port 1 and Port 2 using low-loss coaxial cables. A full two-port calibration Through-Open-Short-Match (TOSM) was performed to eliminate cable and connector effects. The frequency range was set from 1 to 20 GHz with 1000 sweep points and a reduced IF bandwidth (5 KHz) to improve phase accuracy. The group delay was obtained from the negative derivative of the transmission phase with respect to angular frequency. Since a two-antenna setup was used, the group delay of a single antenna is approximated as half of the measured value.
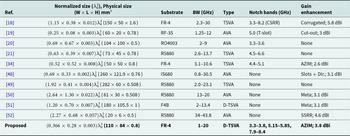
A comparison of the proposed antenna with recently reported works is presented in Table 2. Based on this comparative study, it is observed that most reported TSVA/AVA designs achieve a wide impedance bandwidth at the expense of larger antenna dimensions, expensive low-loss substrates, or limited notch functionality. Several reported works employ single-band or dual-band notch techniques using CSRRs, slots, or resonant strips, while gain enhancement is commonly achieved through corrugation, metamaterial loading, or director elements. Many of these designs either lack multiple notch bands or rely on complex geometries and high-performance substrates. In contrast, the proposed double-slot DTSVA achieves an ultra-wide impedance bandwidth of 1–20 GHz using a low-cost FR-4 substrate while incorporating three well-defined notch bands to suppress WiMAX, WLAN, and X-band interferences. Moreover, the combined integration of AZIM cell loading and corrugation results in a noticeable gain enhancement of up to 3.8 dBi, making the proposed antenna a compact, cost-effective, and high-performance solution compared with existing designs reported in the literature.
Comparative performance analysis of the proposed DTSVA antenna with recently reported designs
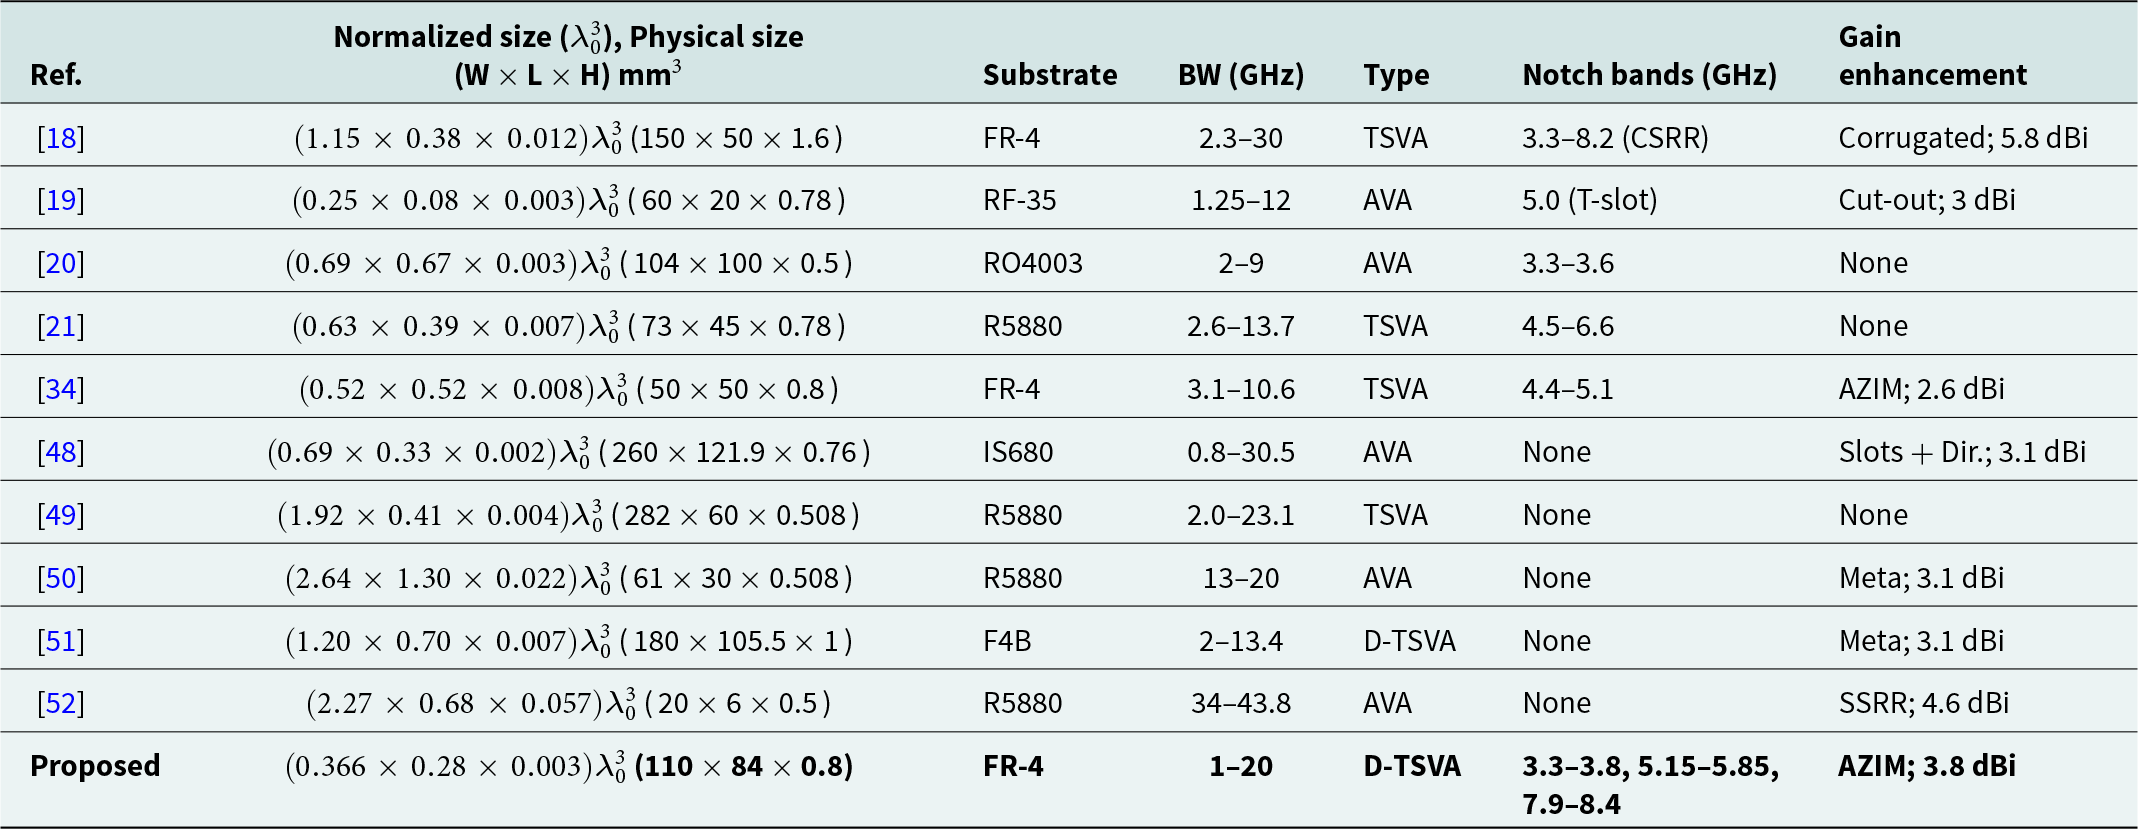
Table 2 Long description
The table compares the performance of the proposed DTSVA antenna against various recently reported designs, focusing on size, substrate, bandwidth, type, notch bands, and gain enhancement. The proposed antenna, using an FR-4 substrate, achieves a wide bandwidth from 1 to 20 GHz with three distinct notch bands and a gain enhancement of 3.8 dBi. In comparison, other designs like the one in reference 18, using a TSVA type, cover a broader bandwidth of 2.3 to 30 GHz but with a larger physical size. Notably, the proposed design maintains a compact size while offering competitive performance, especially in terms of gain and notch band flexibility. The table highlights the trade-offs between physical size and performance metrics across different antenna designs.
Note: Normalized dimensions are calculated with respect to the free-space wavelength ( $\lambda_0$) at the lowest operating frequency.
Future work
Future work may explore the development of array-based implementations of the proposed antenna to achieve higher directivity and improved spatial resolution for imaging applications. The incorporation of tunable or reconfigurable resonators can provide adaptive band-notch characteristics, making the antenna suitable for dynamic and multi-standard wireless environments.
Conclusion
A compact corrugated DTSVA has been designed, optimized, and experimentally validated for UWB applications. The proposed antenna operates over an ultra-wide frequency range of 1–20 GHz and incorporates triple band-notch characteristics to suppress interference from WiMAX, WLAN, and X-band uplink systems. The obtained notched bands are realized through the integration of a CSRR and U-shaped slots. Owing to the presence of the CSRR and U-slots, a slight degradation in peak realized gain is observed in the 1–3 GHz frequency range. To compensate for this effect, triangular slit corrugation techniques are employed, resulting in improved gain performance. To further enhance the radiation characteristics, an AZIM unit cell is embedded within the tapered slot region. This integration significantly enhances forward radiation and provides a gain improvement of up to 3.8 dBi over the 5–19 GHz band without increasing the overall antenna size. The antenna geometry is systematically optimized through extensive parametric studies to achieve a wide impedance bandwidth, stable radiation characteristics, and effective notch performance. Comprehensive numerical simulations and experimental measurements confirm the robust performance of the proposed antenna in terms of VSWR, peak realized gain, radiation efficiency, group delay, and far-field radiation patterns. A close agreement between simulated and measured results validates the accuracy of the proposed design. Owing to its compact size, low-cost FR-4 substrate, selective interference suppression, and enhanced gain performance, the proposed antenna is well-suited for microwave imaging, radar sensing, material characterization, and portable UWB communication systems. Future work may extend the proposed concept to antenna arrays and advanced metamaterial configurations for further performance enhancement.
Acknowledgements
The authors acknowledge the Department of Electronics and Communication Engineering, IIT (ISM) Dhanbad, for providing access to the DST-FIST laboratory facilities ( project reference: SR/FST/ET-I/2019/289 ). Special thanks are extended to Dr. Ravi Kumar Gangwar, in charge of the DST-FIST lab, for his support in successfully carrying out the scheduled measurements using the anechoic chamber and VNA facilities.
Competing interests
The author(s) declare none.

Manoj Bhaskar was born in Sitamarhi, India, in 1989. He received the B.Tech. degree in Electronics and Communication Engineering from Asansol Engineering College, West Bengal, in 2011, and the M.Tech. degree in Electrical Engineering, specializing in RF, Microwaves, and Photonics, from the Indian Institute of Technology (IIT) Kanpur in 2014. He is currently serving as an Assistant Professor in the Department of Electronics and Communication Engineering at the Government Engineering College, Banka, Bihar, India. With over nine years of academic and teaching experience, he is also currently pursuing a part-time Ph.D. at the Indian Institute of Information Technology (IIIT) Bhagalpur. His primary research interests include antenna design, the development and applications of metamaterials, microwave imaging, and NDT. His work focuses on leveraging EM properties for advanced sensing and wireless communication technologies.

Dr. Chetan Barde was born in Jabalpur, India, in 1986. He received the B.E. degree in Electronics & Communication Engineering from the RGPV University, Bhopal, India, in 2008, and the M.Tech degree in Nanotechnology from the VIT University, Vellore, India, in 2013. He completed Ph.D. from the National Institute of Technology Jamshedpur, India. His research interests include ZOR antenna, metamaterials & its applications, and EM wave absorbers. He joined the Department of Electronic and Communication Engineering, IIIT Bhagalpur, India, as an Assistant Professor and became an Assistant Professor in 2023. His current research interests include signal processing, communication, soft computing, and antenna design.

Dr. Prakash Ranjan was born in Vaishali, India, in 1982. He received the B.E. degree in Electronics & Communication Engineering from Anna University, Chennai, India, in 2009, and the M.Tech. degree in Electronics & Communication Engineering from the YMCA University, Haryana, India, in 2012. In 2019, he completed his Ph.D. at the National Institute of Technology, Jamshedpur, India, and subsequently joined the Department of Electronics & Communication Engineering, Indian Institute of Information Technology, Bhagalpur, as Assistant Professor. He is a graduate student member of IEEE. His research interests include metasurfaces, metamaterials & its applications, EM wave absorbers, ZOR antenna, and soft computing optimization techniques.

Dr. Sujit Kumar is working as the Assistant Professor in the Electrical Engineering Department at Government Engineering College, Banka. He completed his Ph.D. in January 2025 at the National Institute of Technology, Nagaland, 797103, India. He received his Master’s degree in the year 2018 from the National Institute of Technology, Uttarakhand, 246174, India. His research interests include the application of artificial intelligence in fault diagnosis.

Himanshu Kumar Shekhar was born in Bhagalpur, India, in 1993. He received the B.Tech. degree in Electronics and Communication Engineering from Punjab Technical University, Jalandhar, India, in 2014, and the M.Tech. degree in Electronics and Communication Engineering from the National Institute of Technology Karnataka (NITK), Surathkal, India, during 2016–2018. He is currently serving as an Assistant Professor in the Department of Electronics and Communication Engineering at Government Engineering College, Banka, Bihar, India. With more than six years of teaching and academic experience, he is presently pursuing a part-time Ph.D. at the Indian Institute of Technology (IIT) Roorkee, Uttarakhand, India. His primary research interests include wireless communication technologies, non-orthogonal multiple access (NOMA), intelligent reflecting surfaces (IRS), and MIMO antenna systems.

Dr. Bam Bahadur Sinha is an Assistant Professor in the Department of Computer Science and Engineering at the National Institute of Technology Sikkim. Prior to this, he was serving as an Assistant Professor at the Indian Institute of Information Technology Ranchi. He received the M.Tech. and Ph.D. degrees in Computer Science & Engineering from the National Institute of Technology Nagaland in 2017 and 2020, respectively. He was awarded a Gold medal in M.Tech. at NIT Nagaland in the year of 2017. His areas of expertise include artificial intelligence, machine learning, deep learning, optimization techniques, and recommender systems.