I. INTRODUCTION
Isolating and interpreting strengthening mechanisms in nanostructured alloys presents experimental challenges that have left gaps in our understanding of the relative importance of different contributing factors. Pure metals typically follow Hall–Petch strengthening down to a critical grain size, beyond which the strength saturates or possibly even decreases. For example, in pure Cu the hardness reaches a maximum of ∼2.5 GPa at a grain size of ∼25 nm. Reference Chen, Lu and Lu1–Reference Wang and Ma4 The addition of solutes, Reference Özerinç, Tai, Vo, Bellon, Averback and King5,Reference Mula, Bahmanpour, Mal, Kang, Atwater, Jian, Scattergood and Koch6 precipitates, Reference Khalajhedayati and Rupert7 grain boundary segregation, Reference Darling, Roberts, Mishin, Mathaudhu and Kecskes8,Reference Rajgarhia, Spearot and Saxena9 and nanotwins Reference Anderoglu, Misra, Wang and Zhang10–Reference Ma, Wang, Lu, Sui, Lu and Lu12 can then further enhance the hardness of this material. These approaches have motivated numerous efforts to optimize the microstructure, chemistry, and resultant mechanical properties of nanostructured alloys. A fundamental scientific challenge exists in understanding and predicting the combined effects of these mechanisms in complex alloys. This stems from experimentally varying microstructure and chemistry independently. For example, grain size, precipitate size, precipitate density, and solubility all depend on thermal treatment conditions in ways that are often interdependent as the system relaxes toward equilibrium. Driven processes such as severe plastic deformation and irradiation that force the system into nonequilibrium configurations allow for the possibility of partially decoupling the evolution of some such microstructural attributes. Reference Zhang, Beach, Wang, Bellon and Averback13,Reference Arshad, Lach, Ivanisenko, Setman, Bellon, Dillon and Averback14 These driven processes tend to induce point and line defects and defect clusters that also affect mechanical properties. Reference Hosemann, Shin and Kiener15,Reference Valiev and Alexandrov16 However, their concentrations can be limited in nanostructured materials with high sink densities, and their effects on mechanical properties can be minimal under certain circumstances where solute, precipitates, and high densities of interfaces dominate mechanical properties. Here, we seek to understand the relative contributions to hardening that result from irradiation-induced defects, solid solution additions, interfaces, and precipitates through controlled nonequilibrium processing.
Cu–W is a model highly immiscible alloy system (ΔH mix ≈ 16–35.5 kJ/mol in an equimolar solution), which is two phase in both the solid and liquid phases. Reference Raghu, Sundaresan, Ramakrishnan and Rama Mohan17,Reference Nastasi, Saris, Hung and Mayer18 Such systems are susceptible to irradiation-induced precipitation even in the absence of thermal diffusion. Reference Vo, Chee, Schwen, Zhang, Bellon and Averback19 In this case Cu-rich alloys, two-phase solutions containing W precipitates, and a supersaturated Cu matrix containing ≈0.7–2 at.% W are formed, with the supersaturation increasing slowly with average W concentration. Reference Zhang, Beach, Wang, Bellon and Averback13 Under continued low-temperature irradiation, the precipitates coarsen and approach a steady-state size after a dose of 0.2–0.5 displacements per atom (dpa), which is comparable to the diameter of the displacement cascades. Reference Zhang, Beach, Wang, Bellon and Averback13,Reference Vo, Chee, Schwen, Zhang, Bellon and Averback19 Irradiation-induced grain growth also occurs, typically following cubic growth kinetics with a rate constant for pure Cu on the order of k = 5.2 × 1012 cm/(ions-cm−2). Reference Liu, Li and Mayer20 In the presence of W solute and precipitates, grain growth rate during thermal annealing is dramatically reduced, even up to 800 °C. Reference Vo, Chee, Schwen, Zhang, Bellon and Averback19 Thus, it is possible to grow solid solution Cu–W alloy films via physical vapor deposition (PVD), irradiate them to a low dose at low temperatures, and thereby investigate the effects of precipitation on mechanical properties absent significant grain growth or grain boundary segregation. Irradiation hardening due to irradiation-induced point and line defects, moreover, typically saturates by 1 dpa and can be measured directly from the pure material. As will be seen, this overall approach enables the relative effects of solid solution strengthening, precipitate hardening, and radiation damage to be varied relatively independent of changes in grain size. Irradiating to extremely high doses, then enables the grain size to be varied independent of precipitate size, to isolate the effects of Hall–Petch scaling. The irradiation-induced precipitation results in W particles that are either coherent or semicoherent with the Cu matrix. Reference Tai, Averback, Bellon, Vo, Ashkenazy and Dillon21 In addition, the large heat of mixing and high strength of W suppresses cutting of the W particles by dislocations, making the system a good model for dispersion strengthening. Reference Vüllers and Spolenak22 This work thus examines strength modifications in PVD-grown Cu–W alloys with compositions below and above the irradiation-induced solubility limit and exposed to low and high doses of high-energy ion irradiation.
II. EXPERIMENTAL PROCEDURE
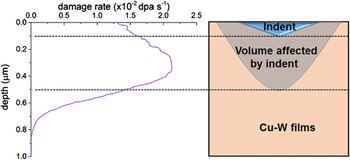
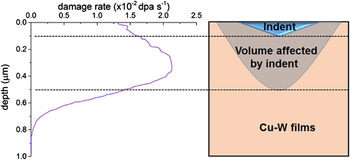
Nanocrystalline Cu and Cu100−x W x (x = 0.5, 1, 6, and 12 at.%) thin films of ∼1 μm thickness were sputter deposited on oxidized Si(001) substrates using an Ar pressure of ∼2.1 × 10⁻³ torr, added to a base pressure of ∼2 × 10⁻⁸ torr. The precise compositions of the films were determined by Rutherford Backscattering Spectroscopy. All samples were irradiated at room temperature using 1.8 MeV Kr+ to a dose of 8.32 × 10¹⁵ ions-cm−2 [∼20 displacements per atom (dpa)]. Selected samples were characterized using Cu Kα X-ray diffraction to obtain the W solubility under different conditions as estimated from Vegard’s law. The microstructure and chemistry of the samples were characterized using Transmission electron microscopy (TEM) and high angle annular dark field (HAADF) scanning transmission electron microscopy (STEM) using JEOL 2010 LaB6, 2010 EF-FEG, and 2200FS microscopes (JEOL Ltd., Tokyo, Japan). Plan-view TEM images were prepared by mechanical polishing followed by ion milling at 5 kV using Ar ions. A final polishing voltage of 2 kV was used to minimize damage from ion polishing. Cross-section TEM samples were prepared using a focused ion-beam (FIB) lift-out technique with final milling at 5 kV. Nanoindentation measurements were performed using a Hysitron Triboindenter outfitted with a diamond Berkovich tip in (Hysitron, Eden Prairie, Minnesota) a continuous stiffness measurement mode. The nanoindenter was calibrated before each experiment using fused silica. The average hardness (H) was determined using the Oliver–Pharr method based on a 5 × 2 array of indents made to a depth of 100 nm and spaced at least 3 μm apart. According to Hosemann et al., Reference Hosemann, Kiener, Wang and Maloy23 the plastic zone of a Berkovich indenter extends to a depth of at least five times the indentation depth. Hence, a 100 nm indent would sample the material to a depth of at least 500 nm. The damage profile for Kr+ ions in Cu is calculated using stopping and range of ions in matter indicates that a 100 nm indent would predominantly sample the irradiated region (see Fig. 1).
Damage profile for 1.8 MeV Kr+ in copper and schematic illustration of indent and plastic volume depth.
In situ TEM-based nanopillar compression measurements were also performed on selected Cu94W6 samples. The hardness calculated from the yield strength measurements was used to corroborate the results obtained from nanoindentation. For these experiments, ≈1.5 μm Cu94W6 films were grown on commercial wedge shaped Si substrates (Hysitron) under the same conditions as described above. Prior to ion irradiation, square pillars with an edge length ∼400 nm were fabricated by FIB milling. Irradiation was performed perpendicular to the axis of the pillar to ensure relatively uniform damage throughout the length of the pillar. After irradiation, the FIB was again used to reduce the edge length to ∼150–200 nm with an aspect ratio of ∼2.5. An in situ nanopillar compression was performed in the JEOL LaB6 TEM using a Hysitron PI-95 picoindenter. Samples were compressed under displacement-control mode at a rate of 1 nm/s using a 2 μm diamond flat punch. The yield strength was calculated using the 0.2% offset rule with the elastic modulus assumed from the slope of the linear region of the stress–strain (σ–ε) unloading curve. Three or more different pillars were tested under each condition to assess reproducibility of the measurements, and the standard deviation is reported as the error in measurement.
III. RESULTS
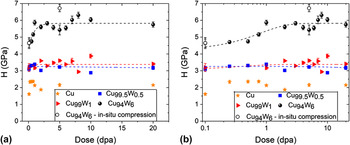
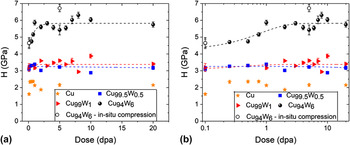
X-ray diffraction measurements indicate that the as-grown thin films were solid solutions (Supplementary Material Fig. S1). Additionally, no second-phase W was observed via TEM or HAADF STEM imaging. This is consistent with prior reports for Cu–W thin films of similar composition grown via PVD. Reference Zhang, Beach, Wang, Bellon and Averback13,Reference Vüllers and Spolenak22,Reference Tai, Averback, Bellon, Ashkenazy and Stumphy24 The hardness of the as-deposited samples increases with increasing the W concentration, c. This agrees with a prior report from Vüllers et al. Reference Vüllers and Spolenak22 Upon room-temperature irradiation to a dose of 0.25 dpa, all samples showed, to varying degrees, an increase in hardness. Pure Cu undergoes the greatest change, increasing from 1.61 ± 0.07 to 2.34 ± 0.09 GPa (or 45%), while Cu99.5W0.5, Cu99W1, and Cu94W6 increase only 5.5%, 3.07%, and 1.6%, respectively. The hardness of pure Cu saturates at this dose and does not exhibit higher hardness at larger doses. Irradiation hardening in the pure material is associated with the accumulation of nonequilibrium point defect clusters and dislocations loops. In the Cu–W alloys, W clustering can also contribute to hardening. While the hardness of pure Cu reaches a maximum value by 0.25 dpa, the alloy samples exhibit only small increases in hardness. In fact, the Cu99.5W0.5 alloy shows negligible increase in hardness even to 20 dpa. These results all indicate that irradiation hardening due to accumulation of irradiation-induced defects is a relatively weak secondary effect in the W containing alloys. In pure Cu the hardness reaches a maxima by 0.25 dpa, but decreased between 0.75 and 2 dpa, before regaining the prior maximum hardness at even higher doses. As discussed below, we attribute this transient reduction in hardness to an irradiation-induced reduction in the density of twins, which are inherent to Cu samples grown by sputtering.
In the alloy samples, the hardness is saturated during room-temperature irradiation at a dose of ∼1 dpa (refer to Fig. 2). Fitting these data to an exponential function produces a relaxation dose constant of 0.4 and 0.8 dpa for Cu99W1 and Cu94W6, respectively, which is similar to prior measurements deduced from in situ electrical resistivity measurements (0.2–0.5 dpa for 1.1–4.7% W Reference Zhang, Beach, Wang, Bellon and Averback13 ).
Hardness of samples with varying initial W concentration irradiated at room temperature to different doses (the closed symbols are from hardness results and the open symbols are from the in situ compression experiment H = 3σy). The two plots show the same data on (a) linear and (b) log scales and the lines represent suitable fits to the experimentally measured hardness.
The as-deposited Cu94W6 and Cu99W1 produce Cu(111) diffraction peaks at 43.03° and 43.23°, respectively, which are consistent with ∼7 at.% W and ∼1.6 at.% W, assuming Vegard’s law. As shown in Fig. S1, the (111) peak shifts toward pure Cu (43.297°) with an increasing irradiation dose, illustrating W precipitation. No measurable W peaks appear suggesting that the W precipitates are quite small. After a dose of ≈20 dpa, the Cu(111) peak position reaches a steady-state value of 43.24° and 43.28° in Cu94W6 and Cu99W1, respectively, which correspond to solid solution concentrations of 1.3 at.% W and 0.7 at.% W, again estimated from Vegard’s law.
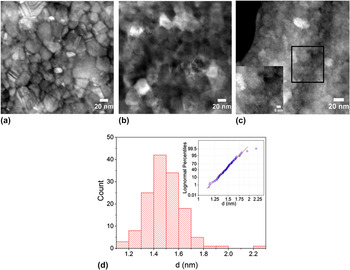
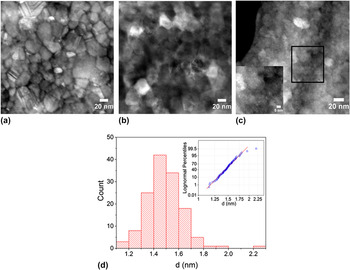
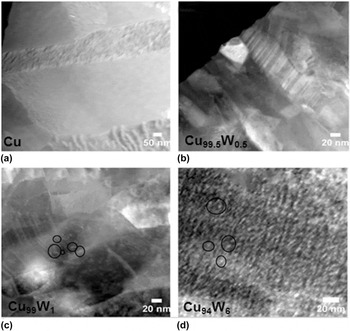
Hardness saturation beyond 0.75 dpa is consistent with the onset of W precipitation in the Cu94W6 confirmed by HAADF-STEM imaging. Since, the intensity in HAADF imaging varies roughly as the square of the atomic number, images acquired at doses of 0.25 and 0.5 dpa showed an absence of W precipitates, while the sample irradiated to 0.75 dpa reveals distinct bright spots throughout the copper lattice [refer inset in Fig. 3(c)], consistent with W precipitation with an average precipitate diameter, d, of 1.4 ± 0.2 nm (see Fig. 3). Further increases in the irradiation dose result in minor W coarsening, to approximately 3.5 ± 0.5 and 3.1 ± 0.5 nm in Cu94W6 and Cu99W1 alloys, respectively, (refer Fig. 4). No precipitates were observed in Cu99.5W0.5 even after a dose of 20 dpa. These findings are consistent with the measured threshold irradiation-induced solubility of ≈0.7 at.% W, noted above and elsewhere. Reference Zhang, Beach, Wang, Bellon and Averback13
HAADF images of Cu94W6 samples irradiated to (a) 0.25 dpa, (b) 0.5 dpa, (c) 0.75 dpa showing precipitation only in the sample irradiated to 0.75 dpa [the inset in (c) is a magnified image of the boxed region], and (d) Histogram of Cu94W6 irradiated to 0.75 dpa showing the precipitate size distribution. The inset is the corresponding log-normal plot.
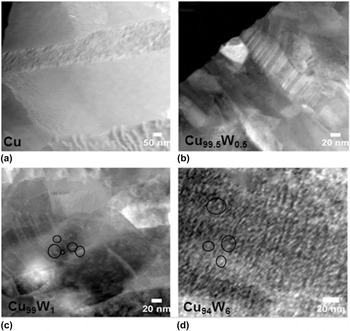
HAADF-STEM images of precipitation and precipitate size distribution in (a) pure Cu, (b) Cu99.5W0.5, (c) Cu99W1, and (d) Cu94W6 irradiated to a dose of 20 dpa. In Cu99W1 and Cu94W6, W precipitates with high atomic number (represented by black circles) appear white in the dark background of Cu matrix.
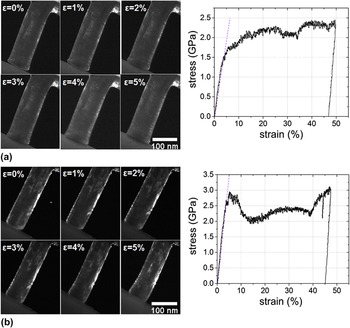
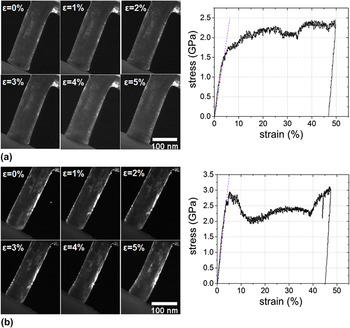
In situ nanopillar compression experiments (Fig. 5) were performed on select Cu94W6 samples. The yield strength (σy) increases from 1.55 ± 0.11 GPa for the as-grown pillars to 2.24 ± 0.07 GPa for pillars irradiated to 5 dpa. Using of the approximation H = 3σy Reference Khalajhedayati and Rupert7,Reference Tabor25 indicates that the indentation hardness values are reasonably consistent with the nanopillar compression results (see Fig. 2 for comparison). Since the narrow pillars were irradiated perpendicular the direction of the film growth, the damage profile is inherently more uniform along the loading axis. The difference in the hardness values for the irradiated sample measured between the two different techniques could result from a number of causes, for example, somewhat more uniform damage in the nanopillar compared to the film in nanoindentation. The difference, however, is small, and we can conclude that the indentations hardness measurements reasonably capture the representative behavior of the irradiated materials.
Time-lapse dark-field images of in situ compression tests in Cu94W6 alloy (a) as-deposited sample and associated stress strain curve showing a yield strength (σy) of 1.55 ± 0.11 GPa and (b) sample irradiate to a dose of 5 dpa showing with σy = 2.24 ± 0.07 GPa.
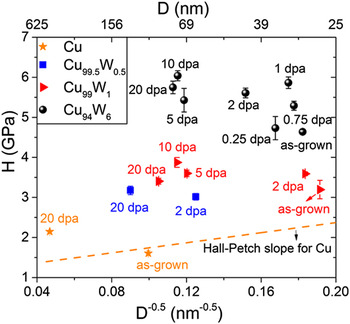
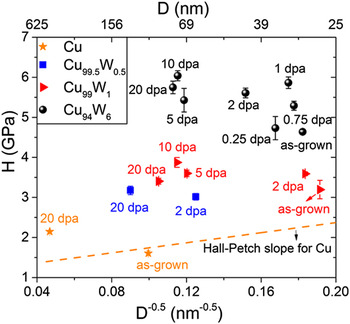
Grain sizes of select samples are measured from TEM images. During the first 1 dpa where precipitation occurs and the hardness saturates, the grain diameters in the alloys grow only by ∼6–8%. After 20 dpa, on the other hand, the grains have coarsened by almost a factor of 2, which could influence hardness. Approximate irradiation-induced grain growth rates are 4.72 × 10⁶ nm3/dpa, 8.06 × 10⁴ nm3/dpa, 3.9 × 10⁴ nm3/dpa, and 2.5 × 10⁴ nm3/dpa for the pure Cu, Cu99.5W0.5, Cu99W1, and Cu94W6 alloys, respectively, calculated assuming cubic growth kinetics. Increasing W concentration clearly suppresses irradiation-induced grain growth. In Fig. 6 hardness is plotted for all alloys against the lateral grain size−0.5 obtained here from various TEM/STEM images. No significant dependence of hardness on the grain size is observed for samples varying between 30 nm in the as-grown condition to 75 nm after 20 dpa. None of the materials tested exhibit a positive slope characteristic of Hall–Petch in Cu. In fact, the finer grained material irradiated at a low dose is softer than the coarser grained materials obtained at the high dose. Therefore, Hall–Petch behavior is limited and secondary to alloying related hardening mechanisms in the irradiated Cu–W samples.
Hall–Petch plot for Cu, Cu99.5W0.5, Cu99W1, and Cu94W6 under different room-temperature irradiation conditions. The yellow dotted line is the Hall–Petch line for nanocrystalline Cu obtained from data in the literature. Reference Chen, Lu and Lu1–Reference Sanders, Eastman and Weertman3 D = grain size.
IV. DISCUSSIONS
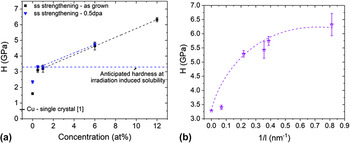
The as-deposited samples and those irradiated to less than 0.5 dpa, exhibit solid solution strengthening. For coarse-grained samples, hardness should increase as the square root of the solute concentration, but nanograined samples often exhibit a linear dependence with either a positive or negative slope. We observe linear strengthening between 0.5% W and 12% W. Rupert et al. developed a model for solid solution strengthening in nanocrystalline alloys.
Reference Rupert, Trenkle and Schuh26
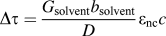
The model assumes that plasticity results from the complete emission and adsorption of a lead partial before the trailing partial is emitted. They showed that in nanocrystalline alloys the shear modulus, G, is the limiting variable and ∂G/∂c governs solid solution strengthening. This increase in the shear strength is given by
 $\Delta \tau = {{{G_{{\rm{solvent}}}}{b_{{\rm{solvent}}}}} \over D}{\varepsilon _{{\rm{nc}}}}c$
, where G and c are defined above, b is the burgers vector in this case, D is the grain size, and ε captures the strain due to change in lattice parameter and shear modulus. The slope of the experimental linear fits for the as-grown and irradiated (0.5 dpa) samples are 0.28 and 0.27 GPa/at.% [see Fig. 7(a)]. Using G
Cu = 49.9 GPa, b
Cu = 0.253 nm, and D = 25 nm, the prefactor term for the increase in shear strength is ∼0.23 GPa/at.%, which agrees well with the values obtained from the linear fits. The linear fit described here does not include our pure Cu value. We note, however, that the grain sizes of the alloyed samples are considerably smaller, ∼25–35 nm, than that in pure Cu ∼100 nm. While the Hall–Petch effect is relatively inconsequential in the alloy samples measured here, it is still important in the pure material making it important to compare the pure and alloyed samples on a consistent basis. Extrapolation of the linear composition-dependent relationship to 0% W results in a hardness more consistent with the pure Cu nanograin hardness limit of ∼2.5 GPa. This value indeed agrees with the hardness of pure Cu, for grain size less than ≈25 nm.
Reference Youssef, Scattergood, Murty and Koch27
(a) Variation of hardness as a function of initial solute concentration under different conditions. The dotted line is the value of hardness anticipated at the nonequilibrium solubility of 0.7 at.% in Cu–W alloys. The value of single crystal Cu(111) is obtained from the literature Reference Dub, Lim and Chaudhri37 and (b) variation of hardness as a function of the inverse precipitate spacing (1/l). The value at 0 corresponds to the anticipated hardness at irradiation-induced solubility limit.
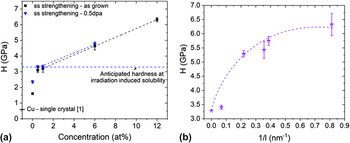
The sudden onset of increased hardness in Cu94W6 at ∼0.75 dpa is consistent with W precipitation. The increase in yield strength after the onset of precipitation to the saturated value occurs due to an increase in the density of precipitates [compare Figs. 3(c) and 4(d) for the case of Cu94W6]. If W precipitation is the only contribution to irradiation-induced strengthening after saturation, Δσppt, and that it is additive with solid solution strengthening, σss, resulting from the ≈0.7% irradiation-induced solubility, the total strength may be expressed as σy = Δσppt + σss. The hardness value of the Cu99.5W0.5 sample can be used to approximate σss. The increase in yield strength due to Orowan looping, Δσppt, due to the presence of obstacles spaced at a distance, l nm apart, is expressed as
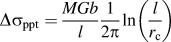 $\Delta {\sigma _{{\rm{ppt}}}} = {{MGb} \over l}{1 \over {2\pi }}\ln \left( {{l \over {{r_{\rm{c}}}}}} \right)$
Reference Was28
where, M is the Taylor factor (2.99 for nanocrystalline Cu deposited with a {111} texture
Reference Yuan, Beyerlein and Zhou29
), and r
c ≈ 2b
Reference Gelles30
is the dislocation core radius. The interparticle spacing (l) is calculated from the precipitate volume fraction (f) and precipitate size (d) through
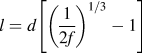 $l = d\left[ {{{\left( {{1 \over {2f}}} \right)}^{1{\rm{/}}3}} - 1} \right]$
.
Reference Zhang and Chen31
The equation H = 3σy is again utilized to scale hardness to yield strength. A plot of hardness against the inverse precipitate spacing shows reasonable agreement with the above equation [Fig. 7(b)] (regression coefficient = 0.87). The data was fit by fixing the value of hardness at 1/l = 0 to be the anticipated hardness at irradiation induced solubility limit. The inability to fit the Cu99W1 sample irradiated to 20 dpa could be explained by the fact that only 0.3 at.% W form precipitates and hence the precipitates are spaced too far apart to have a significant strengthening effect.
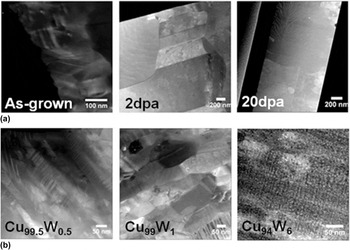
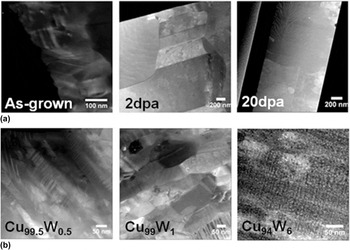
Finally, we consider the role of twin evolution in affecting the hardness change of the pure Cu samples under irradiation. During PVD of (111) textured Cu this films (111) twins form at relatively high densities. Reference Anderoglu, Misra, Wang and Zhang10,Reference Chen, Li, Yu, Wang, Kirk, Li and Zhang32,Reference Jiang, Klemmer, Barnard, Doyle and Payzant33 Irradiation-induced migration of coherent and incoherent twin boundaries has been studied extensively in Cu both through experiments and molecular dynamics simulation, and it has been shown that their density decreases with the dose. Reference Chen, Wang, Kirk, Li, Wang and Zhang34,Reference Li, Wang, Wang, Serruys, Nastasi and Misra35 The evolution of twin density in pure Cu at three different doses is shown in Fig. 8(a). As evident, the twin spacing changes from ∼10 nm in the as-grown sample to ∼250 nm in the sample irradiated to 2 dpa, and no twins in the sample are irradiated in the 20 dpa sample. Comparing the cross-sectional TEM micrographs in Fig. 8(b), taken from samples irradiated to 20 dpa, indeed show pure Cu devoid of twins and an increasing twin density with increasing W concentration. The average twin spacing determined from multiple TEM micrographs for samples irradiated at 20 dpa are 9.7, 10.8, and 2.9 nm for Cu99.5W0.5, Cu99W1, and Cu94W6, respectively [Fig. 8(b)]. The twin spacing in Cu94W6 is difficult to observe in Fig. 8(b), due to their small spacing, a high-resolution image is included in Supplementary Material Fig. S2. Their presence is not significant for hardening in the W alloy samples: note, the as-grown pure Cu contains a high density of such twins, but pure Cu remains significantly softer than the as-grown alloy samples. We can, however, attribute the transient reduction in hardness of the pure Cu sample observed between the doses of 0.75 and 2 dpa to twin annihilation. Twins annihilate through the motion of incoherent segments, which must be nucleated under irradiation (see Refs. Reference Chen, Wang, Kirk, Li, Wang and Zhang34 and Reference Li, Wang, Wang, Serruys, Nastasi and Misra35 for details). We can thus understand qualitatively the hardness behavior in pure Cu on the basis that irradiation produces point defect clusters Reference Li, Hattar and Misra36 and dislocation loops that harden the sample, while at the same time, loss of twins results in some softening. Twins serve as sinks for irradiation-induced defects and the decreased twin density can result in higher concentrations of associated defects that cause radiation hardening. Thus, the system only reaches steady state after the twin population stabilizes. The absence of detwinning in alloy samples is possibly explained by the presence of W solutes and particles that suppress the nucleation of incoherent segments and also suppress their migration.
(a) Evolution of Cu twins as a function of irradiation dose and (b) twin spacing in alloy samples irradiated to 20 dpa.
V. CONCLUSIONS
The results reported here demonstrate the relative importance of grain boundaries, twinning, solid-solution, precipitation, and irradiation-induced hardening in Cu–W alloys. Promoting a high number density of W precipitates provides the most effective means to strengthening the alloys tested. The degree of strengthening scales in a manner consistent with predictions for Orowan looping. Solid-solution tungsten alloying produces hardening that scales linearly with composition, consistent with the nanoscale mechanism proposed by Rupert et al. Reference Rupert, Trenkle and Schuh26 Grain boundary and nanotwin strengthening mechanisms are relatively inconsequential in these Cu–W alloys. Irradiation hardening due to the accumulation of irradiation point and line defects is also weak in the Cu–W alloys. Grain size, twin density, and the accumulation of irradiation-induced defects all have a measurable effect on the hardness of the pure Cu, which is significantly softer than the alloys in all cases.
AUTHOR DECLARATION
The authors declare that this work has not been published, in whole or in part, by another journal.
Supplementary Material
To view supplementary material for this article, please visit https://doi.org/10.1557/jmr.2017.295.
ACKNOWLEDGMENTS
This research was supported by the US DOE-BES under Grant DEFG02-05ER46217. The work was carried out in part in the Frederick-Seitz Materials Research Laboratory Central Facilities, University of Illinois at Urbana-Champaign.