1. INTRODUCTION
Nonlinear time series analysis has become a reliable tool for the study of complicated dynamics from measurements. Chaos and nonlinear dynamics have provided new theoretical and conceptual tools that allow comprehending the complex behaviors of systems. Fault detection schemes by these techniques are quite checkered in application. They range from the classification of complex current waveforms in transformers via the fractal dimension method (Purkait & Chakravorti, Reference Purkait and Chakravorti2003) to the quantification of the backlash that showed chaotic behavior (Tjahjowidodo et al., Reference Tjahjowidodo, Bender and Brussel2007), trying to correlate the measures with the changing backlash conditions. The latter incidentally mentions the advantages and the limitations of chaotic classification by concluding that chaos quantification could be used as a quantitative mechanical signature of a backlash component. However, there is a drawback. The proposed method becomes ineffective for noisy data, and proper noise reduction needs to be applied. This work is a representative study for the use of chaos in fault detection, displaying cons and pros in potential research.
In tool status detection, there is a plethora of methods that are in wide use compared to nonlinear time series analysis. For example, Ravindra et al. (Reference Ravindra, Srinivasa and Krishnamurthy1997) used acoustic emission for tool condition monitoring. They found that autoregressive parameters, power of the acoustic emission signal, and autoregressive residual signals are quite useful features in metal cutting to determine the condition of the tool. Scheffer and Heyns (Reference Scheffer and Heyns2001) employed vibration and strain measurements from the tool tip to detect the wear of diamond tools used in turning operations of the aluminum pistons. Classification of wear was achieved through self-organizing networks. Tansel et al. (Reference Tansel, Arkan, Bao, Mahendrakar, Shisler, Smith and McCool2000a) tried to establish a link between the cutting force characteristics and the tool wear using neural networks in microend milling. Another Tansel et al. (Reference Tansel, Trujillo, Nedbouyan, Velez, Bao, Arkan and Tansel1998) study made a classification by adaptive resonance theory and abductory induction mechanism to estimate wear again in microend milling with acceptable results. Panda et al. (Reference Panda, Chakraborty and Pal2008) used artificial neural networks, similar to the work by Tansel et al. (Reference Tansel, Arkan, Bao, Mahendrakar, Shisler, Smith and McCool2000b), in the prediction of the wear in drill bits. Panda et al.'s work is a step forward from Tansel et al. (2000b) in multiple ways. First, not just one but two network architectures were implemented in the prediction of flank wear, and then the performance of these two topologies was compared. Second, multiple sensing was achieved in measuring the vibration data. Thrust force and torque, along with vibration signals, were measured and included in the decision process, and a better prediction was claimed. Atlas et al. (Reference Atlas, Ostendod and Bernard2000) stated that hidden Markov models (HMMs) could be quite expedient for milling operations with three different time scales, showing that HMMs give accurate wear prediction. Sortino (Reference Sortino2003) handled determination of tool status from a novel perspective. He processed tool images and applied a statistical filter for the optical detection of tool status. However, this method failed to pinpoint early or smaller wear or faults on the tool.
One way of quantifying a nonlinear time series is the measure of the rate of loss of predictability, Kolmogorov–Sinai entropy (KSE), which reveals how far into the future a series can be predicted with a given set of initial information. Even though KSE has almost become commonplace in medicine for prediction of epileptic seizures, it is hardly a widespread tool in condition monitoring in engineering applications. One relevant study on predictability via metric entropy in a medical work is that of Drongelen et al. (Reference Drongelen, Nayak, Frim, Kohrman, Towle, Lee, McGee, Chico and Hecox2003), who demonstrated the feasibility of using the metric entropy of the time series to anticipate seizures in pediatric patients with intractable epilepsy. Drongelen et al. came up with successful anticipation times between 2 and 40 min. A similar study on the prediction of epilepsy seizures has prompted a research on KSE in failure analysis that forms the basis of this paper (Sevil, Reference Sevil2006).
Nonlinear analyses can be thought of as decision support tools that are capable of indicating the development of probable failure in machine components or systems. Machine tool condition monitoring has great significance in modern manufacturing processes. Various techniques have been employed for a rapid response to unexpected tool breakage to prevent possible damage and down time. Although there are different types of condition monitoring techniques currently in use for the diagnosis and prediction of drill bit breakage, little attention has been paid to the detection of chaotic behavior in time series vibration signals. Ertunc and Oysu (Reference Ertunc and Oysu2004) proposed real-time identification of drill bit wear based on HMMs on cutting force and torque measurements during metal drilling. Furthermore, Li and Tso (Reference Li and Tso1999) used the fuzzy logic classification method to classify the tool wear states. Both methods proved their reliabilities on classification of tool wear.
Rough sets (RSs) are a relatively new method, which Pawlak (Reference Pawlak1982) proposed in the early 1980s. Essentially, it is related to fuzzy sets, an extension to the classical set theory, and is an approximation of sets using an ensemble of sets, which will be explained shortly. Fuzzy logic has been formulated historically to account for subjective uncertainty, but the reasoning contains no fuzziness because the deduction is exclusively crisp. In contrast, RSs deal with not only this so-called subjective uncertainty but also incongruent and/or incomplete data that might be present because of the lack of precision and other limitations.
The good aspect of RSs is that it is self-sufficient and does not require any previous knowledge frame. Despite the seemingly close resemblance to fuzzy set theory and Dempster–Shafer theory, it is an independent discipline in its own right. It is quite capable of finding patterns beneath the surface, thus helping to reduce redundancies, providing data reduction if possible. By a series of formulations, data are classified and assigned significance. This feature assorts data into degrees of certainties, by which consistency of data may be understood. RS theory also has applications in the field of condition monitoring. The most relevant work was the study by Pasek (Reference Pasek2006). Pasek carried out a classification framework using RSs. The classification was based on wear, and grouped into three quality levels. All three condition attributes were fuzzified into three memberships. The differences from this study are manifold. Pasek classified tool wear, but we approached the tool failure phenomenon as a binary event. Condition attributes are formed by both statistical and nonlinear measures in this study. High levels of sensitivity, accuracy, and specificity in Pasek's work attest to the success of the method. Another successful story may be found in Novicki et al. (Reference Nowicki, Stowifiski and Stefanowski1992). They collected data on rolling bearings from industry and from the laboratory. The study reported promising results when vibration and acoustic symptoms were available. In other recent works, RS theory was used for diagnosis of the valve fault for multicylinder diesel engines (Shen et al., Reference Shen, Tay, Qu and Shen2000; Tay & Shen Reference Tay and Shen2001), as well as for medical implementations (Szczuka & Wojdyllo, Reference Szczuka and Wojdyllo2001). Lui and Shi (Reference Liu and Shi2001) proposed a novel method to detect faults of valves in a three-cylinder reciprocating pump using RSs, and they achieved identification of different types of faults based on their respective positions. Szczuka and Wojdy (Reference Szczuka and Wojdyllo2001) also tried to accomplish a new tool for noise-resistant classification of EEG signals based on RSs. These authors came up with promising results by combining wavelets, neural networks, and RSs. Despite these examples, the RSs technique is rarely used in the diagnostics of machine tool conditions. Specifically, implementation of the RSs method to machine tool diagnosis and prediction of tool breakage is rare in the literature.
In this study, the prediction of small drill bit breakage occurrence was examined by RS rules, whereby an attempt was made to correlate the chaos invariants' variation with the changing conditions of a drilling process in order to introduce a possible early damage detection method for mechanical systems.
2. NONLINEAR TIME SERIES ANALYSIS
2.1. Fractal dimensions
The strange behavior of chaotic systems has the geometry of the set in phase space formed by the trajectories of a system called the attractor, whose trajectories in phase space will have some final state on it, as the whole system evolves in time. Briefly, an attractor is a set to which all neighboring trajectories converge. Moreover, the attractor of a system determines the long-term behavior of that system. Attractors are generally called strange attractors, because they generally have a very complicated fractal (self-similarity) structure in chaotic systems. They usually have a noninteger dimension that is less than the dimension of phase space; for example, if the phase space is two dimensional, the attractor will have less than two dimensions.
One of the most widely used fractal dimension is the correlation dimension that is used for measuring the complexity that quantifies the geometry and the shape of the strange attractor. The correlation sum is used to estimate the correlation dimension. The correlation sum for a collection of points sn in some vector space is the fraction of all possible pairs of points that are closer than a given distance ɛ in a particular norm. The correlation sum of a time series is computed by

where C is the correlation sum of the system in embedded dimension m. The correlation sum just counts the pairs (si sj) whose distance is smaller than ɛ. In Equation (1), ‖·‖ represents the vector distance (Euclid distance of two vectors) and H is the Heaviside step function.
The correlation sum just counts the pairs (si sj) whose distance is smaller than ɛ. In the limit of an infinite amount of data (N → ∞) and for small ɛ, it is expected that C is to scale like a power law, C(ɛ) ∝ ɛD, and according to this power law property a dimension value D, which is based on the behavior of a correlation sum, can be defined as

This dimension is called the correlation dimension, and it is a characteristic quantity for a time series. The correlation dimension simply shows how C(ɛ) scales with ɛ. There are different types of fractal dimensions, for example, box counting and Hausdorff, which differ from each other by the “packaging” of data points (Kaya, Reference Kaya2005).
2.2. Metric entropy
The metric (Kolmogorov–Sinai) entropy is a measure to characterize the chaotic motion of a system in an arbitrary-dimensional phase space. It is proportional to the rate of loss of information at the current state of a dynamical system in the course of time. Metric entropy is a measure of the rate of loss of predictability, which indicates how far into the future a prediction may be possible, given the initial conditions. It originates from information theory.
In time series analysis, if the observation of a system is considered as a source of information, then the metric entropy can supply a quantitative answer as to how much information can be possessed about the future when the entire past has been observed. The metric entropy of a time series is

3. INFERENCE BY RSs
3.1. Formulation
A set D is rough (approximate, inexact) with respect to a collection of sets C if it has a nonempty boundary region when approximated by C. Otherwise, it is crisp (exact). Thus, the set of elements is rough if it cannot be defined in terms of the data, that is, it has some elements that can be classified neither as a member of the set nor its compliment in view of the data.
The lower approximation of a set D (D could be an attribute: 1, 0; yes, no; etc.) is the set of all facts that can be for certain classified as D in view of the data, the upper approximation of a set D, with respect to the data, is the set of all facts that can be possibly classified as D, the boundary region of a set X with respect to the data D is the set of all the facts that can be classified as neither D nor non-D in view of the data (Pawlak, Reference Pawlak2002).
Given a collection of sets C = {C 1, C 2, C 3, …} and a set D, in which a nonempty finite set of objects (search space) U, define the lower approximation of D by C,

upper approximation of D by C,

and boundary of D by C,

3.2. Analysis of the experimental data
The experimental setup for the prediction of small drill bit breakage is shown in Figure 1. The test rig comprises a printed circuit board drill, drill stand, drill bit, accelerometer, power supply/coupler, and a PC. Small high-speed steel twist drill bits (1 mm) were used in the experiments. A high-carbon steel block is used as a drilling material because of its high hardness, which ensures that the drill bit is subjected to greater torque and thrust forces.
The schema of the drill-bit breakage experiments.

Generally, drill bit breakage, which is caused by buckling and fluctuations in the cutting force, is a major problem with small drill bits of 2 mm or less. The amount of feed, as well as the torque and thrust force, may become too big for the diameter, and tend to cause breakage in small drill bits. With a standard size drill bit of about 3 mm or more, drill bit breakage is not a major problem, because as the diameter increases, the drill bit becomes rigid and tends to wear out instead of breaking. Therefore, 1-mm diameter drill bits were used for testing, because tool breakage occurs catastrophically and it is difficult to predict the breakage beforehand.
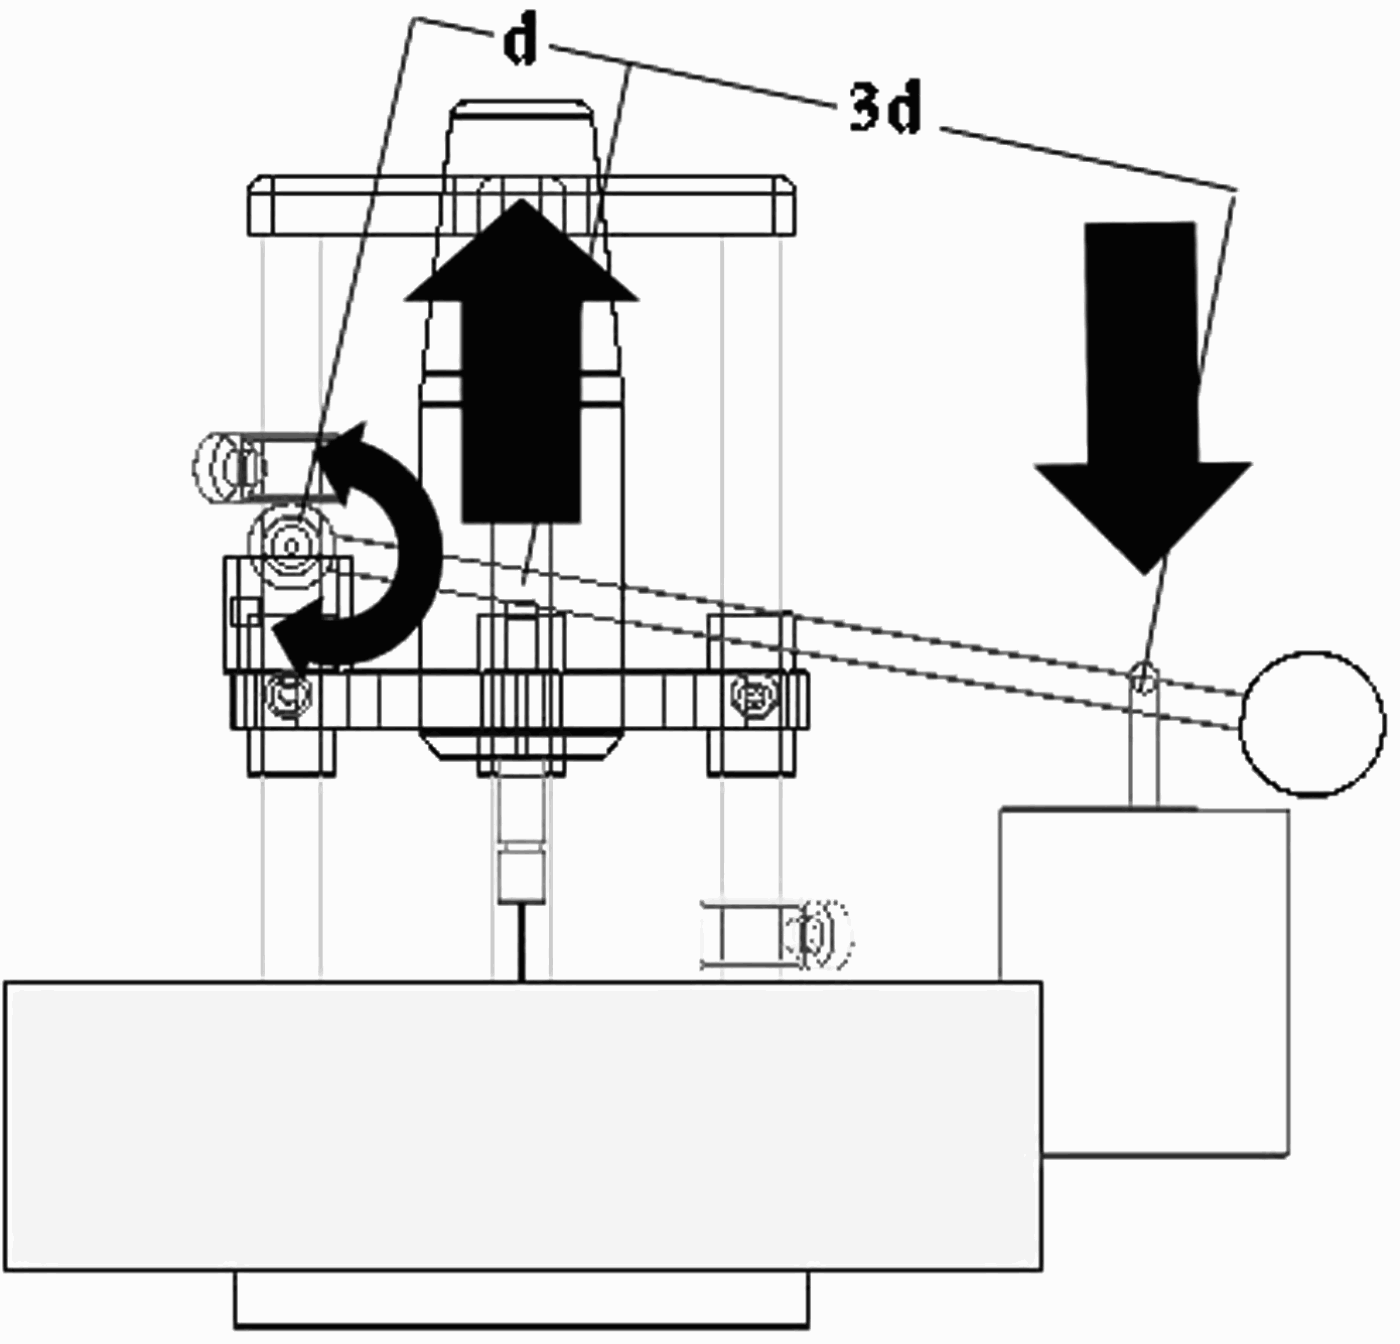
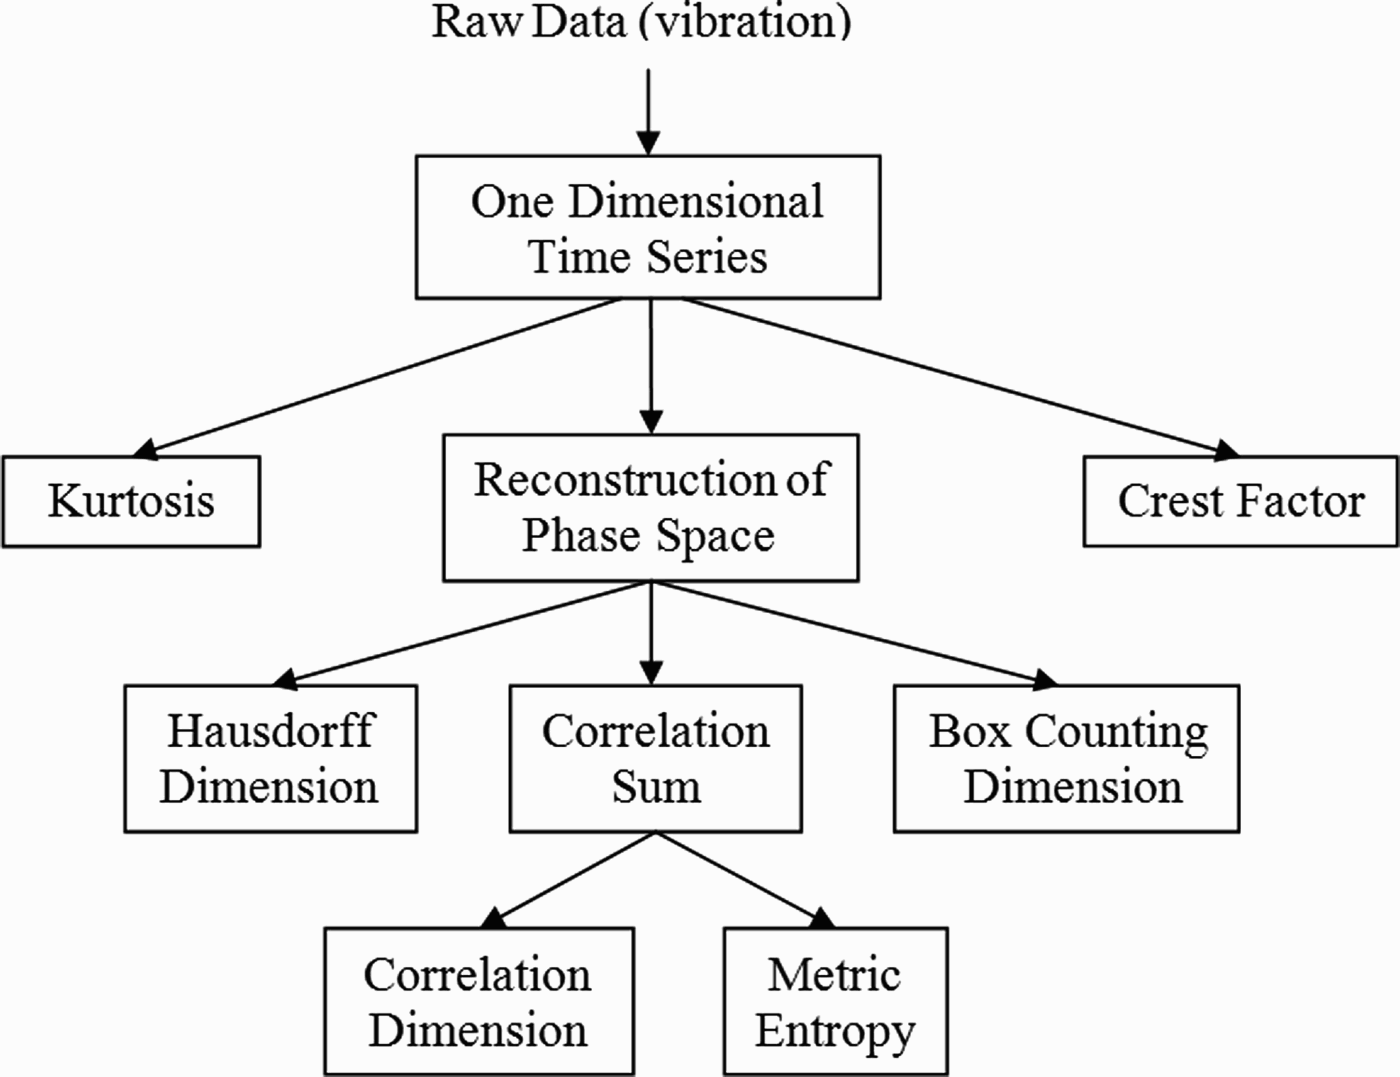
Vibration data were taken by a ceramic shear triaxial accelerometer (Kistler 8762A50) with high sampling speed (192 kHz), where for the feeding process scale weight is used to provide a constant feed rate for the drill (Fig. 2). Run-to-failure tests were performed on each drill bit, and vibration data were taken consecutively at equal time intervals. Statistical parameters (crest factor and kurtosis) were computed from the raw vibration data, which is a one-dimensional time series at the beginning. For computation of nonlinear invariants (Hausdorff dimension, correlation dimension, and metric entropy), a phase space is reconstructed out of this one-dimensional time series (Fig. 3). By intervariations of these values between two successive measurements, a drop–rise table was created. Any variation that is within a certain threshold, which in this case was ±20% of the measurements, was assumed to be constant. Any fluctuation above or below was assumed to be either a rise or a drop. After this drop–rise table was created, the occurrence of breakage was examined for one or two steps ahead from the values in the table.
A schematic of a lever force diagram.

A flow chart of the data analysis process.

Examination of the data reveals the following: the data are inconsistent, which is because of events 6, 7, 9, 11, 15, 21, 22, 26, 27, and 30. Set {2, 3, 8,13,14,19, 20, 25, 29, 32, 33, 35, 36, 37, 39} is the maximal set of facts that can certainly be classified as drill bit failure in terms of the drilling characteristics. Set {2, 3, 6, 7, 8, 9, 11, 13, 14, 15, 19, 20, 21, 22, 25, 26, 27, 29, 30, 32, 33, 35, 36, 37, 39} is the set of all the facts that can possibly be classified as incidents of failure. Set {6, 7, 9, 11, 15, 21, 22, 26, 27, 30} is the set of facts that can be classified as neither failure nor none.
In the light of the above sets, the following approximations are possible. Note that the set {6, 7, 9, 11, 15, 21, 22, 26, 27, 30} is the difference between sets {2, 3, 6, 7, 8, 9, 11, 13, 14, 15, 19, 20, 21, 22, 25, 26, 27, 29, 30, 32, 33, 35, 36, 37, 39} and {2, 3, 8, 13, 14, 19, 20, 25, 29, 32, 33, 35, 36, 37, 39}. The set {2, 3, 8, 13, 14, 19, 20, 25, 29, 32, 33, 35, 36, 37, 39} is the lower approximation (certain) of the set {2, 3, 6, 8, 13, 14, 19, 20, 25, 27, 29, 30, 32, 33, 35, 36, 37, 39}.
The set {2, 3, 6, 7, 8, 9, 11, 13, 14, 15, 19, 20, 21, 22, 25, 26, 27, 29, 30, 32, 33, 35, 36, 37, 39} is the upper approximation (possibly) of the set {2, 3, 6, 8, 13, 14, 19, 20, 25, 27, 29, 30, 32, 33, 35, 36, 37, 39}. The set {6, 7, 9, 11, 15, 21, 22, 26, 27, 30} is the boundary region (inconsistent) of the set {2, 3, 6, 8, 13, 14, 19, 20, 25, 27, 29, 30, 32, 33, 35, 36, 37, 39}.
3.3. Data reduction
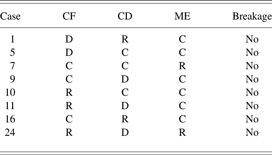
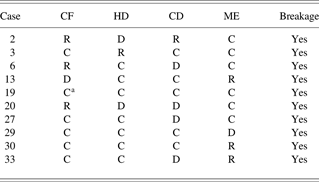
Superfluous information can be removed to reduce the data, still allowing conclusions to be drawn. But the consistency of the data must be preserved. Thus, we may define the degree of consistency. A minimal subset of data that preserves consistency of the data is called a “reduct.” Tables 1 and 2 are reduct tables.
Reduct table for no breakage

Note: CF, crest factor; CD, correlation dimension; ME, metric entropy; D, drop; R, rise; C, constant.
Reduct table for breakage

Note: CF, crest factor; HD, Hausdorf dimension; CD, correlation dimention; ME, metric entropy; R, rise; D, drop; C, constant.
aEven though the CF and kurtosis values change as if coupled in all cases, there is a rise in kurtosis while the CF value remains constant for this case.
An in-depth analysis of the failure charts produced the following no-breakage and breakage tables. A close inspection would reveal that the factors to failure are different from those to no failure. Crest factor, correlation dimension, and metric entropy are the sole inputs that should be considered for a healthy life if Hausdorff dimension and kurtosis remained constant. For example, in Table 2, if all the rest did not alter, a rise in metric entropy meant no failure; in Table 2, a rise in Hausdorff dimension ended in failure, as in case 3.
3.4. Certainty and coverage factors
Let ϕ designate the “condition” and Ψ the “decision” of the rule. In short, if ϕ then Ψ. Define two conditional probabilities (Pawlak, Reference Pawlak2002): the certainty factor and the coverage factor. In the certainty factor,

and in the coverage factor,

The certainty factor distinguishes consistent cases from inconsistent ones. It is absolutely 1 when the data are crisp. When a boundary region is in question, it falls short of 1, designating the percentage of a certain inconsistent outcome, given a certain set of conditions. In contrast, the coverage factor is an indicator of how widespread a certain set of conditions and their associated decisions are among all of the same sort of decisions. For example, the coverage factor helps clarify the extent of rainy road accidents among all types of accidents.
3.5. Interpretation
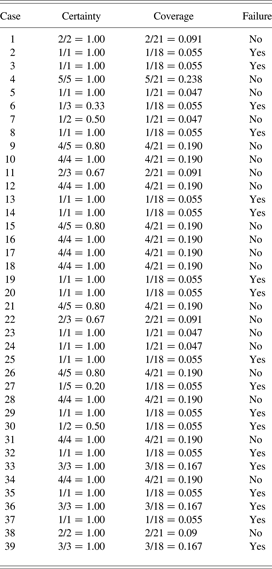
Table 3 assigns 1 to the certainty factor of case 1. If (there is a drop in crest factor) and (there is a rise in correlation dimension), then (there is no failure) is a certain decision rule. However, for example, as in case 27, if (there is a drop in correlation dimension), then (there is a failure) is an uncertain decision rule, as its certainty factor denotes. Certain decision rules in the table describe the lower approximation of the set of facts, and uncertain ones describe the boundary region of the set of facts.
Certainty and coverage factors

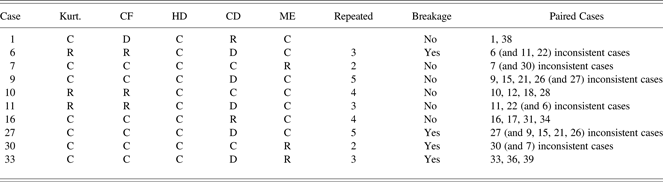
Coverage factors define how many times the conditions of a certain case have repeated themselves through other cases. The characteristic values of case 19 have occurred just once, but the values of case 10 have turned up 4 times. The summary of the repetition of the instances is provided in Table 4.
Summary of repetition of instances

Note: Kurt., kurtosis; CF, crest factor; HD, Hausdorf dimension; CD, correlation dimension; ME, metric entropy; C, constant; D, drop; R, rise.
3.6. Inductions of rules from reduct tables
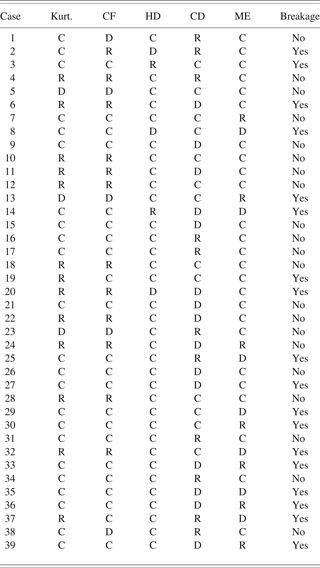
By RS analysis, a number of inductions may be reached. The following is the core of the 39 by 7 data to 11 plain rules. This is accomplished by a compromise of conflict, and reduction of redundance, and simplification. The rules are stated with the condition that all the remaining unstated parameters are assumed unchanged during these specified changes. Redundance reduction and simplification were performed either by Table A.1 or Table 4. To give an example, cases 10, 12, 18, and 28 are repeated four times. In all of these cases, no breakage is observed and all four instances are consistent. All but one must be removed to reduce the redundancy, in which case 10 was kept and the remaining were discarded. Rule number 4 is generated from case 10. The reduction of redundancy may be observed in Table 1, which is the reduct table for no failure. When statistical measures kurtosis and crest factor gave almost identical results, kurtosis was also opted out. Table 4 gives a summary of all of the cases in all 39 experiments.
1. If (a drop in ME) then failure.
2. If (a rise in CF) and (a drop in CD) and (a rise in ME) then no failure.
3. If (a drop in CF) then no failure.
4. If (a rise in CF) then no failure.
5. If (a rise in CD) then no failure.
6. If (a rise in HD) then failure.
7. If (a drop in CD) and (a rise in ME) then failure.
8. If (a drop in CF) and (a rise in CD) then no harm.
9. If (a rise in CF) and (a rise in HD) and (a drop in CD) then failure.
10. If (a drop in CF) and (a rise in ME) then failure.
11. If (a rise in CF) and (a drop in HD) and (a drop in CD) then failure.
In the above, ME is the metric entropy, CF is the crest factor, CD is the correlation dimension, and HD is the Hausdorf dimension.
3.7. Performance analysis
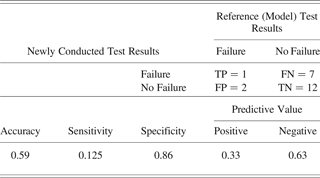
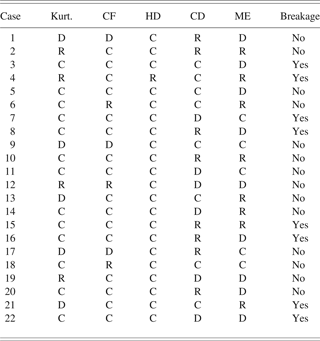
Following the rule inductions given above a series of tests were conducted to check the validity of these rules. These test results are given in the Table A.2. Table 5 outlines the performance evaluation, which is also known as the confusion matrix. Having established a rule base from earlier 39 experiments, 22 new experiments were conducted. Of these 22 experiments, 8 failures and 14 no failures occurred. Out of 8 failures, unfortunately, only 1 could be foreseen. Seven failure cases were wrongly predicted as no failures. Out of 14 no-failure cases, 12 were correctly estimated to be no failures. Correctly predicted failure cases were designated by true positive (TP), correctly predicted no-failure ones were shown by true negative (TN), incorrectly predicted failure cases were denoted by false positive (FP), and finally, incorrectly predicted no failure cases were given by false negative (FN).
Performance evaluation

Five measures of performance were also provided to evaluate the overall capability of the rule space. These are accuracy = (TP + TN)/(number of tests), sensitivity = TP/(TP + FN), specificity = TN/(TN + FP), positive predictive value = TP/(TP + FP), negative predictive value = TN/(TN + FN). Accuracy reveals the percentage of correctly identified cases of all failures and no failures. Fifty-nine percent accuracy was reached in diagnosing the drill bits. Sensitivity reflects the identified failures among all failures, which is conspicuously low, but specificity gives an idea of the performance of correctly diagnosing the no-failure situations. There was 86% specificity versus 12.5% sensitivity, which is an interesting finding. The rules are better at discovering no failures than failure instances. The positive predictive value was 33.3% because only one of three failure predictions was correct. The negative predictive value was 63%, and these results corroborated our findings.
4. CONCLUSIONS
A condition monitoring experiment through a series of accelerometer measurements on a table-top drill stand was carried out. Vibration time series data were used to reconstruct the original embedding space. The detailed analysis of determining the optimal lag, embedding dimension, and so forth can be found in Sevil (Reference Sevil2006). Using this single vibration measurement, six factors were used overall, which were thought to influence the fate of the drill bits. Statistical measures, as well as nonlinear ones, were explained. The number of parameters were deliberately kept high so as to produce an elimination, if possible, through an in depth analysis. Although not mentioned here, neural network modeling was also conducted to see if a black-box model would fit the observed data. Unfortunately, different topologies of backpropagation neural networks did not provide a satisfactory model. A fuzzy model was rejected immediately as a result of incomplete, inconsistent, and possibly inaccurate data. The threshold used for the RS table (20%) would obviously affect the precision of the constructed model. The 20% threshold in this study was chosen based on examining the structure of the data. The 11 extracted rules represent the core information. We believe that RSs suit real data better than some of the existing techniques that could not handle the data characteristics. Nevertheless, RSs have their own limitations. For example, the conclusions we draw are not universal but are valid only for the data. Whether they can be generalized depends on how representative the data are of a larger data set. On a longer set of experiments, a manual inspection of the data would have been impossible, in which case a code should have been written to convert numeric records into qualitative labels, which are capable of dealing with the “kinks” in the data.
This work treated tool monitoring as a binary event. We believe that the binary approach lacks the finesse of similar research that instead observes gradual wear, because a gradual wear measurement and qualification are more realistic. However, the dimensional variations in the drill bit diameter motivated us to employ binary characterization. Another aspect is that 1-mm drill bits were tested. Any wear measurement within this range would be subject to variations, errors that could invalidate the experiments. The best part of the binary nature of the experiments is that the attributions do not involve uncertainty regarding the outcome of the experiments.
In the current state, the performance of the methodology must not be attributed to the general performance of the RSs. The manifold factors from the data to the measures employed all affect the eventual level of success. This level could definitely be improved through an increased number of sensors and better noise filtering, which have priority in the future research of the authors. Even though this article may have failed to convince the reader of the rightful merits of RSs, it is understood that it has more to do with the observation and the use of the measures rather than the nature of the RSs.
More research must be conducted regarding a list of metrics that could qualify the success of experiments for a similar setup. In this way, finding the extent to which success has been achieved could be possible. It is still uncertain that the use of all of the metrics mentioned has contributed to the current study. There are overlaps among some of the measures, and some of these overlaps exist for most of the 39 experiments. This hints that at least one measure, for example, the crest factor, could have been discarded with little expense to the overall performance.
The proposed RS decision frame performed better on healthy drill bits than bits approaching breakage. This could be explained by the nature of the data in the drill bit experiments, noise, and equipment to name a few. Another point that should be emphasized is that the rule space via RS theory is data specific. Addition of new data will change the core information. The reason for this is the inconsistencies contained in the data. We believe that RS theory may be used for modeling the data at hand, but one must expect gross errors when the model created henceforth is used for prediction. RS theory does best where everything else fails: it makes sense of the data when data contradicts itself. The next work will focus on such a task that would prove the valor of RSs in a similar application through an automated data analysis and that would seek ways to improve the accuracy of the established models.
Hakki Erhan Sevil is a Research Assistant in the Artificial Iytelligence & Design Laboratory at the Izmir Institute of Technology. He received his BS and MS degrees from Izmir Institute of Technology and is currently a PhD candidate in mechanical engineering at Izmir Institute Technology. His research interests include fault detection and isolation, fault tolerant control, industrial fault detection, condition monitoring, distributed sensing, and intelligent control systems.
Serhan Ozdemir founded the Artificial Iytelligence & Design Laboratory at Izmir Institute of Technology. He was awarded a scholarship following his graduation from the Mechanical Engineering Department of Dokuz Eylul University, Izmir, Turkey. He received his Master's degree in 1996 from the Illinois Institute of Technology and his PhD degree from the University of Florida, where his thesis focused on continuously variable power split transmission systems. Dr. Ozdemir's research at the lab ranges from intelligent control of artificial limbs to interpretation of ECG signals by fractals, but the lab focuses primarily on the processing of time series for machine health and fault diagnostics.
APPENDIX A
A.1. Kurtosis
Kurtosis is a characterization tool for the shape of a distribution. If the tails of the distribution are heavier than for a normal distribution, then the kurtosis of the distribution is positive. Kurtosis of the distribution is negative when the tails are lighter. A kurtosis of zero is possible for the normal distribution.

Drop–rise table of all values in all cases

Note: Kurt., kurtosis; CF, crest factor; HD, Hausdorf dimension; CD, correlation dimension; ME, metric entropy; C, constant; D, drop; R, rise.
A.2. Crest factor
The crest factor shows the ratio of the peak value of a waveform to its root mean square (RMS) value. It is defined by a pure number without units. The crest factor is sensitive to the sharp peaks in the waveform. The reason for this is that the peaks happen suddenly, so it does not contain much energy.


Drop–rise table of all cases in verification set

Note: Kurt., kurtosis; CF, crest factor; HD, Hausdorf dimension; CD, correlation dimension; ME, metric entropy; D, drop; C, constant; R, rise.
A.3. Hausdorff dimension
The Hausdorff dimension for a time series s is the number of spheres with radius ɛ, S(ɛ), required to cover s completely. Clearly, as ɛ gets smaller, S(ɛ) gets larger. As a limit, if S(ɛ) grows in the same way as 1/ɛD, as ɛ is squeezed down toward zero, then s has the dimension D:

A.4. Correlation dimension
The correlation sum is used for the calculation of the correlation dimension. The correlation sum just counts the pairs (si sj) whose distance is smaller than ɛ. In the limit of an infinite amount of data (N → ∞) and for small ɛ, it is expected that C will scale like a power law; C(ɛ) ∝ ɛD. According to this power law property, a dimension value D, based on the behavior of a correlation sum, can be defined as

A.5. Box-counting dimension
Box counting is the same calculation as in the Hausdorff dimension, but instead of counting spheres, the boxes, B(ɛ), for covering time series s are counted: