I. INTRODUCTION
Cu–Co and Cu–Fe alloys, whose phase diagrams show a metastable miscibility gap in the liquid state, are good candidates to be used as the advanced electrical and magnetic materials.Reference Biselli and Morris1,Reference Berkowitz, Mitchell, Carey, Young, Zhang, Spada, Parker, Hutten and Thomas2 For example, they are especially suitable for the applications in the manufacturing of electric contactor, semiconductor lead frames, wires and cables, magnetic recording, and magnetic sensors. These alloys, however, have an essential drawback that the miscibility gap poses problems during solidification. When such an alloy is cooled into the miscibility gap, it develops into two liquids.Reference Munitz, Elder-Randall and Abbaschian3,Reference Nakagawa4 Generally, the liquid–liquid phase transformation leads to a microstructure with a serious phase segregation under the conventional solidification conditions. Research indicates that rapid solidification techniques may have great potentials in the manufacturing of this kind of alloys.Reference Cao, Herlach, Kolbe, Görler and Wei5,Reference Guo, Liu, Jia, Su and Ding6
In recent years, Cu–Co–Fe system was used as a model alloy for the experimental and theoretical studies of the solidification behaviors of the alloys with a metastable miscibility gap in the liquid state.Reference Turchanin, Dreval, Abdulov and Agraval7 Many researchersReference Kim and Abbaschian8–Reference Curiotto, Battezzati, Johnson, Palumbo and Pryds10 measured experimentally the liquidus temperature and the liquid–liquid phase transformation temperature (binodal line temperature) of this system. Thermodynamic optimizations have been done by Turchanin et al.,Reference Turchanin, Dreval, Abdulov and Agraval7 Bamberger et al.,Reference Bamberger, Munitz, Kaufman and Abbaschian11 Wang et al.,Reference Wang, Liu, Ohnuma, Kainuma and Ishida12 and Palumbo et al.Reference Palumbo, Curiotto and Battezzati13 to establish the phase diagram of Cu–Co–Fe. Experiments have been carried out to investigate the solidification behaviors of Cu–Co–Fe alloy.Reference Munitz, Bamberger, Wannaparhun and Abbaschian9,Reference Dai, Cao and Wei14 However, the microstructure evolution of this alloy remains unclear up to date because the kinetic process of the liquid–liquid phase transformation is very complex.
We carried out rapid solidification experiment with Cu–Co–Fe alloy by using the high-pressure gas atomization technique. A model describing the microstructure formation in an atomized drop of Cu–Co–Fe during the liquid–liquid phase transformation alloy was developed. The model was first verified by comparing with the experimental results and then applied to investigate the kinetic details of the microstructure formation in the gas atomized drops of Cu–Co–Fe alloy.
II. EXPERIMENTAL PROCEDURES AND RESULTS
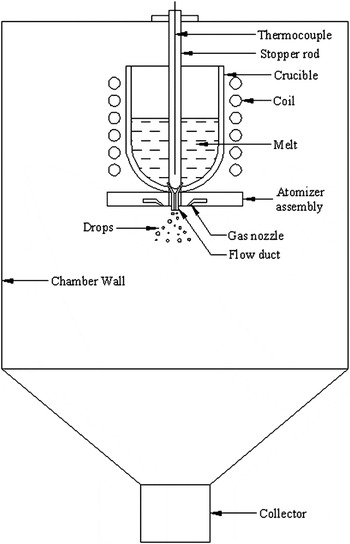
Cu-10 wt% Co-10 wt% Fe alloy was prepared by using Cu, Co, and Fe with a purity of 99.9% or higher. Figure 1 shows the schematic diagram of the atomized apparatus. The experimental procedures are as follows. Firstly, the raw materials were melted and overheated to 1693 K in a crucible using a vacuum induction furnace. The alloy was held at this temperature for 15–20 min to form a homogeneous, single-phase melt. Secondly, the melt was atomized by high pressure (3 mPa) N2 gas when it flowed through a thin bore in the bottom of the crucible. The atomized drops solidified while falling in the chamber. Finally, the powders were separated into classes by mechanical sieving and metallographically prepared. The microstructure was examined by using the optical microscopy and scanning electron microscopy.
Schematic diagram of the atomized apparatus.

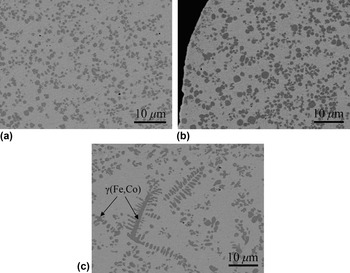
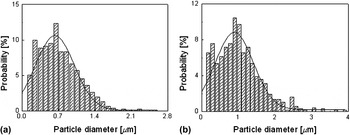
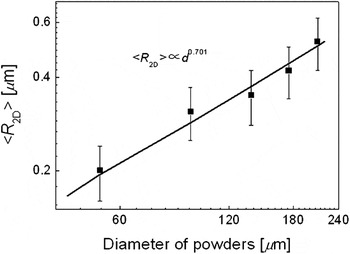
Figure 2 shows the typical microstructures of the powder of different diameters. An atomized powder of the diameter <220 µm shows a microstructure consisting of the well-dispersed spherical Fe–Co-rich particles and the Cu-rich matrix. The distributions of the apparent [two-dimensional (2D)] diameter of the Fe–Co-rich particles measured in the section plane of the powders is shown in Fig. 3. The 2D average radius of the Fe–Co-rich particles increases with the powder diameter, as shown in Fig. 4. An atomized powder of the diameter in the range from 280 to 355 µm shows a microstructure consisting of the γ(Fe, Co) dendrites, the spherical Fe–Co-rich particles and the Cu-rich matrix.
Microstructure of the Cu-10 wt% Co-10 wt% Fe powders of 125–150 µm (a), 200–220 µm (b) and 280–355 µm (c) in diameter.

Size distribution of the Fe–Co-rich particles in the powders of 125–150 µm (a) and 200–220 µm (b) in diameter. The bars are the measured results and the solid curves are the numerical fittings.

Experimental results (squares) and numerical results (solid line) of the 2D average radius of the Fe–Co-rich particles (<R 2D>) as a function of powder diameter (d).

III. DISCUSSIONS
A. Rapid solidification process of Cu-10 wt% Co-10 wt% Fe alloy
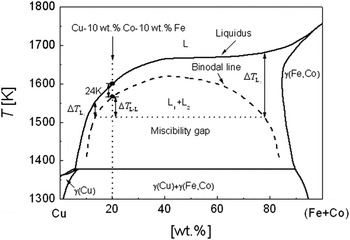
Figure 5 shows the vertical section x Fe:x Co = 1:1 of the Cu–Co–Fe phase diagram.Reference Kim and Abbaschian8 It indicates that γ(Fe, Co) tends to form in the melt first when a Cu-10 wt% Co-10 wt% Fe alloy is cooled below the liquidus. The liquid–liquid phase transformation may occur only when the melt is cooled into the metastable miscibility gap or achieves an undercooling >24 K.Reference Kim and Abbaschian8 The liquid–liquid phase transformation begins with the nucleation of the liquid Fe–Co-rich droplets. The compositions of the Cu-rich (L1) and Fe–Co-rich (L2) liquid phases vary according to the binodal surface in the Cu–Fe–Co phase diagram during the liquid–liquid decomposition as shown in Fig. 5. The Fe–Co-rich droplets tend to solidify (liquid-to-solid phase transformation) during cooling through the metastable miscibility gap under the effect of the undercooling  ${\rm{\Delta }}T_{{\rm{L}}_{\rm{2}} }$ (see Fig. 5). The transient nucleation rate for the solidification of the Fe–Co-rich droplets may be given by
 $I_{\rm{t}} = I_{\rm{s}} \exp ( - t/{\rm{\tau }})$ with I s being the steady-state nucleation rate and τ the incubation time for the nucleation. If the cooling rate of the atomized drop is so fast that the solidification of the Fe–Co-rich droplets does not occur during cooling through the metastable miscibility gap, as for the atomized drops of the diameter <220 µm, the Fe–Co-rich droplets will solidify under the peritectic temperature and the powder shows a microstructure consisting of the matrix phase and the dispersed Fe–Co-rich particles, as shown in Figs. 2(a) and 2(b). Otherwise, the Fe–Co-rich droplets solidify during cooling through the metastable miscibility gap. Because the composition of these particles is close to the composition of the γ(Fe, Co) phase, they may grow directly into the matrix liquid or act as heterogeneous nucleation sets of γ(Fe, Co) phase and cause the formation of the dendritic γ(Fe, Co) phase in the powders as shown in Fig. 2(c).
Vertical section x Fe:x Co = 1:1 (wt%) of the Cu–Co–Fe phase diagram.

B. Theoretical model for the microstructure evolution during the liquid–liquid decomposition
When a Cu–Co–Fe alloy is undercooled into the metastable miscibility gap, it transforms into two liquids. The liquid–liquid decomposition begins with the nucleation of the Fe–Co-rich droplets. The nucleation of the Fe–Co-rich droplets can be described with the classical nucleation theory. The stationary homogeneous nucleation rate is given byReference Granasy and Ratke15
 $$I = N_0 \cdot O \cdot \Gamma \cdot Z \cdot \exp \left( { - {{\Delta G_{\rm{C}} } \over {k_{\rm{B}} T}}} \right)\quad,$$
where  $N_0 = (x_{\rm{A}} \Omega _{\rm{A}} + x_{\rm{B}} \Omega _{\rm{B}} + x_{\rm{C}} \Omega _{\rm{C}} )^{ - 1}$ is the number density of atoms in the liquid. ΩA, ΩB, and ΩC are the atomic volumes of component A, B, and C, respectively. x A, x B, and x C are the mole fractions of component A, B, and C, respectively.
 $O = 4n_{\rm{c}}^{2/3}$ reflects the surface area of the nuclei with n c being the number of atoms in a droplet of critical radius R C = 2σ/∆G V. σ is the interfacial tension between the two liquids. Γ = 6D/λ2 is the attachment rate of atoms to the droplet with D being the diffusion coefficient and λ the average diffusional jump distance of the atoms.
 $Z = [\Delta G_{\rm{C}} /(3{\rm{\pi }}k_B Tn_{\rm{c}}^2 )]^{1/2}$ is the Zeldovich factor with k B being Boltzmann’s constant and T the absolute temperature, respectively.
 $\Delta G_{\rm{C}} = 16{\rm{\pi \sigma }}^3 /(3\Delta G_V^2 )$ is the energy barrier for nucleation.
 $\Delta G_V = \Delta G \cdot V_{{\rm{mol}}}^{ - 1}$ is the gain of the volume free energy on nucleation with V mol being the molar volume of the Fe–Co-rich liquid. ΔG is the molar Gibbs free energy change due to the liquid–liquid phase transformation.
The Fe–Co-rich droplets embedded in a supersaturated matrix grow by diffusional transport of solute in the matrix. Assuming that the composition of the liquid inside a droplet is homogeneous and always follows the phase diagram, the growth rate is given by Eq. (2) if the dimensionless supersaturation  $(C_{\rm{m}}^i - C_{{\rm{me}}}^i )/(C_{\rm{\beta }}^i - C_{{\rm{me}}}^i )$ is much less than unity.Reference Zhao, Ratke and Feuerbacher16,Reference Marqusee and Ross17
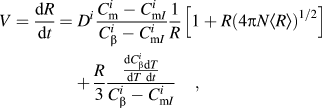 $$\eqalignb{V = \,{{{\rm{d}}R} \over {{\rm{d}}t}} = D^i {{C_{\rm{m}}^i - C_{{\rm{m}}I}^i } \over {C_{\rm{\beta }}^i - C_{{\rm{m}}I}^i }}{1 \over R}\left[ {1 + R\left( {4{\rm{\pi }}N\left\langle R \right\rangle } \right)^{1/2} } \right] \cr\,\,\,\,\,\,\,\,\,\,\,\,\,\,\,+ {R \over 3}{{{\textstyle{{{\rm{d}}C_\beta ^i } \over {{\rm{d}}T}}}{\textstyle{{{\rm{d}}T} \over {{\rm{d}}t}}}} \over {C_{\rm{\beta }}^i - C_{{\rm{m}}I}^i }}\quad,$$
where R, <R>, and N are the radius, average radius, and number density of the Fe–Co-rich droplets, respectively.  $C_{\rm{m}}^i$ is the mean field concentration of solute i in the matrix liquid.
 $C_{\rm{\beta }}^i$ is the concentration of solute i in the Fe–Co-rich droplets.
 $C_{{\rm{m}}I}^i = C_{{\rm{me}}}^i \exp ({\rm{\alpha }}_{\rm{S}} /R)$ is the concentration of solute i in the matrix at the interphase boundary.
 ${\rm{\alpha }}_{\rm{S}} = 2{\rm{\sigma }}\Omega ^{\rm{\beta }} /k_{\rm{B}} T$ is the capillary length with Ωβ being the atomic volume of the Fe–Co-rich droplets and
 $C_{{\rm{me}}}^i$ the equilibrium composition of solute i at a flat interface boundary.
To describe the microstructure evolution in an atomized drop during the liquid–liquid phase transformation, a radius distribution function of the Fe–Co-rich droplets f(R, r, t) is defined. f(R, r, t)dR gives the number of the Fe–Co-rich droplets per unit volume at the position r measured from the center of the atomized drop and at time t in a size class from R to R + dR. Taking into account the concurrent actions of the nucleation, diffusional growth, spatial motion of the Fe–Co-rich droplets due to the Marangoni migration, f(R, r, t) obeys the following continuity equation:
 $${{\partial f} \over {\partial t}} + {\partial \over {\partial R}}(Vf) - {1 \over {r^2 }}{{\partial (u_{\rm{m}} r^2 f)} \over {\partial r}} = {\rm{\delta }}_{\rm{I}}\quad ,$$
 $$u_{\rm{m}} = - {{2R} \over {[(2{\rm{\lambda }}_{\rm{m}} + {\rm{\lambda }}_{\rm{\beta }} )/{\rm{\lambda }}_{\rm{m}} ](2{\rm{\eta }}_{\rm{m}} + 3{\rm{\eta }}_{\rm{\beta }} )}}{{\partial {\rm{\sigma }}} \over {\partial T}}\nabla T\quad,$$
where u m is the Marangoni migration velocity of the Fe–Co-rich droplets. λm and λβ are the thermal conductivities of the matrix liquid and the Fe–Co-rich droplets, respectively. ηm and ηβ are the dynamic viscosities of the matrix liquid and the Fe–Co-rich droplets, respectively. δI is a function related to the nucleation rate of the Fe–Co-rich droplets. δI (R ≠ R C) = 0; δI (R = R C) = f I. f I is the increasing rate of f(R C, r, t) due to the nucleation of the Fe–Co-rich droplets. When solving Eq. (3) numerically, f I is given by f I = I/∆R with ∆R being the step for R. In Eq. (3), the first term describes the time dependence of the distribution function. The second term describes the contribution of the diffusional growth of the Fe–Co-rich droplets to the change of the size distribution function. The third term describes the effect of u m on the local size distribution function. The last term is the source term due to nucleation. Considering that the collision and coagulation between the Fe–Co-rich droplets show a weak effect on the microstructure formation in an atomized drop,Reference Zhao18 their effects are neglected in Eq. (3).
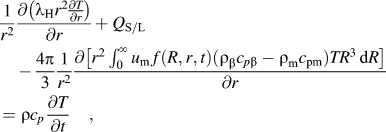
The temperature field of the atomized drop can be calculated by Eq. (5) using Eq. (6) as the boundary condition.
 $$\eqalignb{{1 \over {r^2 }}{{\partial \left( {{\rm{\lambda }}_{\rm{H}} r^2 {\textstyle{{\partial T} \over {\partial r}}}} \right)} \over {\partial r}} + Q_{{\rm{S/L}}} \cr\quad- {{4{\rm{\pi }}} \over 3}{1 \over {r^2 }}{{\partial \left[ {r^2 \int_0^\infty {u_{\rm{m}} \,f(R,r,t)({\rm{\rho }}_{\rm{\beta }} c_{p{\rm{\beta }}} - {\rm{\rho }}_{\rm{m}} c_{{\rm{pm}}} )TR^3 \,{\rm{d}}R} } \right]} \over {\partial r}} \cr= {\rm{\rho }}c_p {{\partial T} \over {\partial t}}\quad,$$
 $$q_{\rm{d}} = {\rm{\pi }}d^2 h(T_{{\rm{ds}}} - T_{\rm{g}} )\quad,$$
where  $Q_{{\rm{S/L}}} = {\rm{\rho }}L_{\rm{S}} V_{{\rm{S/L}}}$ is the latent heat released at the solidification interface per second, L S is the latent heat of solidification, V S/L is the moving velocity of the S/L interface. c p, ρ, and λH are, respectively, the specific heat, density, and thermal conductivity of the alloy. ρm and c pm are, respectively, the density and specific heat of the matrix liquid. ρβ and c pβ are, respectively, the density and specific heat of the Fe–Co-rich droplets. q d is the heat transfer rate on the surface of the atomized drop.Reference Ranz and Marshall19T ds is the surface temperature of the atomized drop. T g is the temperature of the atomization gas.Reference Grant, Cantor and Katgerman20h is the convective heat-transfer coefficient.Reference Ranz and Marshall19 In Eq. (5), the first term describes the heat transfer due to conduction, the second term describes the effect of the release of the latent heat due to the solidification, the third term describes the heat transfer due to the motion of the Fe–Co-rich droplets, and the last term describes the time dependence of the temperature. Considering that the heat of liquid–liquid phase decomposition is very small in comparison with the solidification latent heat, it is neglected in the calculations.
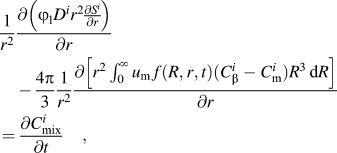
The solute transfers by both the diffusion of solute in the matrix and the motion of the Fe–Co-rich droplets during cooling an atomized drop. According to the conservation relation of solute, the concentration field of solute i obeys
 $$\eqalignb{{1 \over {r^2 }}{{\partial \left( {\varphi _{\rm{l}} D^i r^2 {\textstyle{{\partial S^i } \over {\partial r}}}} \right)} \over {\partial r}} \cr\quad- {{4{\rm{\pi }}} \over 3}{1 \over {r^2 }}{{\partial \left[ {r^2 \int_0^\infty {u_{\rm{m}} \,f(R,r,t)(C_{\rm{\beta }}^i - C_{\rm{m}}^i )R^3 \,{\rm{d}}R} } \right]} \over {\partial r}} \cr= {{\partial C_{{\rm{mix}}}^i } \over {\partial t}}\quad,$$
where  $C_{{\rm{mix}}}^i$ is the content of solute i in the local mixture of liquids.
 $S^i = C_{\rm{m}}^i - C_{{\rm{me}}}^i$ is the supersaturation of the matrix liquid.Reference Zhao18ϕ l is the volume fraction of the matrix liquid. In Eq. (7), the first and second terms describe the change of solute in the matrix liquid due to the diffusional transfer and the motion of the Fe–Co-rich droplets, respectively. The last term describes the time dependence of the concentration.
Coupling the temperature field and the concentration field given by Eqs. (5) and (7) with the phase diagram of Cu–Co–Fe alloy, the size distribution function of the Fe–Co-rich droplets in the atomized drop is determined via a solution to Eq. (3).
C. Numerical methods
The equations given in the above section are solved numerically by using the finite-volume method. Both the radial axes of the atomized drop and the Fe–Co-rich droplets are divided into a number of intervals, which constitute the finite volumes. The partial differential equations for the temperature field [Eq. (5)] and for the concentration field [Eq. (7)] are, respectively, discredited as the implicit difference equations using the assumption that the temperature and the concentration vary in a stepwise manner in the direction of the atomized drop radial axis (m mesh points). The discretization yields m ordinary differential equations with one equation for each of the m finite volumes for Eq. (5) and also for Eq. (7). Eq. (3) is discredited as an implicit difference equation using the assumption that the radial distribution function varies in a stepwise manner both in the direction of the radial axis of the Fe–Co-rich droplets (n mesh points) and in the direction of the radial axes of the atomized drop. The discretization of the continuous equation yields m × n ordinary differential equations with one equation for each of the m × n finite volumes. These equations were solved by using the line-by-line algorithm, which is a combination of the algorithm of Gauss–Seidel and that of Thomas.Reference Patankar21
The thermodynamic driving force for the liquid–liquid phase transformation and the phase diagram of Cu–Co–Fe alloy were calculated directly from the Gibbs free energy function. The molar Gibbs free energy of mixing of the liquid phase is given byReference Turchanin, Dreval, Abdulov and Agraval7
 $$G_{\rm{m}} = \mathop\sum\limits_{i = {\rm{Cu,Co,Fe}}} {{}^0G_i } x_i + R_g T \mathop\sum\limits_{i = {\rm{Cu,Co,Fe}}} {x_i } \ln x_i + {}^{\rm{E}}G_{\rm{m}} \quad,$$
 $$\eqalignb{{}^{\rm{E}}G_{\rm{m}} = x_{{\rm{Cu}}} x_{{\rm{Co}}} L_{{\rm{Cu,Co}}} + x_{{\rm{Cu}}} x_{{\rm{Fe}}} L_{{\rm{Cu,Fe}}} + x_{{\rm{Co}}} x_{{\rm{Fe}}} L_{{\rm{Co,Fe}}} \cr\,\,\,\,\,\,\,\,\,\,\,\,\,\,\,\,\,+ x_{{\rm{Cu}}} x_{{\rm{Co}}} x_{{\rm{Fe}}} L_{{\rm{Cu,Co,Fe}}}\quad ,$$
 $$L_{i,j} = \mathop\sum\limits_{v = 0}^n {(x_i - x_j )^v } \cdot {}^vL_{i,j}\quad ,$$
 $$L_{i,j,k} = x_i \cdot {}^0L_{i,j,k} + x_j \cdot {}^1L_{i,j,k} + x_k \cdot {}^2L_{i,j,k}\quad ,$$
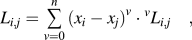
where  ${}^0G_i$ and x i are the Gibbs free energy and the mole fraction of pure component i (i = Cu, Co, Fe), respectively. The Gibbs free energies of the pure components are taken from the Scientific Group Thermodata Europe database compiled by Dinsdale.Reference Dinsdale22R g is the gas constant.
 ${}^{\rm{E}}G_{\rm{m}}$ is the excess Gibbs free energy. L i,j and L i,j,k are, respectively, the binary and ternary interaction parameters between component i, j, and k. They are functions of temperature and alloy composition as given in Table I.
Interaction parameters of the Cu–Co–Fe ternary system.

No experimental result on the interfacial energy between the Fe–Co-rich droplet and the matrix liquid can be found. We estimate σ as follows: generally, the interfacial energy between the two liquid phases coexisting during cooling an immiscible alloy in the miscibility gap satisfiesReference Kaptay26
 $${\rm{\sigma }} = {\rm{\sigma }}_{\rm{0}} \cdot (1 - T/T_{\rm{C}} )^{\rm{\delta }}\quad ,$$
where T C is the critical temperature of the immiscible system. σ0 and δ are constants. Theoretically, δ takes a value 1.26 from the renormalization theory.Reference Moldover27 Calculations demonstrate that for the alloy of the composition Cu-10 wt% Co-10 wt% Fe, the critical temperature is about 1620 ± 10 K. The only parameter unknown is then σ0. The numerical simulations demonstrate that the calculated average radius of the Fe–Co-rich particles has a favorable agreement with the experimental results when σ0 equals 1.78 J/m2. σ0 is thus taken as 1.78 J/m2.
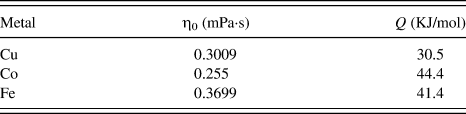
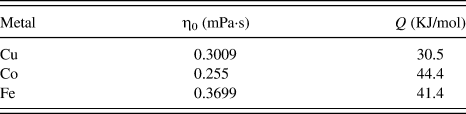
The variation of the dynamic viscosity for liquid pure Cu, Co, Fe is calculated by Eq. (13). The dynamic viscosity for the Cu-rich matrix liquid is taken as the dynamic viscosity of pure Cu. The dynamic viscosity for the Fe–Co-rich droplets is taken as the mean dynamic viscosities of pure Fe and Co.
 $${\rm{\eta }} = {\rm{\eta }}_0 \exp (Q/R_{\rm{g}} T)\quad,$$
where η0 is constant. Q is the activation energy for viscous flow. They are given in Table II.Reference Brandes and Brook28
Viscosity parameters of liquid pure metal.
The self-diffusion coefficient of Cu is calculated by using the Stokes–Einstein relationReference Pommrich, Meyer, Holland-Moritz and Unruh29:
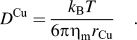 $$D^{{\rm{Cu}}} = {{k_{\rm{B}} T} \over {6{\rm{\pi \eta }}_{\rm{m}} r_{\rm{Cu}} }}\quad.$$
The diffusivity of solute i in the liquid Cu is calculated byReference Roy and Chhabra30
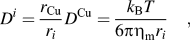 $$D^i = {{r_{{\rm{Cu}}} } \over {r_i }}D^{{\rm{Cu}}} = {{k_{\rm{B}} T} \over {6{\rm{\pi \eta }}_{\rm{m}} r_i }}\quad,$$
where r i is the ionic radius of element i. r Cu = 0.57 Å, r Fe = 0.55 Å, and r Co = 0.53 Å.
D. Calculated results and discussions
The model was applied to calculate the microstructure formation in the gas atomized drops according to the practical experimental situations. The calculated 2D average radius of the Fe–Co-rich particles is shown in Fig. 4. It indicates that the 2D average radius of the Fe–Co-rich particles increases with the powder diameter according to <R 2D> ∝ d 0.701. The favorable agreement between the experimental and the calculated results for the powders of different sizes indicates that the model describes the microstructure evolution process well.
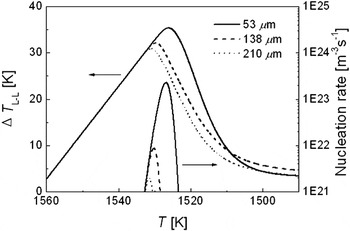
Figure 6 shows the nucleation rate of the Fe–Co-rich droplets and the undercooling (∆T L–L = T Binodal − T, as shown in Fig. 5) for the liquid–liquid phase transformation as a function of temperature. When an initially homogeneous liquid is cooled into the metastable miscibility gap, it tends to decompose into two liquids. ∆T L–L increases with the decrease of temperature and the liquid–liquid phase transformation begins when the undercooling of the matrix liquid reaches a critical value. Henceforth, the variation of the undercooling is a result of the concurrent actions of the drop of the melt temperature and the liquid–liquid phase transformation. The continuous cooling causes an increase in the undercooling while the nucleation and diffusional growth of the Fe–Co-rich droplets causes a decrease in the undercooling. In the early stage of the liquid–liquid phase transformation, both the nucleation rate and the number density of the Fe–Co-rich droplets are very low. The drop of the melt temperature dominates the variation of the undercooling. ∆T L–L does not decrease but increases with the fall of temperature. The increase of the undercooling leads to a rapid rising in the nucleation rate and the number density of the Fe–Co-rich droplets. As a result, the rate at which the nucleation and growth of the Fe–Co-rich droplets consume Fe and Co increases, the composition of the matrix liquid begins to approach the equilibrium composition and the undercooling decreases quickly. Soon the nucleation ceases. A smaller atomized drop achieves a higher undercooling and, thus, an enhanced nucleation rate of the Fe–Co-rich droplets and a wider temperature range for continuous nucleation.
Nucleation rate of the Fe–Co-rich droplets and undercooling of the matrix liquid during a cooling of the atomized drops of different diameters.

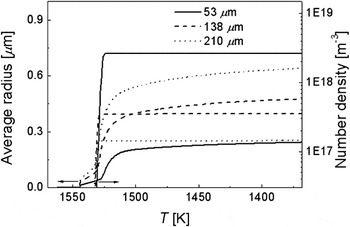
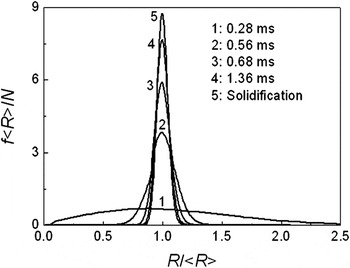
The average radius and number density of the Fe–Co-rich droplets are shown in Fig. 7. The average radius of the Fe–Co-rich droplets changes slowly during the nucleation period because small Fe–Co-rich droplets are created continuously. After nucleation, the average radius of the Fe–Co-rich droplets increases rapidly because of the higher supersaturation of the matrix liquid. The growth of the droplets leads to a quick drop of the supersaturation and, thus, the growth rate of the droplets slows down gradually. The number density of the Fe–Co-rich droplets remains almost constant after nucleation, indicating that the effect of the spatial phase separation due to the Marangoni migration of the minority phase droplets is very weak, and also the Ostwald coarsening of the minority phase droplets is negligible under the rapid cooling conditions of gas atomization. Figure 8 shows the normalized radius distribution of the Fe–Co-rich droplets at different time during cooling a Cu–Co–Fe alloy in the miscibility gap for an atomized drop of 138 µm in diameter. It indicates that the sizes of the Fe–Co-rich droplets show a wider distribution during the nucleation period because the small nuclei are created continuously. The size distribution of the Fe–Co-rich droplets becomes narrower and develops into a symmetric shape quickly after the nucleation period since the growth rate increases with the decrease of the droplet size.
Average radius and number density of the Fe–Co-rich droplets in the atomized drops of different diameters versus temperature.

Normalized distribution of the Fe–Co-rich droplets radii at the early (curve 1) and late stage (curve 2) of the nucleation and after the nucleation (curve 3–5) in an atomized drop of 138 µm in diameter.

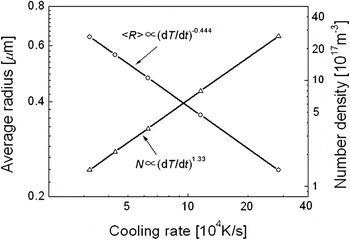
Calculations are carried out for the atomized drops of different diameters. It indicates that the average radius of the Fe–Co-rich particles decreases, whereas the number density of the Fe–Co-rich particles increases with the cooling rate of the atomized drop during the nucleation period of the Fe–Co-rich droplets ( $\dot T_{\rm{Nuc} }$) as shown in Fig. 9. The average radius and number density of the Fe–Co-rich particles can, respectively, be related to
 $\dot T_{\rm{Nuc} }$ by
 $\left\langle R \right\rangle \,\propto \,\dot T_{{\rm{Nuc}}}^{ - 0.444}$ and
 $N \,\propto \,\dot T_{\rm{Nuc}}^{1.33}$.
Average radius and number density of the Fe–Co-rich particles as a function of the cooling rate of the atomized drop during the nucleation period of the Fe–Co-rich droplets.

IV. CONCLUSIONS
Ternary Cu-10 wt% Co-10 wt% Fe alloy was rapidly solidified by using the high-pressure gas atomization technique. The microstructure formation in a ternary Cu–Co–Fe alloy was analyzed. A model describing the microstructure evolution during the liquid–liquid phase transformation was developed. The microstructure formation in the gas atomized drops of Cu–Co–Fe alloy was simulated by coupling the thermodynamic and kinetic calculations. The numerical results showed a favorable agreement with the experimental results. The following conclusions are derived:
(1) The Cu-10 wt% Co-10 wt% Fe powders of the diameter <220 µm show a well-dispersed microstructure. The average radius of the Fe–Co-rich particles increases with the powder diameter.
(2) For Cu–Co–Fe alloy, under the rapid cooling conditions of gas atomization, the spatial phase separation due to the Marangoni migration of the minority phase droplets is very weak. Also the effect of Ostwald coarsening of the minority phase droplets on the microstructure evolution is negligible.
(3) For Cu-10 wt% Co-10 wt% Fe alloy, the average radius (<R>) and number density (N) of the Fe–Co-rich particles depend exponentially on the cooling rate of the melt during the nucleation period of the Fe–Co-rich droplets (
 $\dot T_{\rm{Nuc}}^{}$) according to $\left\langle R \right\rangle\, \propto\, \dot T_{{\rm{Nuc}}}^{ - 0.444}$ and $N \,\propto\, \dot T_{\rm{Nuc}}^{1.33}$.


ACKNOWLEDGMENTS
This work is financially supported by the National Natural Science Foundation of China (Grant Nos. 51031003, 51071159, and 51271185).