1. Introduction
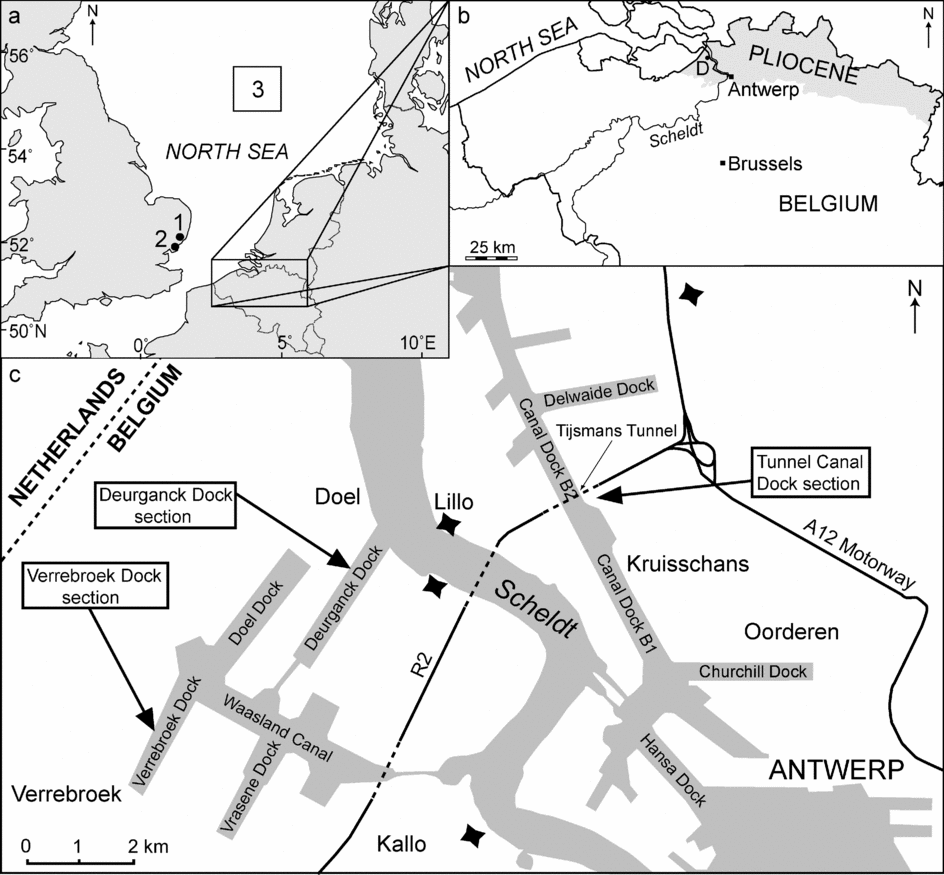
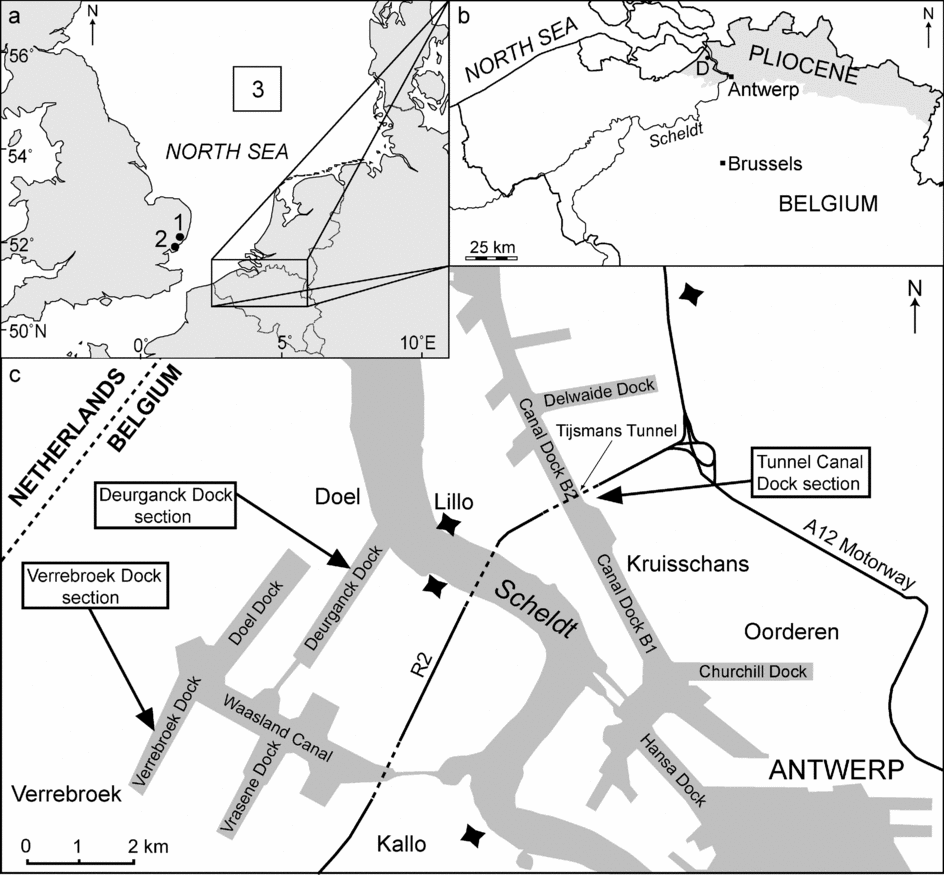
The distribution of marine Pliocene deposits in Belgium is restricted to the north (Fig. 1), where the construction of docks in Antwerp Harbour periodically exposes sections. Excavations for the Tunnel-Canal Dock in the late 1960s and early 1970s provided an opportunity to establish a modern understanding of the Pliocene lithostratigraphy (P. Laga, unpub. Ph.D. thesis, Univ. Leuven, 1972; De Meuter & Laga, Reference De Meuter and Laga1976). This built upon earlier studies dating back to the 1950s (de Heinzelin, Reference de Heinzelin1950a, Reference de Heinzelinb, Reference de Heinzelin1952, Reference de Heinzelin1955a, Reference de Heinzelinb, Reference de Heinzelinc) and indeed the 19th century (e.g. Dumont, Reference Dumont1839), as reviewed recently by Laga, Louwye & Geets (Reference Laga, Louwye and Geets2002). The Tunnel-Canal Dock section was accessible only during the construction of the Tijsmans Tunnel, which is situated on the right bank of the river Scheldt in Antwerp Harbour, close to the Belgian–Dutch border (Fig. 1). The tunnel was nameless at construction, and the section is hence known as the Tunnel-Canal Dock (hereafter TK Dock) section, from the Flemish Tunnel-Kanaal Dok. The section was extensively studied for sedimentology and palaeontology by P. Laga (unpub. Ph.D. thesis, Univ. Leuven, 1972) and De Meuter & Laga (Reference De Meuter and Laga1976).
(a) Location of the study area in northern Belgium close to the southern North Sea, including the location of (1) the Coralline Crag at Rockhall Wood (Head, Reference Head1997, Reference Head1998a), (2) the Walton Crag at Walton-on-the-Naze (Head, Reference Head1998a, Reference Headb) and (3) the study area of Kuhlmann et al. (Reference Kuhlmann, Langereis, Munsterman, van Leeuwen, Verreussel, Meulenkamp and Wong2006a, Reference Kuhlmann, Langereis, Munsterman, van Leeuwen, Verreussel, Meulenkamp and Wongb). (b) Distribution of marine Pliocene deposits (shaded in grey) in Belgium and the location of the village of Doel (D), close to the Deurganck Dock. (c) Location of the Tunnel-Canal Dock, Deurganck Dock and Verrebroek Dock sections in Antwerp Harbour. Black stars show 19th century fortifications.
During Pliocene times the North Sea was a shallow shelf sea with estimated water depths between 60 and 100 m (Overeem et al. Reference Overeem, Weltje, Bishop-Kay and Kroonenberg2001), and a connection to the Atlantic Ocean via the north (Ziegler, Reference Ziegler1990). However, unlike the present day, the Rhine Valley Rift system was still active and responsible for considerable subsidence, while in the east, a large river system supplied the basin with fresh water and sediment (Overeem et al. Reference Overeem, Weltje, Bishop-Kay and Kroonenberg2001). The Wealden–Artois axis largely obstructed a southerly connection with the North Atlantic (Ziegler, Reference Ziegler1990; Balson, Reference Balson, Daley and Balson1999), and a connection with the Atlantic via the Channel may not have existed until the Pleistocene (Gibbard, Reference Gibbard and Preece1995). None the less, it has been suggested that Pliocene–Pleistocene connections to the North Atlantic via the south existed when sea level was high (Funnell, Reference Funnell and Preece1995, Reference Funnell1996; Van Vliet-Lanoë et al. Reference Van Vliet-Lanoë, Vandenberghe, Laurent, Laignel, Lauriat-Rage, Louwye, Mansy, Mercier, Halegouët, Laga, Laquement, Meilliez, Michel, Moguedet and Vidier2002).
Neogene sediments in the southern North Sea Basin were deposited entirely on the shelf (e.g. Louwye, Head & De Schepper, Reference Louwye, Head and De Schepper2004; Louwye, Reference Louwye2005; Louwye et al. Reference Louwye, De Schepper, Laga and Vandenberghe2007). Sedimentation rates outpaced subsidence, resulting in a progressive infill and basin shoaling during Miocene and Pliocene times. By the end of the Pliocene, shallow waters were established over most of the basin (Ziegler, Reference Ziegler1990). The units, often bounded by unconformities, dip towards the north (basinwards) as a consequence of the subsiding North Sea Basin. Basal gravels sometimes mark the bases of units, and the depositional environment along the southern margin of the North Sea Basin is usually interpreted as being shallow- to peri-marine (Laga, Louwye & Geets, Reference Laga, Louwye and Geets2002; Louwye, Head & De Schepper, Reference Louwye, Head and De Schepper2004).
Louwye, Head & De Schepper (Reference Louwye, Head and De Schepper2004, fig. 3) provided detailed lithological descriptions and palynological records of the Verrebroek and Deurganck docks (hereafter VB Dock and DG Dock, Fig. 1), and reviewed the biostratigraphy and palaeoenvironments of the Belgian Pliocene. The present study describes the dinoflagellate cyst record of the Tunnel-Canal Dock (hereafter TK Dock) section, which represents the most complete exposure of marine Pliocene deposits in Belgium, and deals with two Pliocene formations: the Kattendijk Formation and Lillo Formation. The TK Dock section represents the type section of the Lillo Formation, which is subdivided (from oldest to youngest) into the Luchtbal Sands, Oorderen Sands, Kruisschans Sands and Merksem Sands members (hereafter referred to as the Luchtbal, Oorderen, Kruisschans and Merksem sands). This is the first study to report on dinoflagellate cysts from the Luchtbal Sands, as this unit appears to be missing from the VB and DG docks (Louwye, Head & De Schepper, Reference Louwye, Head and De Schepper2004).
2. Methods and materials
2.a. Sample collection
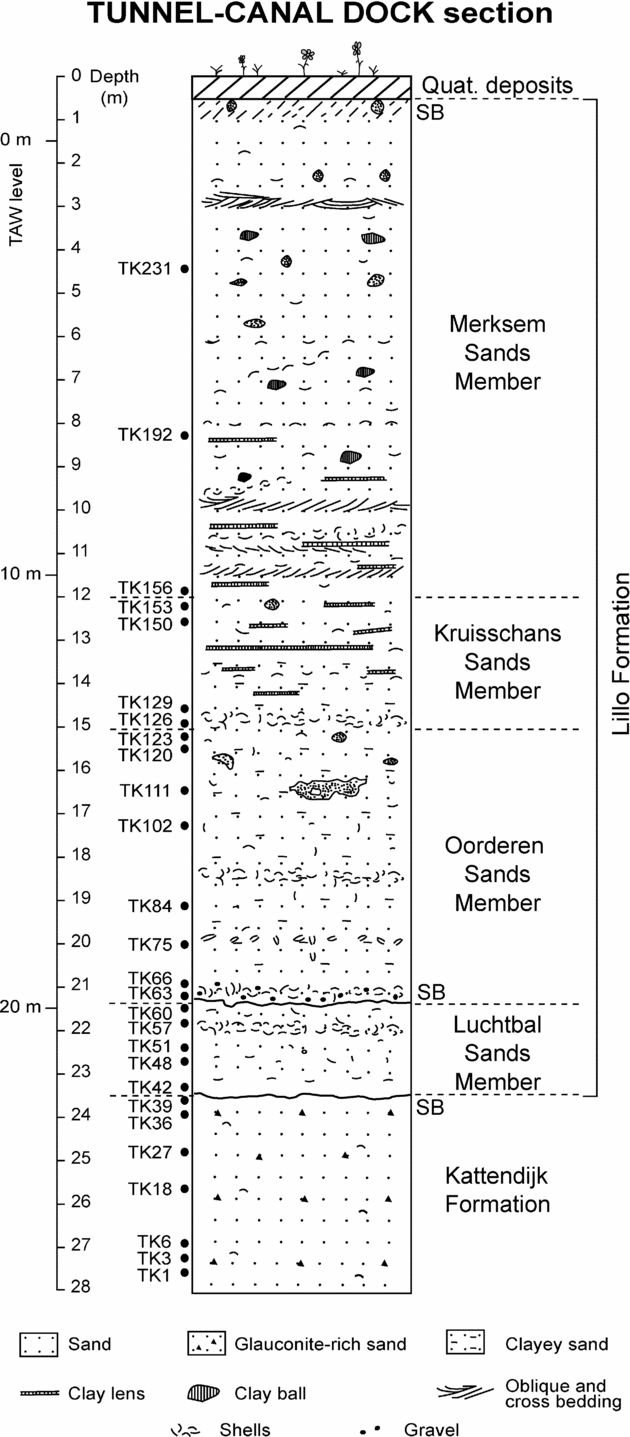
Samples are stored in the collections of the Historical Geology Group of the Katholieke Universiteit Leuven (Belgium). The temporary section in the Antwerp Harbour (Fig. 2) exposed 27 m of Quaternary and Pliocene deposits and was sampled at the end of the 1960s and early 1970s by P. Laga. The Pliocene sediments are typically glauconitic sands, with varying clay content and usually abundant shells that tend to be concentrated in distinct layers. Twenty-seven samples were selected for analysis (Fig. 2; online Appendix 1 at http://journals.cambridge.org/geo).
Lithological column of the Tunnel-Canal Dock section (from P. Laga, unpub. Ph.D. thesis, Univ. Leuven, 1972) and the position of samples (TK1–TK231) studied for dinoflagellate cysts. Although sample TK60 appears to belong to the Luchtbal Sands, it was taken from a load cast of the overlying Oorderen Sands, to which it is genetically related. Depths are given for the section and as related to TAW (Tweede Algemene Waterpassing = Second General Levelling), where a TAW height of zero metres corresponds to the average sea level during low tide at Ostend, Belgium. SB = sequence boundary.

2.b. Dinoflagellate cyst preparation
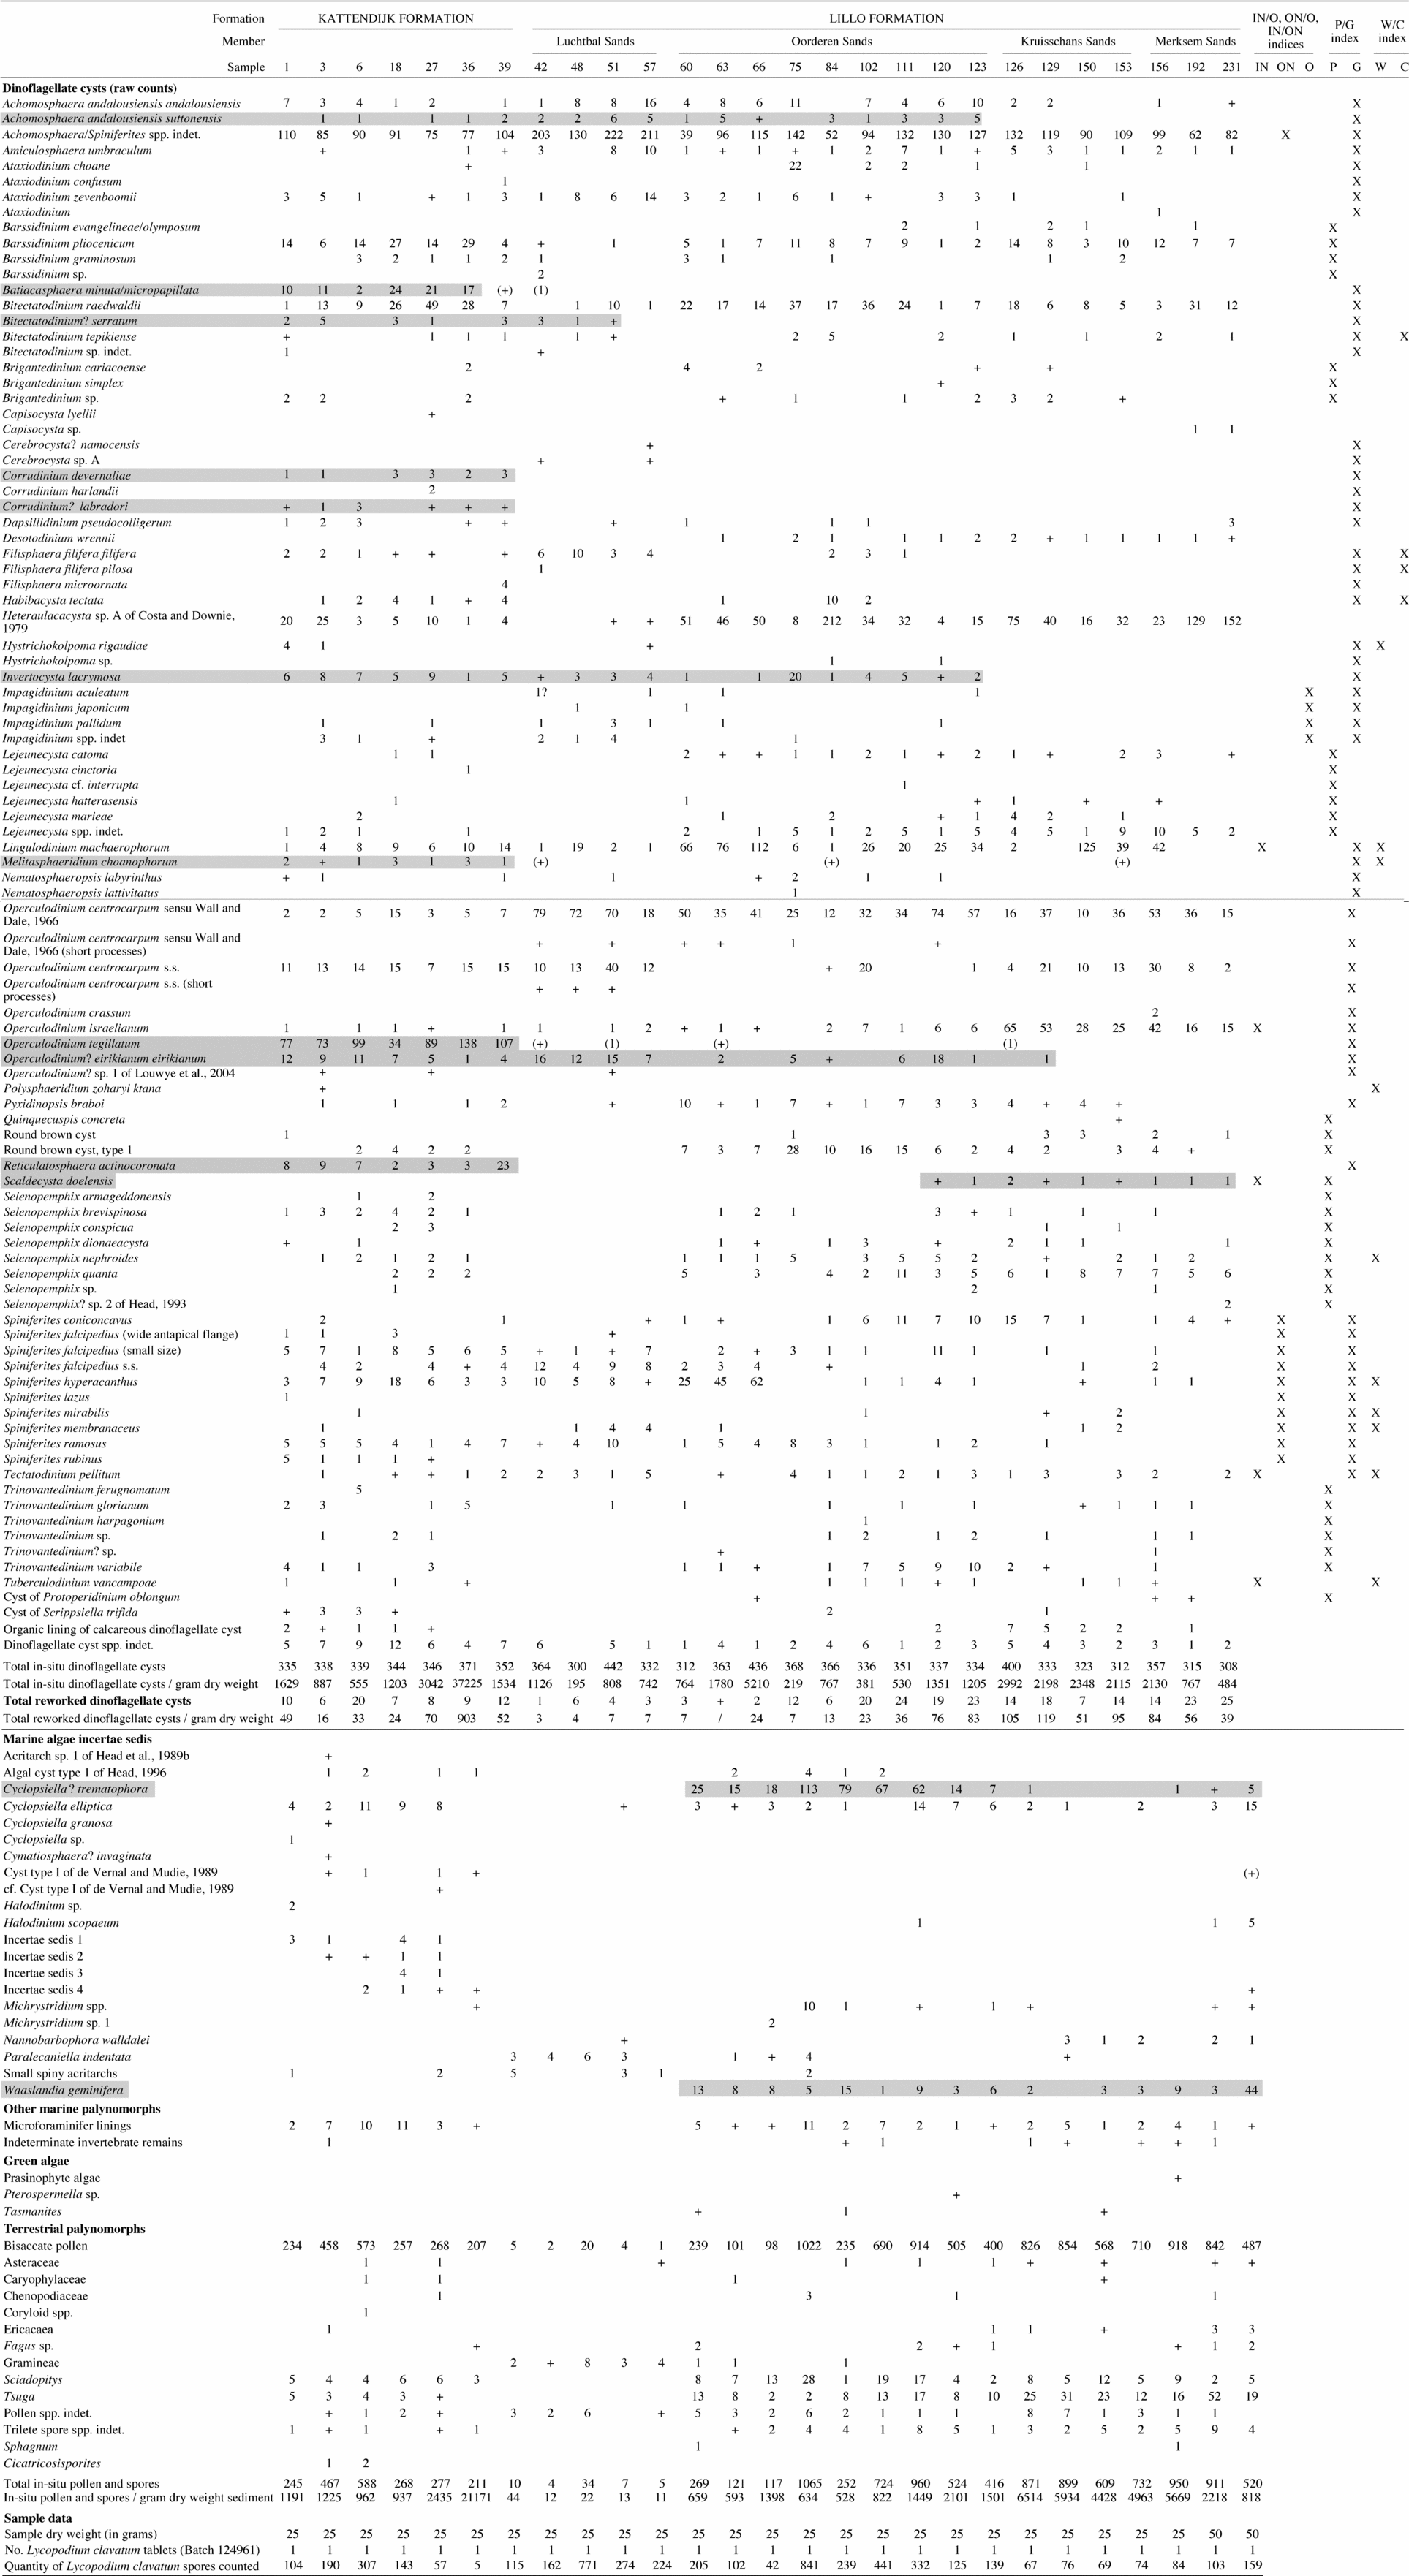
Each sample was oven-dried at 60°C, weighed, and one Lycopodium clavatum spore tablet (batch 124961, n=12542, σ=931) was added to estimate cyst concentrations (Stockmarr, Reference Stockmarr1971). The processing of each sample (about 25–30 g) followed standard palynological maceration techniques (details in S. De Schepper, unpub. Ph.D. thesis, Univ. Cambridge, 2006), including demineralization with HCl (7% conc.), HF (48% conc.), and again HCl (7% conc.) to remove any precipitated fluorosilicates. Only cold reagents were used. Samples were rinsed until neutral before sieving on a 20 μm nylon mesh, and the residues were mounted on microscope slides with glycerine jelly. The abundance of fine organic material in the samples made sieving at 10 μm prohibitively time consuming. Sieving at 20 μm was effective at concentrating the dinoflagellate cysts, but it may have caused losses among the small acritarchs and pollen (see Lignum, Jarvis & Pearce, Reference Lignum, Jarvis and Pearce2008). Some Lycopodium clavatum spores may also have been lost, which would lead to a slight overestimation of dinoflagellate cyst concentrations. Palynomorphs were counted until about 350 dinoflagellate cysts per sample were registered. The remainder of the microscope slide was then scanned for rare specimens (Fig. 3).
Raw data of in-situ and reworked dinoflagellate cysts, marine and terrestrial palynomorphs, incertae sedis and green algae from the TK Dock section. In grey shading, the ranges of stratigraphically important species; also included is a list of the dinoflagellate cyst species used for various environmental indices. + indicates specimens recorded outside of the regular counts; numbers in brackets indicate occurrences that are considered reworked. For explanation of abbreviations, see text.

The ratio of dinoflagellate cysts to Lycopodium clavatum spores was mostly between 1 and 6, resulting in a total error below 15% (online Appendix 2). Samples TK36 and TK66 are exceptions: because of the low Lycopodium clavatum count, ratios of 10.4 and 74.2, respectively, were calculated, accounting for respective total errors of 18% and almost 46% on the estimated concentration.
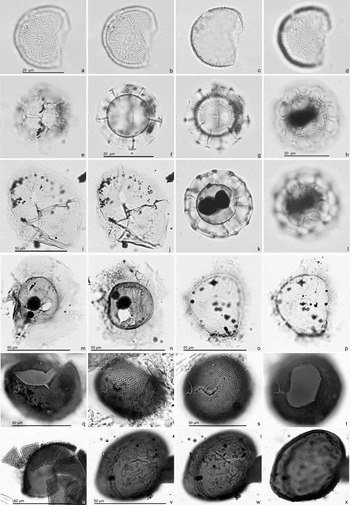
The marine palynomorph nomenclature follows Fensome & Williams (Reference Fensome and Williams2004) and De Schepper, Head & Louwye (Reference De Schepper, Head and Louwye2004). All ages correspond to the Astronomically Tuned Neogene Time Scale 2004 (Lourens et al. Reference Lourens, Hilgen, Shackleton, Laskar, Wilson, Gradstein, Ogg and Smith2005). Most of the important marine palynomorphs are illustrated in Louwye, Head & De Schepper (Reference Louwye, Head and De Schepper2004) and De Schepper, Head & Louwye (Reference De Schepper, Head and Louwye2004). Selected taxa in open nomenclature are shown in Figure 4. For the description of bioevents, a distinction is made between lowest/highest occurrence (LO/HO), which refers to the stratigraphic position in the section, and first/last appearance (FA/LA), which refers to the record in time (Salvador, Reference Salvador1994).
All pictures are taken in bright field illumination. The lithological unit, sample, slide number and England Finder reference are given sequentially for each specimen. (a–d) Cerebrocysta sp. A. Luchtbal Sands Member, sample TK57, slide TK57(1), O25/1. Lateral view of (a, b) high and slightly lower foci, (c) mid- and (d) lower focus. (e–g) Algal cyst type 1 of Head (Reference Head1996). Kattendijk Formation, sample TK36, slide TK36(B1), W29/1. Uncertain view of (e) high, (f) mid- and (g) lower focus. (h, k, l) Cyst type I of de Vernal & Mudie (Reference de Vernal, Mudie, Srivastava, Arthur and Clement1989). Kattendijk Formation, sample TK27, slide TK27(1), B39/1. Uncertain view of (h) high, (k) mid- and (l) lower focus. (i, j) Incertae sedis 1. Kattendijk Formation, sample TK27, slide TK27(1), K44/2. Uncertain view at high and slightly lower focus. (m, n) Incertae sedis 2. (m) Kattendijk Formation, sample TK3, slide TK3(2), X27/0. Uncertain view. (n) Kattendijk Formation, sample TK6, slide TK6(2), R21/3. Uncertain view. (o, p) Incertae sedis 3. Kattendijk Formation, sample TK18, slide TK18(3), C38/0. Uncertain view of (15) high and (16) low focus. (q–u) Incertae sedis 4. Dark brown spherical palynomorph, bearing densely distributed short processes and a large archeopyle(?) with accessory sutures. (q, r) Kattendijk Formation, sample TK36, slide TK36(B1), Q27/0. Uncertain view at (q) low focus on possible archeopyle, and (r) high focus. (s, t) Kattendijk Formation, sample TK36, slide TK36(B1), Y29/0. Uncertain view at (s) high and (t) low focus on possible archeopyle. (u) Kattendijk Formation, sample TK6, slide TK6(2), N22/0. Uncertain view of dissociated ‘plates’. (v–x) Round brown cyst type 1. (Sub)spherical palynomorph with a smooth to finely granulate brown wall, bearing short and/or long, hollow processes. Oorderen Sands Member, sample TK123, T39/2. Uncertain view of (v, w) high and slightly lower foci, and (x) mid-focus. See http://journals.cambridge.org/geo for a colour version of this figure.

2.c. Palaeoecological methods and indices
Concentration and richness (= number of species counted in one slide) were calculated along with the Shannon–Wiener diversity index (H') and evenness (EH). The P/G=nP/(nP + nG) index (n=number of specimens counted) is the ratio between protoperidinioids (P) and gonyaulacoids (G). It is used as a measure for productivity, but information on preservation may also be contained in this index. Protoperidinioid dinoflagellate cysts are known to be susceptible to oxidation (e.g. De Schepper, Head & Louwye, Reference De Schepper, Head and Louwye2004; Zonneveld, Versteegh & de Lange, Reference Zonneveld, Versteegh and de Lange1997, Reference Zonneveld, Versteegh and de Lange2001; Zonneveld, Bockelmann & Holzwarth, Reference Zonneveld, Bockelmann and Holzwarth2007).
The IN/ON=nIN/(nIN + nON) and N/O=nN/(nN + nO) indices are additional environmental proxies. The IN/ON index, inner neritic (IN) v. outer neritic (ON) cysts, estimates the position on the shelf and proximity to the coast. The N/O index gives the abundance of oceanic cysts (O) relative to the neritic cysts (N) and represents transport from open marine areas into the shallow marine depositional environment. The P/D=nP/(nP + nD) index, pollen and spores (P) v. dinoflagellate cysts (D) is a proxy for proximity to the coast.
The ratio between warm- (W) and cold-water (C) indicators as expressed by the W/C=nW/(nW + nC) index serves as a proxy for the sea surface temperature. Temperature indices used in previous studies (Versteegh & Zonneveld, Reference Versteegh and Zonneveld1994; Boessenkool et al. Reference Boessenkool, Brinkhuis, Schonfeld and Targarona2001) do not function in the North Sea Basin because the species used are not appropriate to the environment or time interval. The W/C index used in this study does not include Impagidinium species, since these oceanic taxa are mostly present in low abundance in the samples. The cold-water species comprise Bitectatodinium tepikiense, Filisphaera filifera and Habibacysta tectata (e.g. Head, Reference Head1994, Reference Head1996). The warm-water species comprise Lingulodinium machaerophorum, Melitasphaeridinium choanophorum, Polysphaeridinium zoharyi, Selenopemphix nephroides, Spiniferites hyperacanthus/mirabilis, Spiniferites membranaceus, Tectatodinium pellitum and Tuberculodinium vancampoae (Head, Reference Head1997; Head & Westphal, Reference Head and Westphal1999; Marret & Zonneveld, Reference Marret and Zonneveld2003; Rochon et al. Reference Rochon, de Vernal, Turon, Matthiessen and Head1999). Typical inner neritic species such as Lingulodinium machaerophorum, Tectatodinium pellitum and Tuberculodinium vancampoae have been included as warm-water indicators, since they were recorded in every unit except the Luchtbal Sands, suggesting that the influence of the shallowing environment is limited. However, the inner neritic species Operculodinium israelianum is not used in the index because its presence appears to be controlled by environmental factors other than just temperature. Its abundance increases in the uppermost lithological units of the section, but declines in the deeper-water Kattendijk Formation, even though this formation represents the warmest parts of the Pliocene.
The raw data used to calculate these indices are provided in Figure 3, and the values for indices in each sample are given in online Appendix 2.
3. Results: palynological analysis of the Tunnel-Canal Dock section
3.a. Introduction
Twenty-seven samples were studied from five lithostratigraphic units, with varying sampling intervals (Fig. 2; online Appendix 1). The samples yielded 101 dinoflagellate cyst taxa (Fig. 3). A few of these taxa (e.g. Cerebrocysta? namocensis, Impagidinium japonicum, Lejeunecysta cinctoria and Nematosphaeropsis lativittatus) have not been recorded previously from Pliocene deposits of the southern North Sea Basin. Such taxa as Achomosphaera andalousiensis subsp. suttonensis, Batiacasphaera minuta/micropapillata, Bitectatodinium? serratum, Corrudinium devernaliae, Corrudinium? labradori, Invertocysta lacrymosa, Melitasphaeridium choanophorum, Operculodinium? eirikianum var. eirikianum, Operculodinium tegillatum and Reticulatosphaera actinocoronata have their range tops within the Pliocene of Belgium (Fig. 3; see also Louwye, Head & De Schepper, Reference Louwye, Head and De Schepper2004, tables 1, 2). These tops mostly coincide with changes in lithology at major unconformities. The dinoflagellate cyst species Desotodinium wrennii and Scaldecysta doelensis, first described from the DG and VB docks (Louwye, Head & De Schepper, Reference Louwye, Head and De Schepper2004; De Schepper, Head & Louwye, Reference De Schepper, Head and Louwye2004), have restricted stratigraphic ranges in the TK Dock section as elsewhere in Belgium.
The following species occur in nearly all samples (Fig. 3): Achomosphaera/Spiniferites spp. indet., Barssidinium pliocenicum, Bitectatodinium raedwaldii, Heteraulacacysta sp. A of Costa & Downie (Reference Costa, Downie, Montadert, Roberts, De Charpal and Guennoc1979), Lingulodinium machaerophorum, Operculodinium centrocarpum sensu Wall & Dale (Reference Wall and Dale1966), Operculodinium centrocarpum s.s., Operculodinium israelianum and Spiniferites hyperacanthus/mirabilis. Collectively, they represent at least 62% of each assemblage, averaging 80% and reaching as much as 95%. Operculodinium tegillatum is present only in the Kattendijk Formation, where it represents up to 40% of the assemblage prior to its HO in this unit.
Reworked dinoflagellate cysts are common in all samples except in sample TK63, where no reworked specimens were seen during the routine count (Fig. 3). Many species have an Eocene (e.g. Dracodinium varielongitudum, Eatonicysta ursulae) to Miocene (e.g. Lingulodinium multivirgatum) provenance. Similar observations were made from the DG Dock (S. De Schepper, unpub. M.Sc. thesis, Univ. Liège, 2001), where reworked dinoflagellate cysts from Cretaceous to Miocene age were identified. Reworking of Eocene palynomorphs was most prevalent, implying that Eocene (Ypresian) deposits occurring south of Antwerp were being eroded by rivers during Pliocene times.
Pollen were also recorded during the counts, but their usefulness for stratigraphy or palaeoecology is hindered by the selective loss of smaller specimens during sieving at 20 μm. In any case, large bisaccate pollen dominate the pollen count (Fig. 3) and Tsuga pollen are also common in all units. In general, pollen are less abundant than dinoflagellate cysts in the lower part of the section, but often at least twice as abundant in the upper part.
In addition to the dinoflagellate cysts, this study yielded several other aquatic palynomorph groups: acritarchs, marine incertae sedis, fresh water algae, microforaminiferal linings and miscellaneous invertebrate remains. Some of these have restricted stratigraphic ranges (Fig. 3), although the possible loss of small acritarchs during sieving may have affected their observed stratigraphic ranges.
3.b. Kattendijk Formation
3.b.1. Dinoflagellate cyst flora
The unit is characterized by the HO of Batiacasphaera minuta/micropapillata, Corrudinium devernaliae, Corrudinium? labradori, Melitasphaeridium choanophorum var. choanophorum, Operculodinium tegillatum and Reticulatosphaera actinocoronata and the acritarch Cyst type I of de Vernal & Mudie, Reference de Vernal, Mudie, Srivastava, Arthur and Clement1989 (Fig. 3). Most of these taxa have well-defined stratigraphic ranges in the North Atlantic and are discussed in De Schepper & Head (Reference De Schepper and Head2008). The single occurrence of Ataxiodinium confusum at the top of the unit is considered part of the autochthonous assemblage, since it usually occurs elsewhere in low abundances and has a well-defined HO in the North Atlantic. Spiniferites rubinus is recorded for the first time in the Kattendijk Formation, having not been reported from this unit in the DG or VB docks (Louwye, Head & De Schepper, Reference Louwye, Head and De Schepper2004).
3.b.2. Age assessment
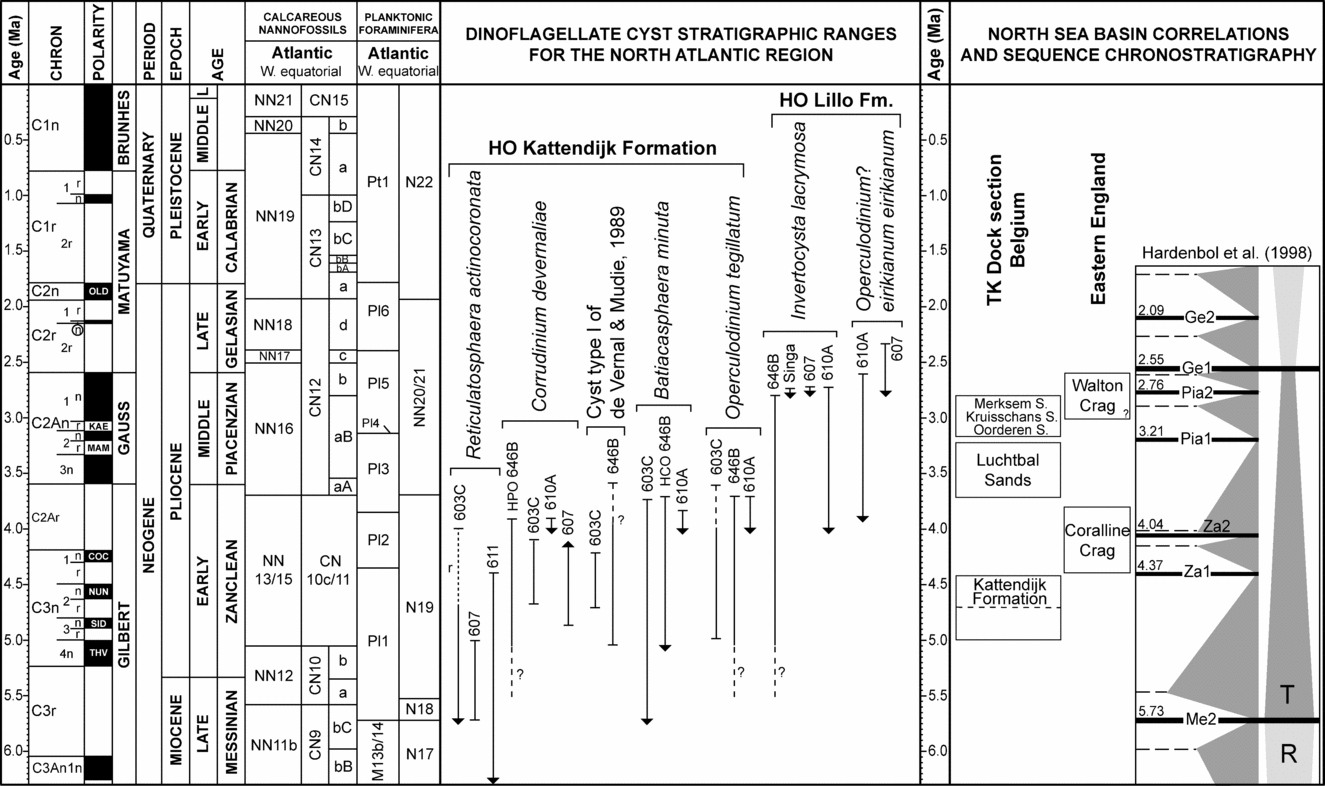
The range tops of Corrudinium devernaliae and Reticulatosphaera actinocoronata, the range base of Operculodinium tegillatum and the total range of Cyst type I of de Vernal & Mudie (Reference de Vernal, Mudie, Srivastava, Arthur and Clement1989) restrict the age of this unit (Fig. 5).
Stratigraphic ranges of selected dinoflagellate cyst species for the North Atlantic region calibrated to the ATNTS 2004 (Lourens et al. Reference Lourens, Hilgen, Shackleton, Laskar, Wilson, Gradstein, Ogg and Smith2005). Based on: DSDP Hole 603C, western North Atlantic (Head & Norris, Reference Head and Norris2003; M. J. Head, unpub. data); ODP Hole 646B, Labrador Sea (de Vernal & Mudie, Reference de Vernal, Mudie, Srivastava, Arthur and Clement1989; Knüttel, Russell & Firth, Reference Knüttel, Russell, Firth, Srivastava, Arthur and Clement1989); DSDP Site 607, central North Atlantic (Mudie, Reference Mudie, Ruddiman, Kidd and Baldauf1987; Versteegh, Reference Versteegh1997); DSDP Hole 610A, eastern North Atlantic (De Schepper & Head, Reference De Schepper and Head2008); and the Singa section in Italy (Versteegh, Reference Versteegh1997). Dashed lines indicate uncertainty in the stratigraphic range. The ages of formations are based on the present study of the TK Dock, and for eastern England on Head (Reference Head1997, Reference Head1998a, Reference Headb), Head & Norris (Reference Head and Norris2003) and Louwye, Head & De Schepper (Reference Louwye, Head and De Schepper2004). The Kattendijk Formation was deposited between 5.0 and 4.4 Ma, and likely between 4.7 and 4.4 Ma where exposed in the TK Dock (see text for discussion). The positions of the Kruisschans Sands and Merksem Sands are schematic, corresponding approximately with the estimated age for the units. Maximum and minimum ages depicted for units do not necessarily imply full duration of deposition. Correlation to the sequence chronostratigraphic chart of Hardenbol et al. (Reference Hardenbol, Thierry, Farley, Jacquin, de Graciansky, Vail, de Graciansky, Hardenbol, Jacquin and Vail1998) is also shown. T and R are transgressive and regressive facies cycles. HPO = highest persistent occurrence; HCO = highest common occurrence.

Corrudinium devernaliae has a well-defined HO between c. 3.9 and 4.11 Ma in the North Atlantic region (Head & Norris, Reference Head and Norris2003; De Schepper & Head, Reference De Schepper and Head2008). Its range base is recorded tentatively in the upper part of nannofossil zone NN12 (5.55–5.05 Ma) in Labrador Sea ODP Hole 646B (as Corrudinium sp. I in de Vernal & Mudie, Reference de Vernal, Mudie, Srivastava, Arthur and Clement1989; Knüttel, Russell & Firth, Reference Knüttel, Russell, Firth, Srivastava, Arthur and Clement1989), although in North Atlantic DSDP holes 603C and 607 its LO is at 4.66 Ma and 4.86 Ma, respectively (MJH, unpub. data; SDS, unpub. data; De Schepper & Head, Reference De Schepper and Head2008).
The HO of Reticulatosphaera actinocoronata in the North Atlantic region lies within the Early Pliocene (Head, Norris & Mudie, Reference Head, Norris, Mudie, Srivastava, Arthur and Clement1989a, p. 439; see detailed discussion in Louwye, Head & De Schepper, Reference Louwye, Head and De Schepper2004). The latter authors estimate that Reticulatosphaera actinocoronata ranges no higher than about 4.4 Ma in the North Atlantic region, and that this datum may be closer to c. 4.7 Ma if the possibility of reworking is considered for North Atlantic records.
The LO of Operculodinium tegillatum has been documented only for western North Atlantic DSDP Hole 603C, where this datum is well defined and has a magnetostratigraphically calibrated age of 5.02 Ma (MJH, unpub. data). The presence of Operculodinium tegillatum in the lowest sample from the Kattendijk Formation suggests an age younger than 5.0 Ma.
Cyst type I of de Vernal & Mudie (Reference de Vernal, Mudie, Srivastava, Arthur and Clement1989) has a narrow range within the Zanclean of ODP Hole 646B in the Labrador Sea and a similarly narrow range between 4.7 and 4.2 Ma in western North Atlantic DSDP Hole 603C (MJH, unpub. data; Louwye, Head & De Schepper, Reference Louwye, Head and De Schepper2004). This species has also been recorded from the Zanclean off West Greenland (Piasecki, Reference Piasecki2003) and a single specimen was reported from the Kattendijk Formation in the DG Dock (Louwye, Head & De Schepper, Reference Louwye, Head and De Schepper2004). It occurs rarely in the Kattendijk Formation of the TK Dock, and a single specimen recorded in the Merksem Sands is considered reworked.
In summary, our sampled part of the Kattendijk Formation in the TK section has an estimated age of between 5.0 and 4.7–4.4 Ma (Fig. 5), and is probably within the range of c. 4.7–4.4 Ma, based on the total range of Cyst type I of de Vernal & Mudie (Reference de Vernal, Mudie, Srivastava, Arthur and Clement1989) in DSDP Hole 603C and the HO of Reticulatosphaera actinocoronata in the North Atlantic. This conclusion generally agrees with the age proposed by Louwye, Head & De Schepper (Reference Louwye, Head and De Schepper2004) for the Kattendijk Formation in the DG and VB dock sections, but emphasizes the significance of Cyst type I.
3.b.3. Palaeoecology
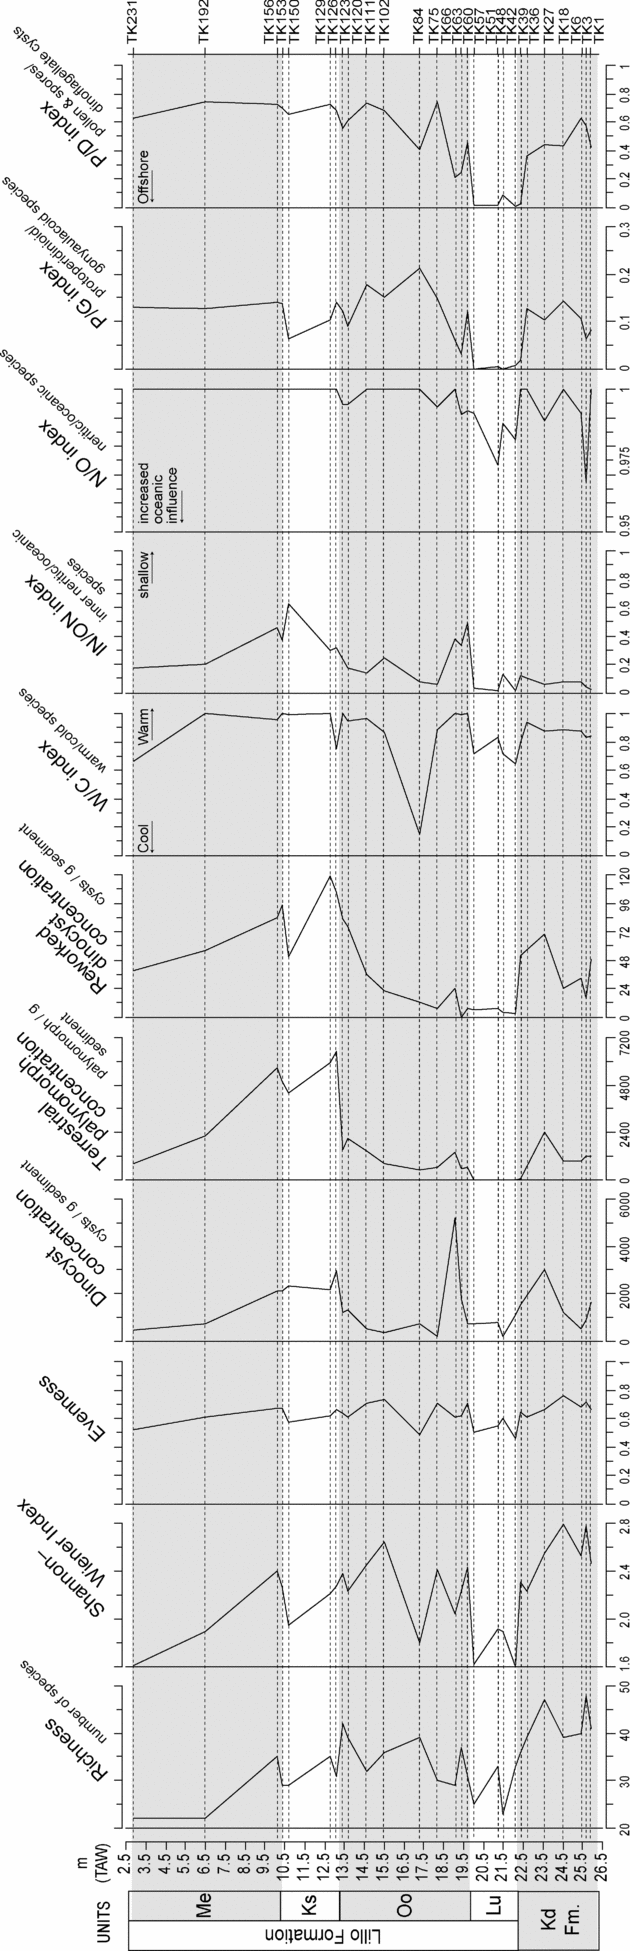
The Kattendijk Formation contains the highest number of species in the section (n=48), and the Shannon–Wiener diversity index also reaches peak values in this formation (Fig. 6). Evenness is relatively high, signifying an equal representation of most species in the assemblages. Dinoflagellate cyst concentration averages 1475 cyst/g (excluding sample TK36). The average terrestrial palynomorph concentration is comparable at 1132 specimens/g, while reworking is on average 41 specimens/g.
Palaeoecological indices based on dinoflagellate cysts for the Lillo and Kattendijk formations of the TK Dock. Abbreviations for lithological units are as follows: Kd Fm. = Kattendijk Formation; Lu = Luchtbal Sands Member; Oo = Oorderen Sands Member; Ks = Kruisschans Sands Member; Me = Merksem Sands Member. Metres TAW = see legend for Figure 2. Palynomorph concentrations of sample TK 36 are not plotted, since the error adds up to 45% (online Appendix 2).

The temperature index (W/C) indicates warm-water conditions, supporting conclusions reached earlier for the DG and VB docks (Louwye, Head & De Schepper, Reference Louwye, Head and De Schepper2004). Terrestrial palynomorphs are more abundant than dinoflagellate cysts in these deposits, resulting in a moderately high P/D index that suggests a fairly close proximity to the coast. The environmental indices (IN/ON and N/O) reflect neritic environments with some influence of oceanic waters, based on the presence of oceanic dinoflagellate cysts (Impagidinium spp.).
The Kattendijk Formation was deposited in a neritic environment with some open-marine influence during warm-temperate climates, as corroborated by dinoflagellate cyst evidence from the DG and VB docks (Louwye, Head & De Schepper, Reference Louwye, Head and De Schepper2004) and a 30–50 m estimated water depth based on otoliths (Gaemers, Reference Gaemers and Vinken1988).
3.c. Lillo Formation
The Lillo Formation unconformably overlies the Kattendijk Formation. Although there is good control on the youngest possible age for deposition of the Kattendijk Formation, no precise biostratigraphic evidence exists for the base of the Lillo Formation. However, an absence of the typical Kattendijk Formation species Batiacasphaera minuta/micropapillata, Corrudinium devernaliae, Operculodinium tegillatum and Reticulatosphaera actinocoronata from the Lillo Formation allows some inferences to be made. These species have their lowest well-constrained HOs within the North Atlantic region (primarily DSDP sites 603, 607, 610 and ODP Site 646) as follows: Reticulatosphaera actinocoronata at c. 5.0 Ma in Hole 607 (Louwye, Head & De Schepper, Reference Louwye, Head and De Schepper2004), Corrudinium devernaliae at 4.11 Ma in Hole 603C (De Schepper & Head, Reference De Schepper and Head2008), Batiacasphaera minuta/micropapillata at 3.83 in Hole 610A (De Schepper & Head, Reference De Schepper and Head2008), and Operculodinium tegillatum at 3.71 Ma in Hole 610A (De Schepper & Head, Reference De Schepper and Head2008). Based on the absence of Operculodinium tegillatum, the maximum possible age of the Lillo Formation is 3.71 Ma (Figs 3, 5).
3.c.1. Luchtbal Sands Member
3.c.1.a. Dinoflagellate cyst flora
Few species have their HOs or LOs within this unit. Batiacasphaera minuta/micropapillata has a HO in the lowest sample, but this can be attributed to reworking. Likewise, occasional specimens of Operculodinium tegillatum in this and higher units are considered reworked. Bitectatodinium? serratum has a HO within the Luchtbal Sands. Operculodinium centrocarpum sensu Wall & Dale (Reference Wall and Dale1966) has among the highest values in this unit. There are indications that the palynological record of this member is biased as a result of syn- or post-depositional processes. This is discussed in more detail in Section 3.c.4, below.
3.c.1.b. Age assessment
There are no biostratigraphically diagnostic species in the Luchtbal Sands. Bitectatodinium? serratum, which has its HO within this unit (Fig. 3), has been reported sporadically from the upper Miocene and Pliocene of the North Atlantic region (e.g. Head, Norris & Mudie, Reference Head, Norris, Mudie, Srivastava, Arthur and Clement1989a; S. De Schepper, unpub. Ph.D. thesis, Univ. Cambridge, 2006; Louwye et al. Reference Louwye, De Schepper, Laga and Vandenberghe2007). Its precise range is not known. The estimated maximum age of the Luchtbal Sands is that of the Lillo Formation, as discussed above.
3.c.2. Oorderen Sands Member
3.c.2.a. Dinoflagellate cyst flora
Achomosphaera andalousiensis subsp. suttonensis and Invertocysta lacrymosa both have their HOs within the Oorderen Sands (Fig. 3). Scaldecysta doelensis appears for the first time near the top of the Oorderen Sands and persists into the Merksem Sands. Desotodinium wrennii and the acritarchs Cyclopsiella? trematophora and Waaslandia geminifera are known only from this unit onwards. Their presence can be used to distinguish the Oorderen Sands from the subjacent Luchtbal Sands. All three species have also been recognized from the Basal Shelly Unit (BSU) in the DG and VB docks (Louwye, Head & De Schepper, Reference Louwye, Head and De Schepper2004; De Schepper, Head & Louwye, Reference De Schepper, Head and Louwye2004), genetically relating the BSU at both docks to the Oorderen Sands.
3.c.2.b. Age assessment
The LOs of the dinoflagellate cyst Desotodinium wrennii and acritarchs Cyclopsiella? trematophora and Waaslandia geminifera appear to be good indicators for the base of the Oorderen Sands in the TK Dock (Fig. 3) but do not contribute to the age assessment of the unit. Scaldecysta doelensis appears restricted to shallow palaeoenvironments, limiting its stratigraphic utility. Forms similar to the genus Scaldecysta have been found in Upper Miocene shallow-marine deposits of northern Belgium (Louwye et al. Reference Louwye, De Schepper, Laga and Vandenberghe2007).
The HO of Invertocysta lacrymosa at the top of the Oorderen Sands is significant because this event is synchronous in the eastern North Atlantic and the Mediterranean at 2.72–2.74 Ma (De Schepper & Head, Reference De Schepper and Head2008). In the Labrador Sea and Norwegian–Greenland Sea, where age control is less accurate, the LA is recorded slightly earlier at c. 2.8 Ma. Invertocysta lacrymosa is usually associated with open-marine palaeoenvironments, and its disappearance in the Oorderen Sands may be premature owing to the more restricted marine palaeoenvironments of the overlying members. The Oorderen Sands is therefore no younger than about 2.72–2.74 Ma, and indeed probably older. Its maximum possible age is that of the Lillo Formation at 3.71 Ma, as discussed above.
3.c.3. Kruisschans and Merksem sands members
3.c.3.a. Dinoflagellate cyst flora
There are few LOs or HOs within these members, and many species range through the Oorderen and Kruisschans sands and into the Merksem Sands. Characteristic species of both members include Amiculosphaera umbraculum, Barssidinium pliocenicum, Bitectatodinium raedwaldii, Heteraulacacysta sp. A of Costa & Downie (Reference Costa, Downie, Montadert, Roberts, De Charpal and Guennoc1979), Operculodinium centrocarpum sensu Wall & Dale (Reference Wall and Dale1966), Operculodinium centrocarpum s.s., Operculodinium israelianum, Scaldecysta doelensis and various other protoperidiniaceans, Tectatodinium pellitum, and the acritarchs Nannobarbophora walldalei and Waaslandia geminifera.
3.c.3.b. Age assessment
There are no clearly age diagnostic LOs in these members (Fig. 3), but both units contain Scaldecysta doelensis, which appears to be restricted to the upper part of the Lillo Formation in northern Belgium (De Schepper, Head & Louwye, Reference De Schepper, Head and Louwye2004). Pyxidinopsis braboi ranges to the top of the Kruisschans Sands. It has a range of 3.15–2.57 Ma in eastern North Atlantic Hole 610A (S. De Schepper, unpub. Ph.D. thesis, Univ. Cambridge, 2006), but as its occurrence here is sporadic, its range must be considered provisional.
The presence of Barssidinium spp., Desotodinium wrennii and Tectatodinium pellitum in both members is stratigraphically significant because within the Pliocene–Early Pleistocene succession of eastern England, none of these thermophilic taxa have been reported above the Piacenzian. Their regional disappearance is presumably related to the onset of Northern Hemisphere glaciation around the end of the Piacenzian. A pre-Gelasian age (before 2.58 Ma) is therefore accepted for the Kruisschans and Merksem sands. Such an interpretation is supported by a study of Miocene through Lower Pleistocene wells in the southern North Sea that integrate the dinoflagellate cyst record with that of foraminifera, pollen, gamma-ray logs and magnetostratigraphy (Kuhlmann, Reference Kuhlmann2004; Kuhlmann et al. Reference Kuhlmann, Langereis, Munsterman, van Leeuwen, Verreussel, Meulenkamp and Wong2006a,b). This study shows that Barssidinium spp. and Tectatodinium pellitum have their highest persistent occurrence just below the Gauss–Matuyama Chron boundary, correlating loosely with the Waltonian Crag of eastern England (late Piacenzian). Evidence from the pollen, particularly the presence of Taxodium and Sciadopitys (Fig. 3; Hacquaert, Reference Hacquaert1960, Reference Hacquaert1963), supports a Reuverian B (pre-Gelasian) age (de Jong, Reference de Jong1988) for the Kruisschans and Merksem sands.
3.c.4. Palaeoecology of the Lillo Formation
3.c.4.a. Luchtbal Sands Member
The unit contains a low average number of species (n=29). This directly results from the absence of protoperidinioids and the dominance of Operculodinium centrocarpum sensu Wall & Dale (Reference Wall and Dale1966) and Achomosphaera/Spiniferites spp. indet. This is expressed in the P/G index that equals almost zero and in the Shannon–Wiener index which is the lowest in the section (Fig. 6). Dinoflagellate cyst reworking is very low (5 specimens/g). Sample TK48 has the lowest dinoflagellate cyst concentration in the section (195 cysts/g; Fig. 6; online Appendix 2). Pollen and spores are almost completely absent from the Luchtbal Sands (average of 5 terrestrial palynomorphs/g). In particular, bisaccate conifer pollen is reduced relative to other units, while grass pollen becomes relatively more important. This might suggest cold, tundra-like conditions, but because the palynological residues were sieved at 20 μm, it is not possible to determine whether smaller, thermophilous angiosperm tree pollen were originally present.
The P/D index indicates that this unit was deposited furthest from the coast relative to the other units. However, this is not likely because the N/O and IN/ON indices place this unit in environments similar to the Kattendijk Formation (Fig. 6). There are only slightly higher numbers of Impagidinium species than in the Kattendijk Formation or overlying Oorderen Sands, which may indicate enhanced current activity from the deeper parts of the basin towards the coast. The presence of Filisphaera filifera points towards cool conditions, which is reflected in the W/C index, but this species also appears to have preference for open-water shelf environments.
Species of the genera Brigantedinium, Lejeunecysta, Selenopemphix and Trinovantedinium are mainly absent from the Luchtbal Sands, but are often present in the units above and below. Laboratory experiments (Schrank, Reference Schrank1988; De Schepper, Head & Louwye, Reference De Schepper, Head and Louwye2004) and geological observations (Zonneveld, Versteegh & de Lange, Reference Zonneveld, Versteegh and de Lange1997, Reference Zonneveld, Versteegh and de Lange2001; Zonneveld, Bockelmann & Holzwarth, Reference Zonneveld, Bockelmann and Holzwarth2007) have shown that protoperidiniaceans are susceptible to degradation by oxidation. A preservational overprint caused by syn- or post-depositional oxidation and/or mechanical degradation in the high-energy depositional environment most likely explains the scarcity of protoperidiniaceans in the Luchtbal Sands.
This unit consists mainly of shells, suggesting a high-energy environment during deposition. Using evidence from bryozoans and benthic foraminifers, P. Laga (unpub. Ph.D. thesis, Univ. Leuven, 1972) proposed that deposition took place in a clear-water, high-energy, open-marine environment with limited sediment supply and within reach of wave base. We interpret the Luchtbal Sands as a lag deposit in response to a renewed sea-level rise (see Section 5.a). Winnowing of fine sediment (clay and silt) and palynomorphs is likely in such an environment, and Head (Reference Head1998a) noted with respect to the Crag deposits of eastern England that current-dominated deposits can be unsuitable for dinoflagellate cyst studies because of winnowing. Therefore, palaeoenvironmental conclusions based on palynology prove difficult. The presence of cold-water and open-marine species suggests the influence of cool waters from northerly parts of the North Sea via currents or storms. Such an interpretation would be consistent with the lithology of the unit, but a more widespread basin-wide cooling cannot be excluded. The Luchtbal Sands is an unusual unit within the Pliocene of Belgium due to its distinctive lithology, patchy spatial record and variable thickness.
3.c.4.b. Oorderen and Kruisschans sands members
Nearshore palaeoenvironments are suggested by relatively higher values of the IN/ON index in most samples, but especially at the base of the Oorderen Sands and the near the top of the Kruisschans Sands (Fig. 6). Together with lithological evidence and other palynological indices, this suggests that the Oorderen Sands and Kruisschans Sands are part of the same depositional sequence cycle (see also Louwye, Head & De Schepper, Reference Louwye, Head and De Schepper2004).
In these units, protoperidinioids reappear, but gonyaulacoids remain strongly dominant. In sample TK84, lower numbers of gonyaulacoids were recorded, causing the P/G index to exceed 0.2. In this sample, Heteraulacacysta sp. A of Costa & Downie (Reference Costa, Downie, Montadert, Roberts, De Charpal and Guennoc1979), a goniodomacean (a gonyaulacoid) and not included in the P/G index, dominates the assemblage. The environmental conditions responsible for the relatively higher amounts of protoperidinioids likely also caused Heteraulacacysta sp. A of Costa & Downie (Reference Costa, Downie, Montadert, Roberts, De Charpal and Guennoc1979) to thrive. The dominance of this species influences the Shannon–Wiener index and evenness, which are very low compared to the other samples from this unit. Heteraulacacysta sp. A of Costa & Downie (Reference Costa, Downie, Montadert, Roberts, De Charpal and Guennoc1979) was not unequivocally considered to range upwards into the Pliocene until the study of Louwye, Head & De Schepper (Reference Louwye, Head and De Schepper2004). The present study further confirms that this species is not reworked, given its presence in high abundances in every sample. Furthermore, there appears to be little or no relation between the absolute abundance of this species and the reworked dinoflagellate cyst concentration (R2=0.0053).
Sample TK84 also records a lowered W/C index due to an increase in the cold-water species Bitectatodinium tepikiense and Habibacysta tectata and decrease in such warm-water indicators as Lingulodinium machaerophorum, whereas the unit is generally characterized by a high W/C index. Otherwise, the Oorderen Sands represents warm-temperate neritic conditions, and is somewhat similar to the Kattendijk Formation but probably deposited closer to shore. Evidence from otoliths suggests water depths between 10 and 20 m (Gaemers, Reference Gaemers and Vinken1988), and a brackish influence is recorded from benthic foraminifers (P. Laga, unpub. Ph.D. thesis, Univ. Leuven, 1972). The latter author interprets the Oorderen Sands as a clear-water environment with slow sedimentation rates at the base, developing into more turbid and higher energy conditions towards the top of the unit.
The Kruisschans Sands has a higher clay content than the Oorderen Sands (Fig. 2; Laga, Louwye & Geets, Reference Laga, Louwye and Geets2002), which is likely related to less energetic depositional environments. The highest average dinoflagellate cyst (>2400 cysts/g) and terrestrial palynomorph (>5400 specimens/g) concentrations of any lithological unit in the section are recorded in the Kruisschans Sands, presumably reflecting these low-energy depositional environments. Deposition occurred in shallow and turbid waters, where high sedimentation rates prevailed (P. Laga, unpub. Ph.D. thesis, Univ. Leuven, 1972). Increased abundances of Operculodinium israelianum seem to be consistent with shallow depths. This species today is common at shallow water depths including estuaries, and has a mild-temperate to tropical ecological range (Head, Reference Head1996, Reference Head1998a). An apparent conflict between its modern autecology and its association with ‘cold’ stages in the Gelasian of eastern England (Head, Reference Head1998a) has been resolved by new data from the Gelasian of the southern North Sea that reaffirm its thermophilic affinities (Kuhlmann, Reference Kuhlmann2004; Kuhlmann et al. Reference Kuhlmann, Langereis, Munsterman, van Leeuwen, Verreussel, Meulenkamp and Wong2006a,b; Meijer et al. Reference Meijer, Cleveringa, Munsterman and Verreussel2006). Reduced numbers of Achomosphaera andalousiensis through the Kruisschans Sands and Merksem Sands seem also to be a consequence of the more restricted marine conditions. Molluscs from the Kruisschans Sands indicate cooling (Marquet, Reference Marquet1993), although this is not evident from the palynological data.
The disappearance of Invertocysta lacrymosa at the top of the Oorderen Sands requires comment. Climatic deterioration appears to explain the disappearance of this species from the North Atlantic region at 2.72 Ma (Versteegh, Reference Versteegh1997; De Schepper & Head, Reference De Schepper and Head2008), but the development of more restricted marine environments as evidenced by the Kruisschans Sands may have caused this species to disappear prematurely from the Antwerp harbour area.
3.c.4.c. Merksem Sands Member
The lowest average number of species (n=26) and the lowest number of species per sample (n=22) are recorded in this unit (Fig. 6). This is also reflected in the Shannon–Wiener index, which reveals a steeply decreasing trend. Almost three times more terrestrial palynomorphs are recorded than dinoflagellate cysts, indicating very close proximity to land. This conclusion is supported by high amounts of plant debris encountered in the slides. The W/C index shows continuing warm conditions, although perhaps cooling somewhat in the highest sample.
Numerous tropical to mild-temperate marine palynomorph taxa (Head, Reference Head1996, Reference Head1997, Reference Head1998b, Reference Head2003), many continuing from the Kruisschans Sands, are present in the Merksem Sands. These include Barssidinium pliocenicum, Capisocysta sp., Desotodinium wrennii, Lingulodinium machaerophorum (lowest sample only), Operculodinium israelianum, Tectatodinium pellitum and Tuberculodinium vancampoae (lowest sample only) and the acritarch Nannobarbophora walldalei. These taxa indicate warm- or mild-temperate conditions prior to the onset of cooling towards the end of the Piacenzian.
The particular abundance of the extinct Heteraulacacysta sp. A of Costa & Downie (Reference Costa, Downie, Montadert, Roberts, De Charpal and Guennoc1979) and marine incertae sedis species Waaslandia geminifera in the highest sample (TK231) presents unusual conditions within this restricted marine palaeoenvironment.
4. Comparison of Antwerp Harbour sections
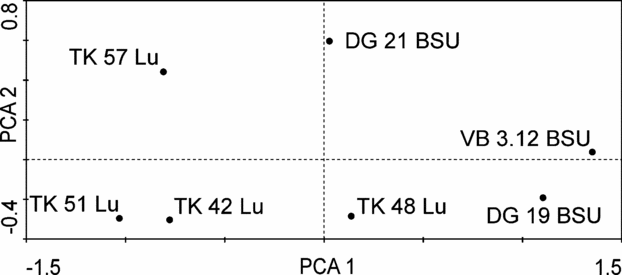
The sedimentary succession and dinoflagellate cyst floras of the TK Dock section (this study) compare closely with those of the DG and VB Dock sections (Louwye, Head & De Schepper, Reference Louwye, Head and De Schepper2004), except that the Luchtbal Sands and Merksem Sands are exposed only at the TK Dock section. According to P. Laga (pers. comm.), the Luchtbal Sands cropped out close to the river in the DG Dock but had disappeared about 500 m further south in the dock where the samples of Louwye, Head & De Schepper (Reference Louwye, Head and De Schepper2004) were collected. Regarding the absence of the Luchtbal Sands from the DG Dock, the lowest sample of the Basal Shelly Unit (BSU) from the Oorderen Sands (sample 21 in Louwye, Head & De Schepper, Reference Louwye, Head and De Schepper2004; DG 21 BSU in Fig. 7) in this section provides a clue. The dinoflagellate cyst assemblage from this sample contains many features in common with the Luchtbal Sands of the TK Dock section, including elevated numbers of Filisphaera filifera and Achomosphaera/Spiniferites spp. indet. An ordination plot (Fig. 7) shows it positioned closer to the Luchtbal Sands samples of the TK Dock than to the other BSU samples. The BSU of the Oorderen Sands is sedimentologically similar to the Luchtbal Sands (Louwye, Head & De Schepper, Reference Louwye, Head and De Schepper2004). Hence, it appears that the lowest part of the BSU in the DG Dock consists of reworked Luchtbal Sands and consequently also reworked dinoflagellate cysts from that member. No other evidence for the Luchtbal Sands was seen at the DG or VB dock sections.
Principal Component Analysis (PCA) on untransformed raw data of dinoflagellate cyst assemblages in the Luchtbal Sands Member (LU) and Basal Shelly Unit (BSU) of the Oorderen Sands Member from three docks (TK, DG and VB) in the Antwerp Harbour (this study; Louwye, Head & De Schepper, Reference Louwye, Head and De Schepper2004), revealing the difficulties in interpreting each unit. The assemblage in the lowermost sample of the BSU in the DG Dock (DG BSU 21; Louwye, Head & De Schepper, Reference Louwye, Head and De Schepper2004) shows characteristics of the Luchtbal Sands assemblages, and is considered to be the result of reworking of the latter unit.

5. Sequence stratigraphy
5.a. Sequence stratigraphic interpretation of the Belgian Pliocene deposits
Sequence boundaries (SBs) have been identified from field observations in the DG and VB docks (Louwye, Head & De Schepper, Reference Louwye, Head and De Schepper2004) and lithological descriptions of the TK Dock (P. Laga, unpub. Ph.D. thesis, Univ. Leuven, 1972) and other outcrops in the Antwerp Harbour area (Tavernier & de Heinzelin, Reference Tavernier and de Heinzelin1962; De Meuter & Laga, Reference De Meuter and Laga1976). Four SBs are recognized within the uppermost Miocene–Pliocene deposits of the southern North Sea. The base of the Kattendijk Formation, not observed in the TK Dock, is marked by basal gravel and rounded bones and reflects the first SB (De Meuter & Laga, Reference De Meuter and Laga1976; Laga, Louwye & Geets, Reference Laga, Louwye and Geets2002). The rich glauconitic content of the unit indicates sediment starvation and implies deposition at considerable distance from the coast during a transgression or possibly even during the maximum extent of flooding (Sturrock, Reference Sturrock, Emery and Myers1996). The unit is therefore interpreted as a Transgressive Systems Tract.
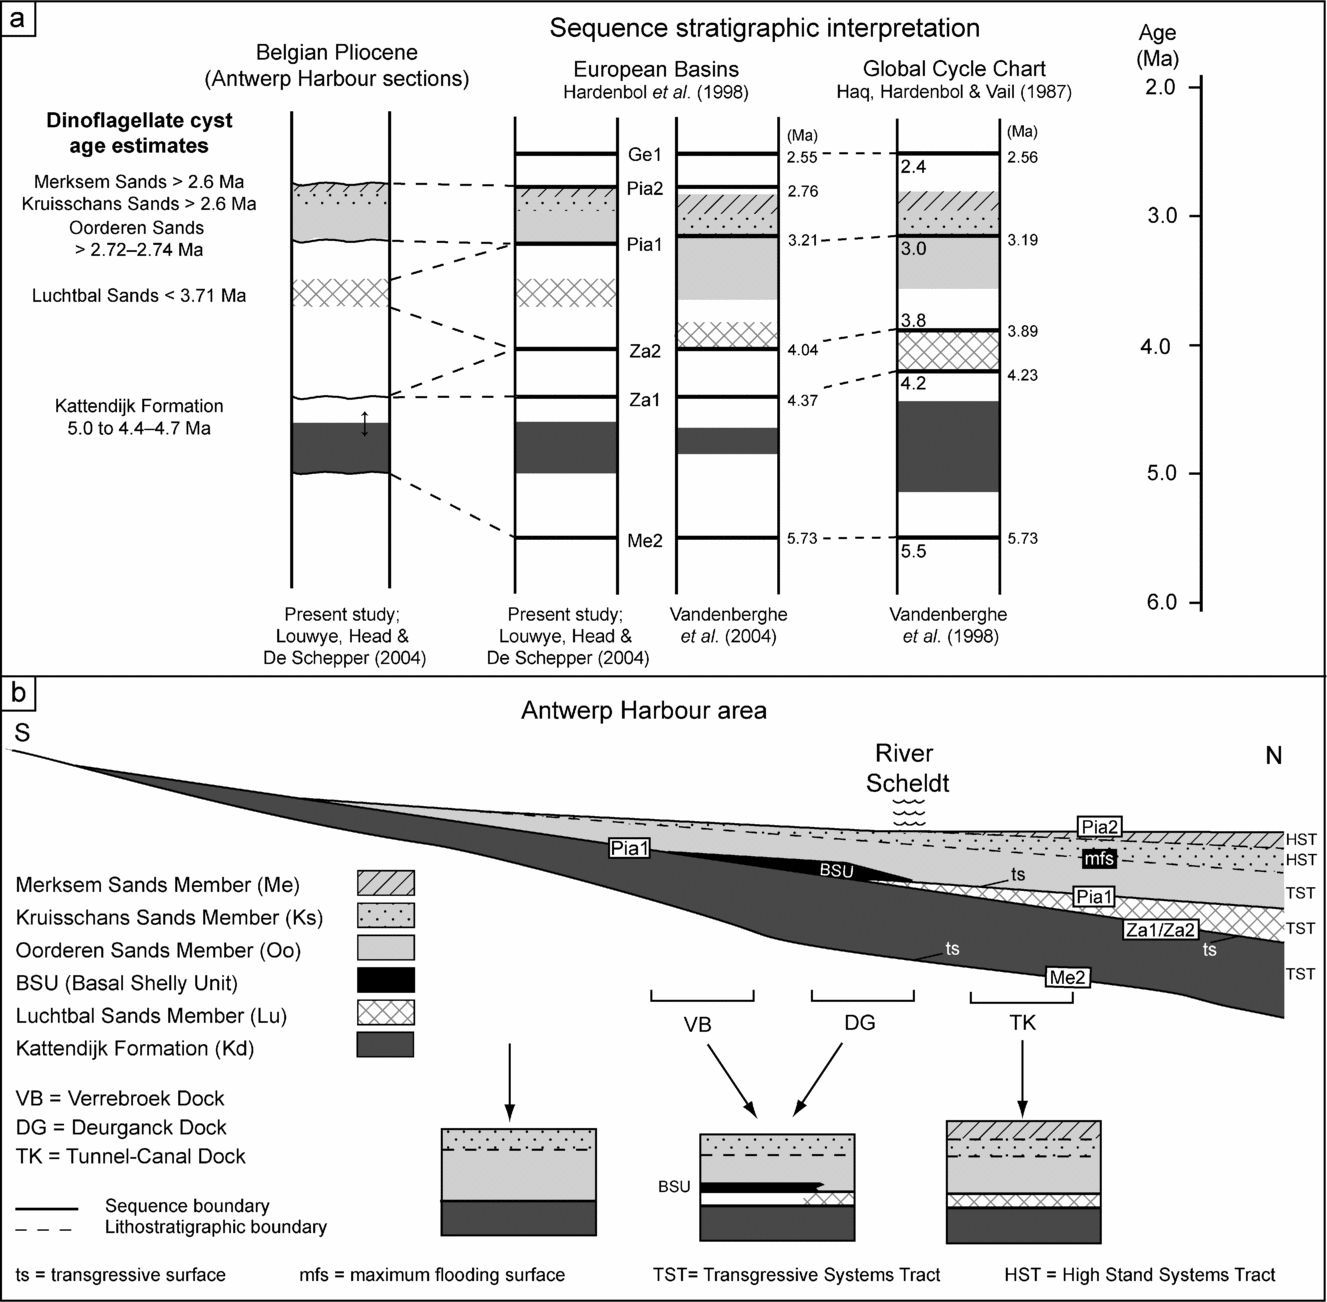
The second SB is placed at the base of the Lillo Formation, and is overlain by either the Luchtbal Sands or Oorderen Sands (Figs 5, 8). The boundary between the Kattendijk Formation and the Luchtbal Sands is undulating and marked by gravel and bones in the TK Dock (Fig. 2). In the DG and VB Dock sections, where the Luchtbal Sands are absent, an undulating boundary is observed between the Oorderen Sands and the underlying Kattendijk Formation (Louwye, Head & De Schepper, Reference Louwye, Head and De Schepper2004).
(a) Sequence stratigraphic interpretation for the Pliocene of Belgium from the present study and that of Vandenberghe et al. (Reference Vandenberghe, Van Simaeys, Steurbaut, Jagt and Felder2004) and Vandenberghe et al. (Reference Vandenberghe, Laga, Steurbaut, Hardenbol, Vail, de Graciansky, Hardenbol, Jacquin and Vail1998). All three schemes are correlated to the stratigraphic framework of Hardenbol et al. (Reference Hardenbol, Thierry, Farley, Jacquin, de Graciansky, Vail, de Graciansky, Hardenbol, Jacquin and Vail1998) and the global cycle chart of Haq, Hardenbol & Vail (Reference Haq, Hardenbol and Vail1987). (b) Schematic N–S transect through the southernmost North Sea Basin in northern Belgium, and sequence stratigraphic interpretation based on evidence from three sections (VB, DG and TK docks) showing the restricted distribution of the Luchtbal Sands Member. See http://journals.cambridge.org/geo for a colour version of this figure.

The Luchtbal Sands represents a separate sequence (P. Laga, unpub. Ph.D. thesis, Univ. Leuven, 1972; De Meuter & Laga, Reference De Meuter and Laga1976; Vandenberghe et al. Reference Vandenberghe, Laga, Steurbaut, Hardenbol, Vail, de Graciansky, Hardenbol, Jacquin and Vail1998, Reference Vandenberghe, Van Simaeys, Steurbaut, Jagt and Felder2004). The unit is likely related to a transgressive surface, where in-situ reworking, winnowing of the sediment and diagenetic processes may limit the preservation of fossils (Sturrock, Reference Sturrock, Emery and Myers1996, p. 101). In response to a sea-level rise, lag deposits in the form of widespread tabular bodies of shells can form on a transgressive surface (Kidwell, Reference Kidwell1989). The upper unconformity, between the Luchtbal Sands and Oorderen Sands, is the third SB. This SB is not recognized everywhere in the Antwerp Harbour owing to the patchy distribution of the Luchtbal Sands (Fig. 8), and so the second and third SBs coincide where this unit is absent.
In the VB and DG docks, a basal shelly unit (BSU of Louwye, Head & De Schepper, Reference Louwye, Head and De Schepper2004) characterizes the base of the Oorderen Sands. The lithology of the BSU probably also corresponds to a lag deposit in response to a renewed sea-level rise. The shells are likely reworked from the Luchtbal Sands by storms and thus still represent populations indigenous to the shelf. The BSU of the Lillo Formation is therefore interpreted to reflect the earliest stages of a transgression.
Above the BSU, the faintly cross-bedded sandy interval, with dispersed shell layers of the Oorderen Sands (observed at all three docks) can be interpreted as a transgressive systems tract, deposited under a prolonged rising sea level. This unit contains glauconite, which is indicative of transgression (Sturrock, Reference Sturrock, Emery and Myers1996). Just below the Oorderen/Kruisschans sands boundary, the high number of species (n=42; online Appendix 2) might reflect a maximum flooding surface (Sturrock, Reference Sturrock, Emery and Myers1996). The clay content increases gradually upwards in the section and finally becomes dominant in the Kruisschans Sands. Such a shallowing-upward trend is typical for prograding parasequence sets of a highstand systems tract, which occur when accommodation space is exceeded by the rate of sedimentation. Therefore, the Kruisschans Sands were deposited nearer to the coast than the Oorderen Sands, and correspond to slower relative sea-level rise and still-stand.
Tavernier & de Heinzelin (Reference Tavernier and de Heinzelin1962) interpreted the Merksem Sands as a beach deposit, with discontinuous gravel, mammal and terrestrial or beach molluscs with a slight regressive character. In the TK Dock, the transition from the Kruisschans to Merksem sands is gradual, which suggests that both units belong to the same depositional cycle and places the Merksem Sands within the later parts of the highstand systems tract. Indeed, the lithology and palynology suggest a very near-shore depositional environment. The Merksem Sands are placed in a separate sequence by Vandenberghe et al. (Reference Vandenberghe, Laga, Steurbaut, Hardenbol, Vail, de Graciansky, Hardenbol, Jacquin and Vail1998), although Vandenberghe et al. (Reference Vandenberghe, Van Simaeys, Steurbaut, Jagt and Felder2004, fig. 7) placed the unit together with the Kruisschans Sands within a single sequence.
In the DG and VB docks, the Merksem Sands are absent and the BSU–Oorderen–Kruisschans sands sequence is topped by an unconformity clearly marked by rounded gravel, clay balls and carbonized wood. This unconformity is the fourth SB and marks the base of the overlying Quaternary deposits. Where the Merksem Sands is present (TK Dock), it also has an unconformable contact with the Quaternary deposits.
5.b. Correlation with the sequence chronostratigraphic framework of European basins
The present study completes the investigation by Louwye, Head & De Schepper (Reference Louwye, Head and De Schepper2004) because it describes the Luchtbal Sands and Merksem Sands, which are missing from the VB and DG docks. All studied units are snapshots of sedimentation as transgressive and highstand systems tracts, bounded by SBs. Due to the specific location of the study area at the margin of a very shallow basin, a sea-level drop affects sedimentation and erosion earlier than in the deeper parts of the basin. This can cause the age of the SBs to differ slightly from ages given in the sequence stratigraphic charts. The units are correlated to the global cycle chart of Haq, Hardenbol & Vail (Reference Haq, Hardenbol and Vail1987) and to a sequence stratigraphic framework for the European Basins of Hardenbol et al. (Reference Hardenbol, Thierry, Farley, Jacquin, de Graciansky, Vail, de Graciansky, Hardenbol, Jacquin and Vail1998) (Figs 5, 8, 9).
The SB at the base of the Kattendijk Formation corresponds to the Me2 SB (not covered in the present study), and is likely linked to the glacial stage TG20 at c. 5.75 Ma (Hodell et al. Reference Hodell, Curtis, Sierro and Raymo2001; Louwye et al. Reference Louwye, De Schepper, Laga and Vandenberghe2007), which corresponds to a sea-level lowering of ±50 m (Krijgsman et al. Reference Krijgsman, Hilgen, Raffi, Sierro and Wilson1999). The unconformity at the top of the Kattendijk Formation (5.0–4.4 Ma) is correlated with the Za1 and Za2 SBs, and where the Luchtbal Sands is absent, also with the Pia1 SB (Fig. 8). The Za1 SB could correspond to MIS CN6 (c. 4.0 Ma), while the Za2 SB is likely caused by glacio-eustatic sea-level fall associated with the pronounced glacials MIS Gi20 and Gi22 (Lisiecki & Raymo, Reference Lisiecki and Raymo2005).
All members of the Lillo Formation are younger than c. 3.7 Ma and older than 2.58 Ma, with the Luchtbal Sands, BSU and Oorderen Sands being older than 2.72 Ma. The Luchtbal Sands are bounded by unconformities (P. Laga, unpub. Ph.D. thesis, Univ. Leuven, 1972; De Meuter & Laga, Reference De Meuter and Laga1976; Vandenberghe et al. Reference Vandenberghe, Laga, Steurbaut, Hardenbol, Vail, de Graciansky, Hardenbol, Jacquin and Vail1998; present study) and therefore represent a separate sequence. Dinoflagellate cyst evidence shows that the lower boundary of this unit can be correlated only to the Za2 SB. This implies that either there was no deposition during the period between the Za1 and Za2 SBs, or deposits were removed completely during the sea-level drop associated with the Za2 boundary. Vandenberghe et al. (Reference Vandenberghe, Laga, Steurbaut, Hardenbol, Vail, de Graciansky, Hardenbol, Jacquin and Vail1998) proposed a correlation of the Luchtbal Sands with the sequence between the Za1 and Za2 SBs; however, Vandenberghe et al. (Reference Vandenberghe, Van Simaeys, Steurbaut, Jagt and Felder2004, fig. 7) placed the Luchtbal Sands immediately above the Za2 SBs, which our study supports (Fig. 8). We assign the unconformity above the Luchtbal Sands to the Pia1 sequence boundary at 3.21 Ma. A major glacial phase within the warm Middle Pliocene is identified at MIS M2 (c. 3.30 Ma), where the δ18O variation of about 0.5‰ (Lisiecki & Raymo, Reference Lisiecki and Raymo2005) could correspond to a sudden drop of ±50 m (Fairbanks, Reference Fairbanks1999).
Consequently, the Oorderen–Kruisschans–Merksem sands sequence belongs to the sequence between the Pia1 (3.21 Ma) and Pia2 (2.76 Ma) SBs. This interpretation agrees with our suspicion that the HO of Invertocysta lacrymosa in the Oorderen Sands is suppressed due to shoaling of the environment. In the eastern North Atlantic, Invertocysta lacrymosa persists until 2.74 Ma (De Schepper & Head, Reference De Schepper and Head2008). In the DG and VB docks the Lillo Formation is separated from the overlying Quaternary deposits by a sharp, undulating contact accentuated by gravel of the Pia2 SB (2.76 Ma). At the onset of the Northern Hemisphere glaciation (around MIS G6, c. 2.72 Ma), a sea-level drop of around 90 m was estimated by Bartoli et al. (Reference Bartoli, Sarnthein, Weinelt, Erlenkeuser, Garbe-Schönberg and Lea2005); this drop heralded the end of marine sedimentation in northern Belgium.
Our interpretation differs from that of Vandenberghe et al. (Reference Vandenberghe, Van Simaeys, Steurbaut, Jagt and Felder2004, fig. 7; Fig. 8 herein), in that while they recognized a hiatus between the Luchtbal and Oorderen sands, they did not consider it a SB. They placed the Luchtbal and Oorderen sands in the same sequence (between Za2 and Pia1), and the Kruisschans Sands and Merksem Sands between the Pia1 and Pia2 boundaries. Thus, Vandenberghe et al. (Reference Vandenberghe, Van Simaeys, Steurbaut, Jagt and Felder2004) interpreted the gradual lithological change between the Oorderen and Kruisschans sands as a SB. Our age assignments do not conflict with this interpretation, but lithological and palaeoenvironmental evidence from the TK Dock suggests that the Oorderen–Kruisschans–Merksem sands sequence was deposited as part of a single cycle before 2.76 Ma (Pia1).
6. Southern North Sea Basin correlations
6.a. Grobbendonk
Regional geology and pollen analysis suggested a clayey unit at Grobbendonk in the Antwerp–Campine area of northern Belgium to be a possible correlative unit of the Kruisschans Sands (Vandenberghe et al. Reference Vandenberghe, Herman, Laga, Louwye, De Schepper, Vandenberghe, Bihncke and Konert2002). The unit was apparently deposited before the Gelasian, although dinoflagellate cyst evidence suggested a younger age, that is, Pre-Ludhamian (c. 2.6 Ma), according to Vandenberghe et al. (Reference Vandenberghe, Herman, Laga, Louwye, De Schepper, Vandenberghe, Bihncke and Konert2002). Pollen reflect a cold phase in the Piacenzian, which corresponds to a cooler climate indicated by molluscs and elasmobranch fish remains in the Kruisschans Sands (Marquet, Reference Marquet1993).
New information on dinoflagellate cyst stratigraphy (Louwye, Head & De Schepper, Reference Louwye, Head and De Schepper2004; De Schepper, Head & Louwye, Reference De Schepper, Head and Louwye2004; Kuhlmann, Reference Kuhlmann2004; Kuhlmann et al. Reference Kuhlmann, Langereis, Munsterman, van Leeuwen, Verreussel, Meulenkamp and Wong2006a,b; De Schepper & Head, Reference De Schepper and Head2008; this study) implies a Piacenzian age for the clayey unit at Grobbendonk, bringing the dinoflagellate cyst evidence more in keeping with the regional analysis of Vandenberghe et al. (Reference Vandenberghe, Herman, Laga, Louwye, De Schepper, Vandenberghe, Bihncke and Konert2002). The presence of Scaldecysta doelensis (as Stelladinium? sp.) suggests that this unit correlates with the top of the Oorderen Sands, the Kruisschans Sands or Merksem Sands (De Schepper, Head & Louwye, Reference De Schepper, Head and Louwye2004). In fact, the presence of Operculodinium? eirikianum eirikianum in the clayey unit at Grobbendonk implies a better correlation with the upper part of the Oorderen Sands than with the Kruisschans Sands where this subspecies is rare to absent (Louwye, Head & De Schepper, Reference Louwye, Head and De Schepper2004; this study, Fig. 3).
6.b. Eastern England and southern North Sea
Dinoflagellate cyst studies have contributed to the dating and correlation of Pliocene marine deposits within the southern North Sea Basin. Studies of the marine ‘Crag’ deposits of eastern England and the southern North Sea have been summarized by Head (Reference Head1998a), and records from northern Belgium are presented in Louwye, Head & De Schepper (Reference Louwye, Head and De Schepper2004), as well as the present study. It is now possible to re-evaluate correlations for the Zanclean and Piacenzian across the southern North Sea basin using new information on North Atlantic dinoflagellate cyst biostratigraphy (Head & Norris, Reference Head and Norris2003; S. De Schepper, unpub. Ph.D. thesis, Univ. Cambridge, 2006; De Schepper & Head, Reference De Schepper and Head2008; MJH, unpub. data).
There are no data published on dinoflagellate cysts from the marine Pliocene Oosterhout and Maassluis formations of The Netherlands, but from the northern Dutch sector of the southern North Sea, a series of offshore wells have been analysed for dinoflagellate cysts (Kuhlmann, Reference Kuhlmann2004; Kuhlmann et al. Reference Kuhlmann, Langereis, Munsterman, van Leeuwen, Verreussel, Meulenkamp and Wong2006a,b). These wells provide a record of relatively continuous deposition from the Zanclean through Gelasian. Although the Zanclean and Piacenzian sections are condensed, they record warm, outer-neritic, open-marine conditions in the Zanclean. Shallowing and some cooling are evidenced towards the end of the Piacenzian, but temperate forests persisted in the region until about 2.6 Ma. Of particular importance is the documentation of the change in the dinoflagellate cyst assemblages near the Gauss–Matuyama Chron boundary that corresponds to Northern Hemisphere cooling at around 2.6 Ma (Kuhlmann, Reference Kuhlmann2004; Kuhlmann et al. Reference Kuhlmann, Langereis, Munsterman, van Leeuwen, Verreussel, Meulenkamp and Wong2006a,b).
In eastern England, the marine Pliocene record is extremely fragmentary. The oldest deposit is the Coralline Crag Formation, which in the classic locality of Rockhall Wood has been subdivided into the Ramsholt and Sudbourne members (Head, Reference Head1997, Reference Head1998a). This formation is succeeded by the Walton Crag of the Red Crag Formation, with perhaps around 1 Ma separating their deposition. The Walton Crag has been dated at between 2.9 and 2.6 Ma (Head, Reference Head1998b), and all younger marine deposits in eastern England (including younger members of the Red Crag Formation) post-date Northern Hemisphere cooling (c. 2.6 Ma).
The Ramsholt Member of the Coralline Crag Formation has been tentatively assigned to the base of calcareous nannofossil zone NN16 at c. 3.7 Ma (Jenkins & Houghton, Reference Jenkins and Houghton1987), and the presence of the acritarch Leiosphaeridia rockhallensis appears to place the deposit between 4.4 and 3.8 Ma, which is the known range of this species in the North Atlantic (Head & Norris, Reference Head and Norris2003; De Schepper & Head, Reference De Schepper and Head2008). The presence of this species (not recorded in the Kattendijk Formation) and the apparent absence of species that characterize the Kattendijk Formation (Corrudinium devernaliae, Reticulatosphaera actinocoronata and Cyst type I of de Vernal & Mudie, Reference de Vernal, Mudie, Srivastava, Arthur and Clement1989) together indicate that the base of the Coralline Crag Formation of eastern England (4.4–3.8 Ma) is slightly younger than the Kattendijk Formation of Belgium (5.0–4.4 Ma, probably c. 4.7–4.4 Ma). A similar conclusion was reached by Louwye, Head & De Schepper (Reference Louwye, Head and De Schepper2004). Our results broadly agree with Cameron et al. (Reference Cameron, Crosby, Balson, Jeffery, Lott, Bulat and Harrison1992, fig. 90), who also placed the Coralline Crag Formation above the Kattendijk Formation.
The Sudbourne Member of the Coralline Crag Formation appears to lie unconformably on the Ramsholt Member, although similarities in the dinoflagellate cyst assemblages imply that any hiatus was not substantial (Head, Reference Head1997). In particular, the abundance of Operculodinium tegillatum in the Sudbourne Member indicates an age no younger than 3.71 Ma, based upon records from the North Atlantic (De Schepper & Head, Reference De Schepper and Head2008). The absence of Operculodinium tegillatum from the Luchtbal Sands and an overall ‘colder’ aspect to the dinoflagellate cyst flora indicate that the Luchtbal Sands and indeed the entire Lillo Formation are younger than the Sudbourne Member of the Coralline Crag Formation in eastern England. Our conclusion contrasts with observations from other fossil groups (benthic foraminifers, ostracods and molluscs: Doppert, Laga & De Meuter, Reference Doppert, Laga and De Meuter1979; Funnell, Reference Funnell1996 and references therein) that have been used to support a correlation between the Luchtbal Sands and the Coralline Crag Formation. Our results also disagree with the correlation scheme of Cameron et al. (Reference Cameron, Crosby, Balson, Jeffery, Lott, Bulat and Harrison1992, fig. 90), which places the base of the Lillo Formation below that of the Coralline Crag Formation.
In the past, pollen studies have been used as supporting evidence for a correlation between the Luchtbal Sands and the Coralline Crag Formation. Hodgson & Funnel (Reference Hodgson, Funnell and Hart1987) and Funnel (Reference Funnell1996) noted that the pollen from the Coralline Crag (Andrew & West, Reference Andrew and West1977) and Luchtbal Sands (Zagwijn & van Staalduinen, Reference Zagwijn and van Staalduinen1975; questionably based on Hacquaert, Reference Hacquaert1960, Reference Hacquaert1963) had both been assigned to the Brunsummian pollen stage of the Netherlands; however, the Brunsummian pollen stage spans the entire Zanclean (Zagwijn & Doppert, Reference Zagwijn and Doppert1978), affording no conclusive evidence of correlation.
The Walton Crag of eastern England possibly correlates with the Oorderen–Kruisschans–Merksem sands sequence of the Lillo Formation, based on their somewhat similar dinoflagellate cyst floras. In particular, both pre-date Northern Hemisphere cooling at c. 2.6 Ma and both contain the genus Barssidinium, which has a HO at 2.74 Ma in the eastern North Atlantic (De Schepper & Head, Reference De Schepper and Head2008), 2.6 Ma in the southern North Sea (Kuhlmann, Reference Kuhlmann2004; Kuhlmann et al. Reference Kuhlmann, Langereis, Munsterman, van Leeuwen, Verreussel, Meulenkamp and Wong2006a) and 2.55 Ma in the Mediterranean (Versteegh, Reference Versteegh1997; De Schepper & Head, Reference De Schepper and Head2008). The Walton Crag has been assigned by Head (Reference Head1998b) to the Reuverian B pollen substage, which is no younger than c. 2.6 Ma, and ostracode evidence points to a maximum age of 2.9 Ma (Wood et al. Reference Wood, Whatley, Cronin and Holtz1993). The Oorderen–Kruisschans–Merksem sands sequence pre-dates the sequence boundary Pia2 (2.76 Ma), according to our sequence stratigraphic interpretation. It is not possible to determine whether the Walton Crag occurs before or after the sequence boundary Pia2, due to the highly incomplete depositional record in eastern England. It should be noted that the Walton Crag deposits represent a fleeting interval of geological time, probably measured in decades (Head, Reference Head1998b).
Comparison of the Belgian and eastern England units (Fig. 5) emphasizes the incomplete nature of both successions but particularly the succession in eastern England. Variation in sedimentation or erosion regime could be responsible for the non-contemporaneous record of deposits in England and Belgium. It is possible that deposits equivalent to the Coralline Crag were deposited and then eroded in Belgium.
7. Conclusions
This report of the Tunnel-Canal Dock extends a study begun in 2001 using dinoflagellate cysts to elucidate the stratigraphy and palaeoenvironments of Pliocene deposits in Antwerp Harbour, northern Belgium (S. De Schepper, unpub. M.Sc. thesis, Univ. Liège, 2001). Dating has been facilitated by comparing dinoflagellate cyst events in Belgium with those in the North Atlantic (Head & Norris, Reference Head and Norris2003; De Schepper & Head, Reference De Schepper and Head2008; MJH, unpub. data), and by the application of sequence stratigraphy (Fig. 9). The SBs separating the units are likely caused by glacio-eustatic sea-level falls.
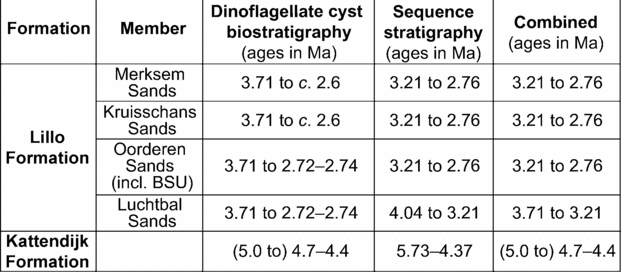
Age assessment of Pliocene marine lithostratigraphic units in Belgium based on dinoflagellate cysts and sequence stratigraphy. The base of the Kattendijk Formation was not observed in the present study.

The Kattendijk Formation has an age estimated between 5.0 and 4.7–4.4 Ma (Zanclean), and is probably within the range of c. 4.7–4.4 Ma (mid-Zancean), although the base was not observed. A warm-temperate climate with some open-marine influence is interpreted. The top of the Kattendijk Formation is assigned to sequence boundary Za1 (4.37 Ma).
The Luchtbal Sands represents the basal unit of the Lillo Formation and is bounded by unconformities. Its age is estimated biostratigraphically at between 3.71 and 2.7 Ma, and it is assigned to the sequence between SB Za2 (4.04 Ma) and Pia1 (3.21 Ma). It likely represents cooler conditions than the Kattendijk Formation, but with a persisting open-water influence. This unit was not recorded from the DG or VB docks (Louwye, Head & De Schepper, Reference Louwye, Head and De Schepper2004), but the lower part of the Basal Shelly Unit of the Oorderen Sands in the DG Dock now appears to contain reworking from the Luchtbal Sands.
The Oorderen, Kruisschans and Merksem sands of the Lillo Formation all belong to a single stratigraphic sequence bounded at the base by the Pia1 (3.21 Ma) SB and at the top by the Pia2 (2.76 Ma) SB. The base of the Oorderen Sands is no older than 3.71 Ma and its top no younger than 2.7 Ma, according to our biostratigraphy. The top of the Merksem Sands is older than c. 2.6 Ma, based on the palynological assemblages, but the entire succession must be older than 2.76 Ma if our sequence stratigraphic interpretation and the age of Pia2 are correct. This interpretation differs from that of Vandenberghe et al. (Reference Vandenberghe, Van Simaeys, Steurbaut, Jagt and Felder2004), who assigned the Luchtbal and Oorderen sands to the sequence bounded by Za2 and Pia1, and the Kruisschans and Merksem sands to the sequence between the Pia1 and Pia 2 SBs.
The Basal Shelly Unit of Louwye, Head & De Schepper (Reference Louwye, Head and De Schepper2004), which was reported below the base of the Oorderen Sands in the DG and VB Dock sections, is regarded here as a lag deposit at the base of the Oorderen Sands. It reflects the earliest stages of a transgression that led to the deposition of fine sand and shell debris that characterizes this member. The Oorderen Sands represents warm-temperate neritic conditions, with the exception of a single sample that indicates brief cooling. This member was probably deposited closer to shore than the Kattendijk Formation.
The overlying Kruisschans and Merksem sands represent a transition to restricted-marine conditions in a low-energy depositional environment. The dinoflagellate cyst assemblages suggest that this unit was deposited before the onset of the major glaciation, even though other fossil groups already indicate cooling (Marquet, Reference Marquet1993).
The Merksem Sands are not present in either the DG or VB docks (Louwye, Head & De Schepper, Reference Louwye, Head and De Schepper2004), but in the TK Dock some samples contain exceptionally high numbers of Heteraulacacysta sp. A of Costa & Downie (Reference Costa, Downie, Montadert, Roberts, De Charpal and Guennoc1979) and Waaslandia geminifera, suggesting a restricted marine palaeoenvironment. The Kruisschans and Merksem sands reflect inner neritic environments developed during a high stand, under conditions of diminishing sediment accommodation space.
In eastern England and in northern Belgium during Early and Middle Pliocene times, marine sediments were deposited on the margins of the southern North Sea Basin. It is unsurprising that the depositional record should be incomplete in both areas, although this is particularly true of eastern England. However, we conclude that the Coralline Crag Formation in eastern England (based on the classic locality of Rockhall Wood: Head, Reference Head1997) has no temporal marine equivalent in Belgium, being younger than the Kattendijk Formation and older than the Luchtbal Sands of the Lillo Formation. Our study, on biostratigraphic and palaeoenvironmental grounds, refutes earlier suggestions that the Coralline Crag Formation and Luchtbal Sands are correlative, although both seem to belong to the same stratigraphic sequence (bounded by Za 2 and Pia1). The succeeding Walton Crag in eastern England pre-dates 2.6 Ma and may be contemporaneous with part of the upper Lillo Formation in the TK Dock section or is slightly younger.
Acknowledgements
This contribution is based on the doctoral research of SDS, who is grateful to the Gates Cambridge Trust for the award of a Gates Cambridge Scholarship (University of Cambridge), and additional funding from the Dudley Stamp Memorial Trust (Royal Society, UK) and Philip Lake Fund (Department of Geography, University of Cambridge). SDS also appreciates funding from the Deutsche Forschungsgemeinschaft (International Graduate College ‘Proxies in Earth History’, EUROPROX, University of Bremen). MJH acknowledges support from a Natural Sciences and Engineering Research Council of Canada discovery grant. Piet Laga is thanked for useful discussions on Pliocene stratigraphy and for making the samples available. S. Vancauwenberghe kindly assisted with laboratory preparations. We are grateful to Piet Laga and Noel Vandenberghe for providing the samples and for discussions. Stefaan Van Simaeys and Jim Riding are thanked for their constructive reviews.