

Introduction
Earthquake and City Development
Three troughs – Sagami trough, Suruga trough, and Tokai trough – are composed at the area where the Philippine Sea Plate is submerging under the Eurasian Plate and North American Plate. The area is considered an earthquake nest. Tokai mega earthquake is predicted to occur by a 100 to 150 years cycle in this area. 1
Coastal cities in Aichi Prefecture were developed on alluvial formation. The City of Nagoya, capital of Aichi Prefecture, is one of these cities. When an earthquake at trough outbreaks, it is predicted that the City of Nagoya will be hit by lower 6 level vibration which makes humans difficult to keep standing. 2 At the western part of the city, liquefaction, which is a hazard of transportation, will occur. Then tsunami will invade low lands of coastal wards. Disaster-vulnerable people, including elderly people, children, disabled persons, and pregnant women, are expected to cope with difficult evacuation conditions.
Countermeasures by Aichi Prefectural Midwives Association
The Aichi Prefectural Midwives Association (APMA), with Aichi Association of Obstetricians and Gynecologists and other organizations, is developing support plans for evacuating pregnant women and their children. 3 The association has been preparing emergency delivery kits and is strengthening stockpiles of equipment for disaster. In case of disaster, the association is expected to mobilize its network together with obstetricians and gynecologists.
The APMA encourages its members to participate in trainings of disaster support nurse by Aichi Nursing Association. 4 The APMA has a system for a substitute workplace. Often midwives in large cities commute to their clinics and hospitals by public transportation. In case of large scale disaster outbreaks, it is difficult or even dangerous for member midwives to attend their regular workplaces. Member midwives of the APMA register their substitute workplaces near their residents. They are expected to rush to their substitute workplaces and participate in rescue and emergency health care work.
The APMA disseminates a guideline to support pregnant women and their children. 5 The guideline includes categories of diagnosis, foods and water supply, lactation, maintenance of body temperature, cleanliness, excretion, sleeping and resting, living in evacuation facilities, volunteer help, relief goods, children with high risk, caretaker of children, ages, and so forth.
Current System to Collect Information About Evacuating Pregnant Women
The Tohoku Medical Megabank Organization released a manual to support pregnant women in evacuation facilities. Reference Sugawara6,Reference Sugawara7 The initial 6 hours after outbreak of disaster is considered a phase for safety confirmation. Health care workers speak to evacuees or put up a notice on the bulletin board at the evacuation facility, asking pregnant women to contact health care workers. The health care workers are expected to collect information, such as name, age, emergency contact person, number of weeks of pregnancy, scheduled delivery date, medical institution consulting, conditions of disaster damages, and so forth. The information is collected and measures are taken, based on the information. All actions are taken after an outbreak of disaster by the current system.
Estimation of the Number of Pregnant Women and Their Locations
If detailed information is not provided, outline information of situations at the community or evacuation facilities will improve disaster preparedness. Information on situations is provided during the pre-disaster phase, and a simulation or map exercise becomes available. In another disaster science area, simulations, such as seismic intensity prediction, estimation of landslide warning area, tsunami height, and building resilience, are commonly used techniques. Disaster preparedness is developed according to the simulation. So, why not in a disaster medicine area?
To develop plans to support pregnant women and children, identifying locations of pregnant women in the community and their escape routes is needed. If information of the women is coordinated with a local health care delivery system, rescue and health support operations will be effective.
Nationwide Data on Pregnant Women
Local health care services of Japan are administered by 469 main health care centers and 120 branches. 8 Each prefecture has about 7 health care centers, although prefectures with larger areas and populations have more offices. Designated cities and major cities have their own health care centers. Each health care center divides its administrative district by health care workers and assigns their staffs by area. Often the health care workers cover multiple census community areas almost identical with the elementary school district.
If data of census community areas are acquired, local health care workers and dispatched rescue workers will be able to use the data. This study aims to predict the number of pregnant women in census community areas. Outcomes are expected to be used for evacuation simulation.
Methods
Data Processing
Machine Learning
Traditionally, a multiple regression analysis was used to estimate an outcome from multiple variables. However, outcomes of the regression analysis, which presuppose a normal distribution, were largely affected by outliers. A robust method, which is applicable to a non-normal distribution and resistive against the outliers, was explored. In this study, Cascade-Correlation Learning Architecture (CCLA), a type of supervised machine learning, Reference Fahlman and Lebiere9 was used for estimation.
Data Collection
Japan has a health care system for pregnant women. The pregnant women register at community health care centers as health care recipients and receive health care service allowances provided by the national government. The Ministry of Health, Labour and Welfare compiles yearly registration data of the pregnant women and reports annually. Data of pregnant women in 1737 local administrations from the 2017 Report of Regional Healthcare and Health Promotion Activities 10 were used in this study. The number of pregnancy registries at 1737 local administrations was used as supervisory signals.
Population data, of which the survey year coincides with pregnant women data, are available from the Basic Resident Register Database. 11 Female childbearing population data of 7 age groups – 15 to 19, 20 to 24, 25 to 29, 30 to 34, 35 to 39, 40 to 44, and 45 to 49 – were used as input signals.
The pregnancy registration data (supervisory signals) and population data of childbearing age groups (input signals) were matched according to local administration units: city, town, and village. One data set is composed of 1 supervisory signal (number of pregnant women) and 7 input signals (age grouped population data). There were 1737 data sets covering all the local administration units in Japan.
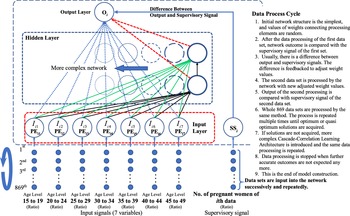
Between the input layer and output layer, there are multiple numbers of hidden layers that are composed of a multiple number of processing elements. The hidden layer structure of CCLA is the simplest at the beginning. Gradually, the CCLA adds processing elements in hidden layers so that the computer will be able to perform more precise calculations. If calculations do not improve after a certain time of calculations, the computer adds another processing element automatically. Calculated outputs of 1737 sets of input signals coincide with 1737 supervisory signals in an ideal state.
The machine learning software is designed to be sensitive and precise for probability data valued from 0.0 to 1.0. The data (supervisory signals and input signals) were divided by the total number of childbearing-age women (total of 7 input signals). The raw data were converted to this value range and processed by machine learning software (using Neural Ware, Inc., Predict 3.31). Figure 1 shows a data set and processing structure.
Data processing by Cascade-Correlation Learning Architecture (CCLA).

Validity of the Model
Model Construction
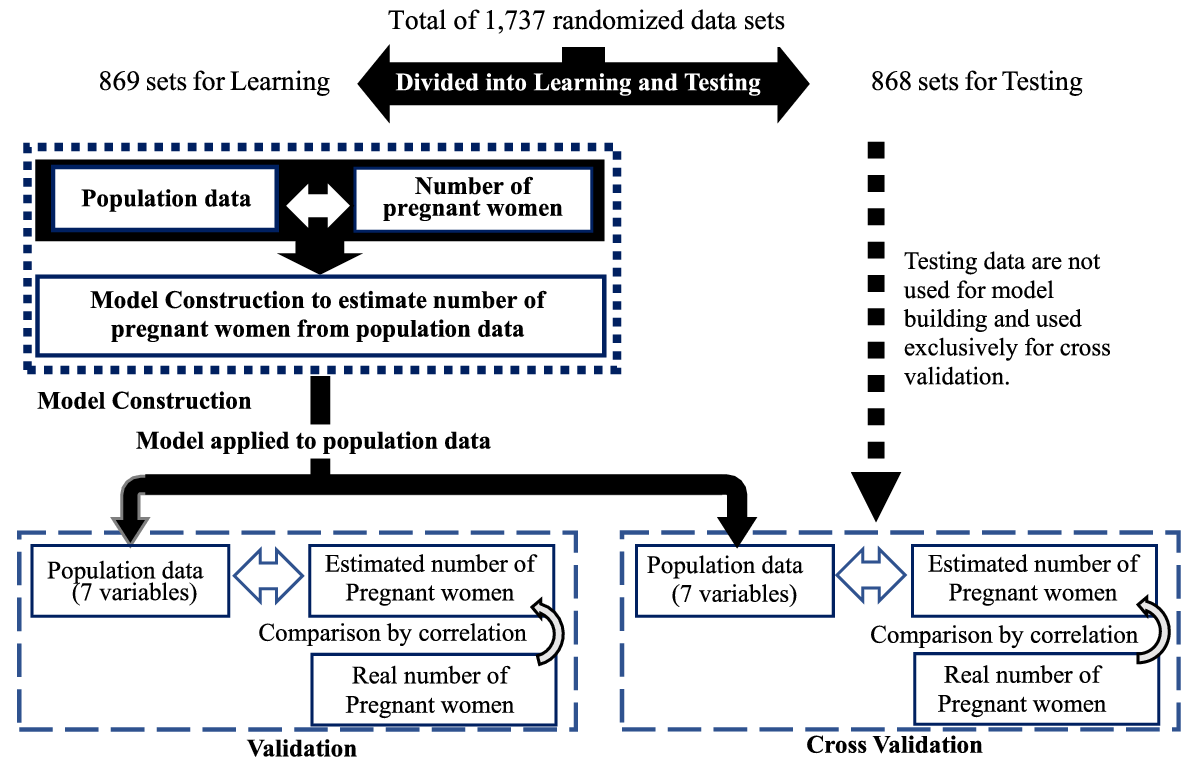
All 1737 data were randomized to prevent arbitrary selection of the learning process data and testing process data. After randomization, half (869) of the data sets were allocated for the learning process, and the rest (868) were reserved for the testing process. The machine learning model was constructed from the learning process data only. CCLA automatically selects the best architecture for given data sets.
Validation
After construction of the machine learning model, validation was carried out by applying the developed machine learning model to the learning process data. The estimated number of pregnant women by the machine learning model was compared with the actual number of pregnant women (supervisory signal) by the correlation coefficient.
Cross Validation
Cross validation was also carried out by applying the same machine learning model to the testing process data, which were reserved unprocessed during the learning process. The estimated number of pregnant women by the machine learning model was compared with the actual number of pregnant women (supervisory signal) by the correlation coefficient. Figure 2 shows the whole machine learning process, including model construction, validation, and cross validation.
Overview of machine learning model.

Repeatability Problem
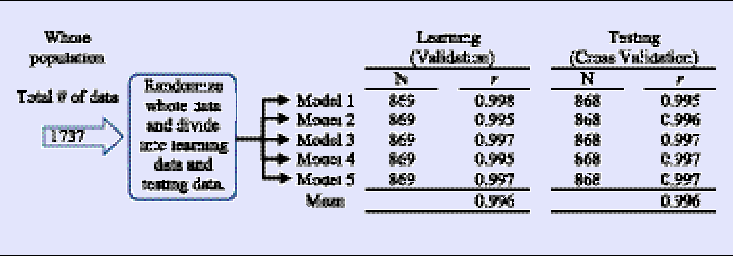
Machine learning has a problem called repeatability. The machine learning software uses a random number generator and Bayesian updating. There is a possibility to output different outcomes from the same population data sets, known as the repeatability problem. It is a common practice to carry out machine learning analyses multiple times, applying the same processing method to different sample data from the same population. In this study, 5 models were constructed (data processing is explained in Figure 2). Each time, data were randomized and separated as learning data and testing data. Table 1 shows correlation coefficients between actual data and machine learning estimations.
Correlations between actual data (supervisory signal) and estimated data by machine learning

There were minor decreases of correlation coefficient in cross validation, but all of the correlation coefficients were within valid range. It was appraised that models were appropriate for practical application.
Sensitivity Analysis
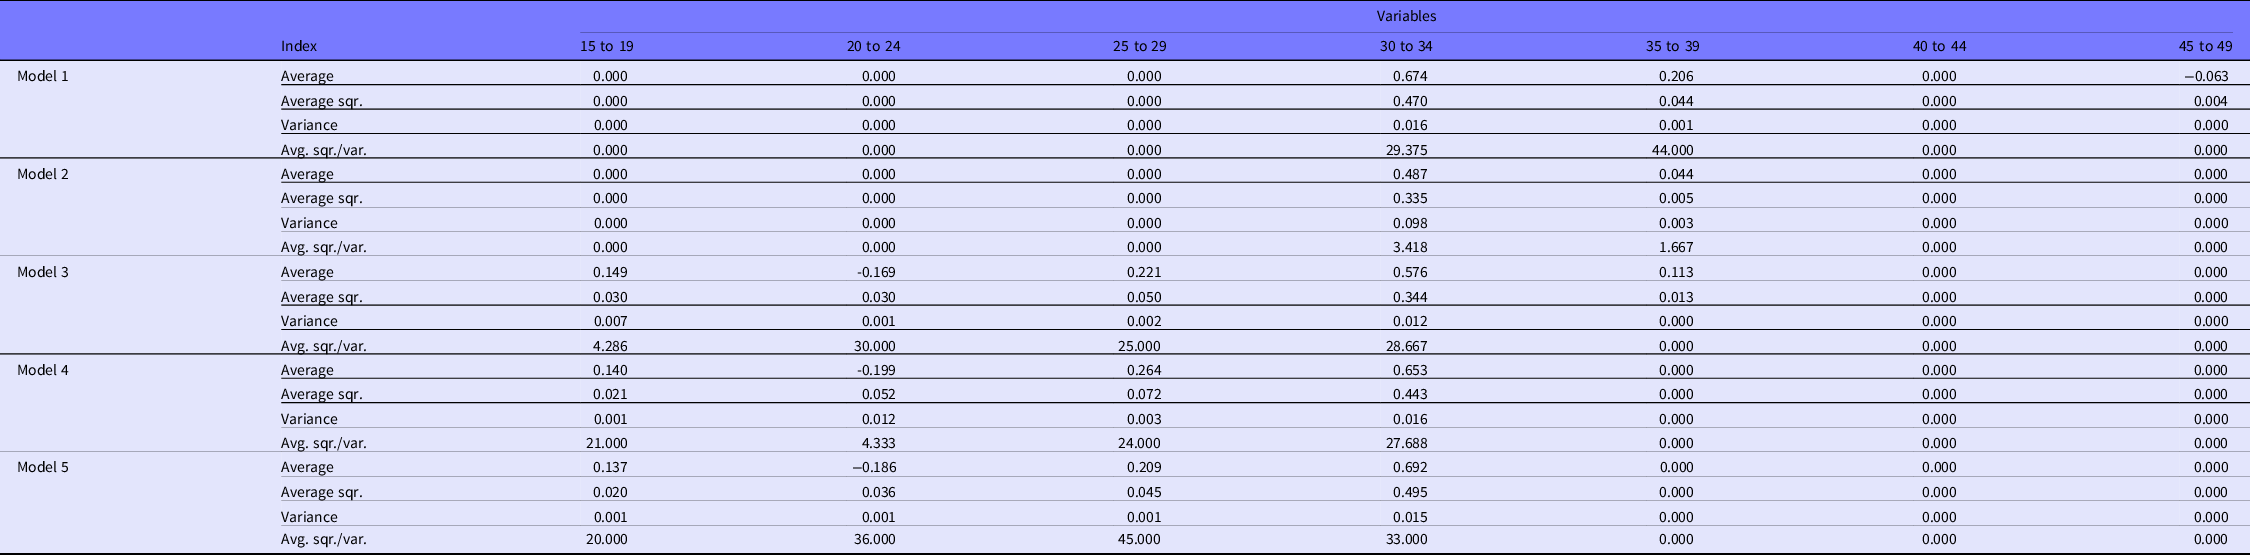
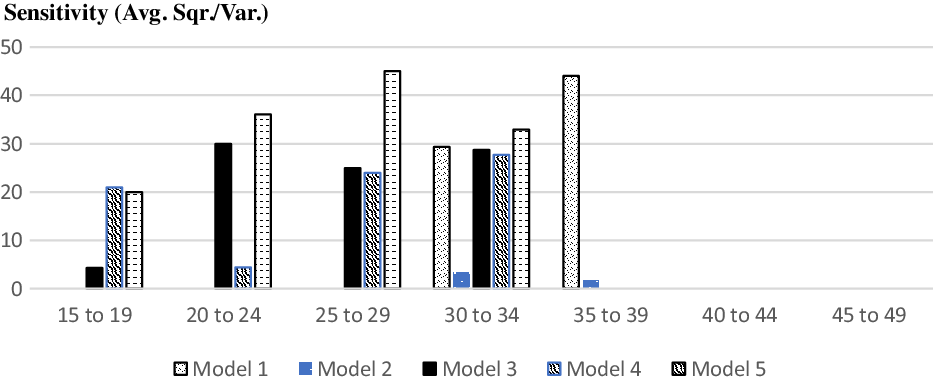
Sensitivity analysis refers to an approach aimed at identifying the most influential parameters for a given output of a mathematical computer model that is often based on big data. 12 Unlike multiple regression, the response surface of neural network is curved, and the slope is not constant. In order to evaluate distribution of the response surface, 3 indexes of the rate of change – average, average square-root, and variance – were used. Positive and negative influences are evaluated by the average rate of change. Intensity of influence is evaluated by the average square-root. Scatter of intensity is evaluated by the variance. In order to compare the sensitivity of variables, the average square-root/variance was calculated (by Neural Ware, Inc., Predict 3.31). Table 2 shows the sensitivity values.
Results of the sensitivity analysis

Figure 3 shows standardized sensitivity by variables. It is interpreted that data of age groups 15 to 19, 20 to 24, 25 to 29, 30 to 34, and 35 to 39 influence models, but influences of age groups 40 to 44 and 45 to 49 are minimal.
Comparison of standardized sensitivity of variables.

Results
Census Community Data
The census community areas often coincide with cultural, economic, educational, or social activity range of residents in Japan. Population data, economic activity data, and so forth, are compiled and released for public use by census community area. However, data of pregnancy are not included in the released census data due to protection of privacy. There is no way to obtain pregnancy data directly.
Although pregnancy data by census community area do not exist, population data of census community area are available. Women’s 5-year age interval population data from age range levels 15–19 to 45–49 of the 2015 National Census are available from the Portal Site of Official Statistics of Japan. 11 The machine learning model was applied to the 2015 national census data.
Application of Developed Machine Learning Model
Ratio was acquired by dividing age and raw population data by the total number of childbearing-age women. The ratio was used for machine learning data processing.
In order to cope with the repeatability problem, the developed 5 models were applied to the 2015 census population data of 13 713 census community areas used in Aichi Prefecture. 13 After data processing by machine learning, outcomes were multiplied by the total number of childbearing-age women, and the estimated number of pregnant women in census community area was acquired. The final outcome is a mean of outcomes of 5 machine learning data processing.
Validity Appraisal of Estimated Data
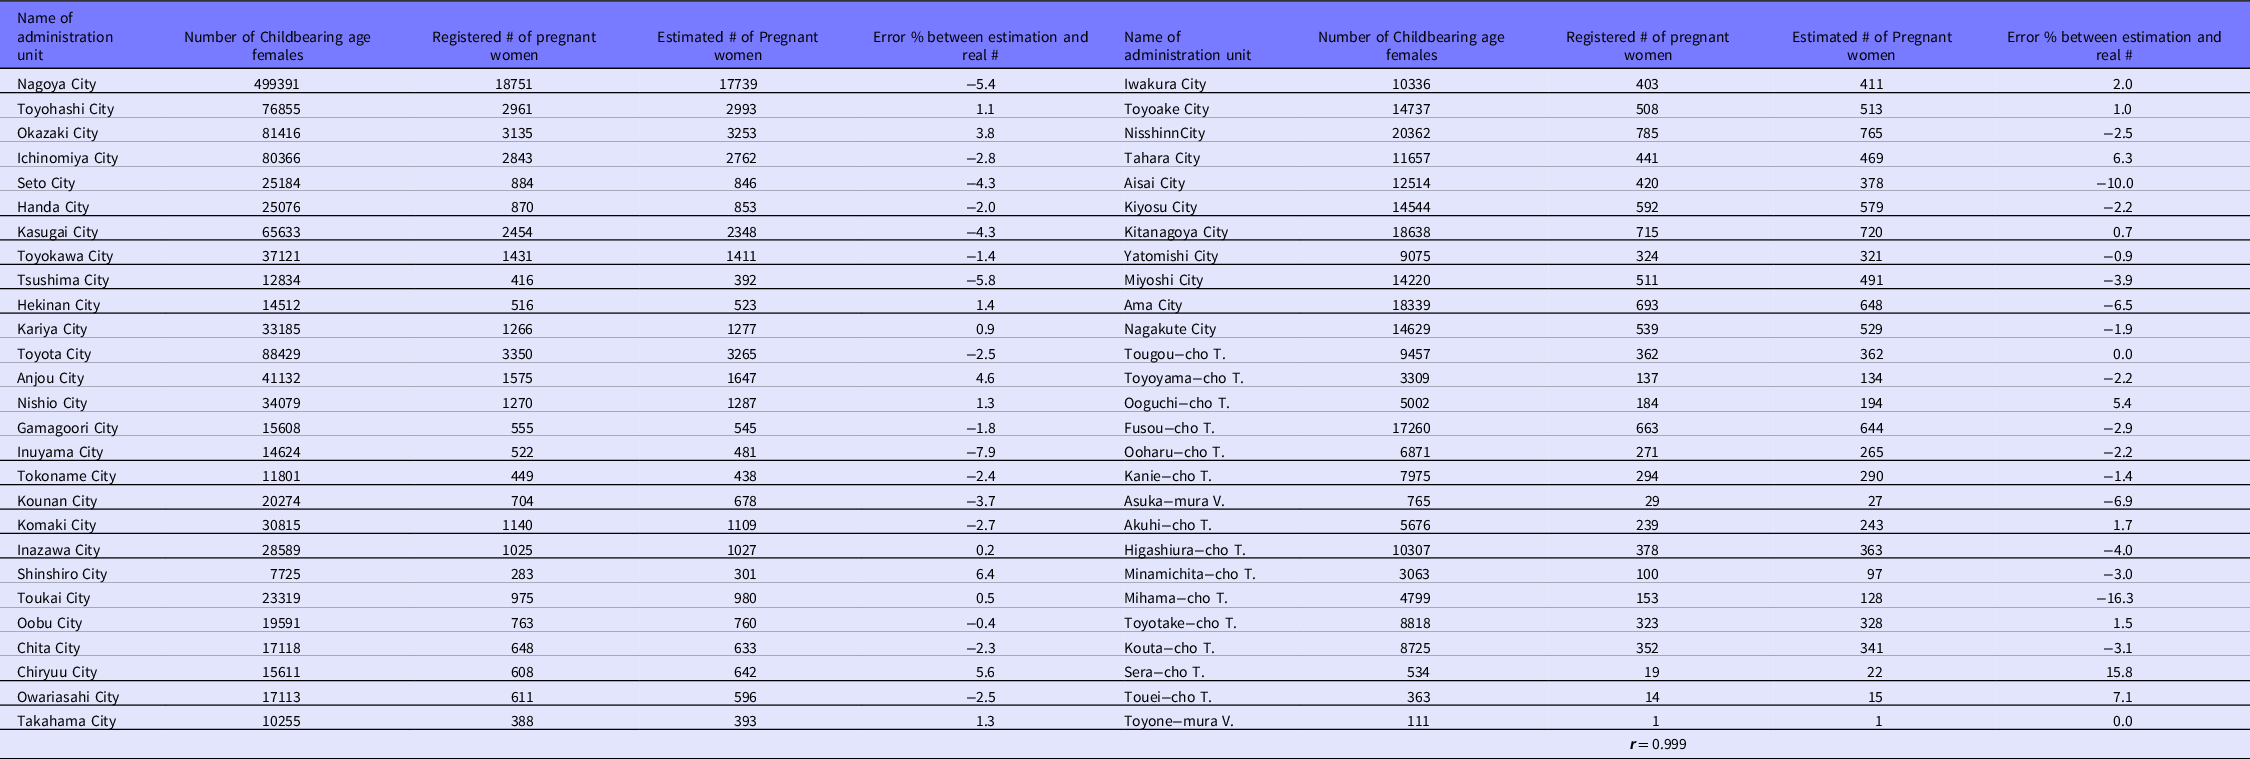
The validity of the machine learning model itself was appraised (see Table 2). However, no actual data of the number of pregnant women of small community areas, which can be used for a validation study, are available. Only data on the number of pregnant women of 2015 were available in the Report of Regional Health and Health Promotion Operations, 14 which discloses about 54 cities, towns, and villages in Aichi Prefecture. A substitute method was used.
An estimated number of pregnant women of 13 713 census community areas by this machine learning was summed by cities, towns, or villages, as shown in Table 3. Actual 2015 data on the number of Registered Pregnancy at City, Town, and Village in Aichi Prefecture were disclosed in the Report of Regional Health and Health Promotion Operations. 14 Errors ([sum of estimation – actual data]/actual data) were calculated. It was observed that data of several small towns should be interpreted cautiously but most data are usable. The correlation coefficient of the 2015 data of registered pregnant women (actual data) and sum of the estimated number of pregnant women by administration unit (sum of estimated data by administration unit) were 0.999. It is observed that estimation by machine learning was successful.
Comparison of 2015 data of registered pregnant women at administration units and sum of the estimated number of pregnant women in census community by machine learning

Estimated Results
Geographic Information Systems (GIS) Presentation
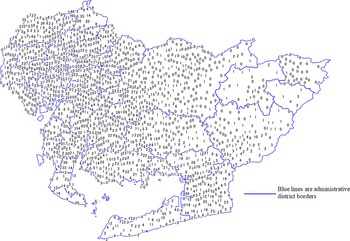
The estimated number of pregnant women were presented at gravity point of polygon representing small community areas 15 (Figure 4). Geographic information systems (GIS) map data of the Statistics Bureau of Japan 16 were used. Unfortunately, all 13 713 data are not printed accurately on a map.
Estimated number of pregnant women in census survey areas of Aichi Prefecture.

If neighboring data are geographically too close and presented data overlap on a map, either data are crossed out, although hidden fonts appear if the map is enlarged in a computer display. Accurate data are presented if the displayed map is enlarged, but it is not able to display large amounts of data on a paper.
When an administrative unit has outlands such as an island or detached territory belonging to the administrative unit, attributes of the administrative unit are presented in all the polygons belonging to the unit. For presentation, polygon data and attribute data were separated into 2 clone shapefiles: 1 for polygon presentation and the other for attribute data presentation. The color configuration of attribute data layers is transparent so that the shape of polygons will be invisible and only attribute data will be presented. Outlands were discarded from the attribute data file. Thus, duplicated presentation of attribute data was prevented.
Estimated numbers are presented at the centroid of the census survey area polygon. When locations of 2 data are too close, one of the data covers the other, and covered data are eliminated automatically from the GIS display. If the map is magnified and the distance between 2 data becomes large enough over the map, 2 data are presented simultaneously.
Discussion
Weakness of Logistics of Health Care Workers
Situations of large-scale disasters are like a battlefield. Large numbers of victims with different clinical conditions are distributed in devastated areas. Health care workers are ushered into the areas. The mission of midwives dispatched to devastated areas is to connect with the pregnant women, carry out triage, provide treatment, transport pregnant women to safe facilities according to triage, hand over the women to treatment teams, and, most importantly, come back to facilities safely.
However, unlike military experts, health care workers are not accustomed to looking around the whole front, although the health care workers have skills to treat individual victims. The health care workers are not always trained to cope with conditions of devastated areas such as collapsed houses, road waved by liquefaction, possible fire, evacuating victims, and other plausible risks associated with health care activities. Logistic supports for health care workers are not observed enough.
Needs on Human Damage Data
Simulation is a commonly used technique among disaster scientists. Sophisticated mathematical simulation models have been developed, and predictions of seismic intensities, liquefaction, and tsunami in relation to fault belts and troughs have been carried out. Disaster-related data, such as predicted flood area and predicted area of landslide, are now available through GIS Internet sites. 17 Damages of roads, bridges, buildings, and other hardware have been predicted and repaired or reinforced. Simulation in engineering is improving the resilience of social resources.
For health care workers, predictions of human damages are important. So far, human damage predictions of large areas, such as prefectures and regions, have been made according to the past disasters data. The predictions are useful in developing administrative plans, such as national or prefectural budget assembly or rescue operations. However, data with such large grain size are not usable in determining actual rescue operations by health care workers.
Needs of Simulation for Medical Rescue Teams
Health care rescue teams are dispatched by a small team with emergency equipment and supplies often by ambulance cars or 4WD automobiles. They are headed to evacuation points where victims are gathering from neighboring community. For the rescue teams, local data are more important than statistical data of the whole city. If profiles of the communities are known in advance, the rescue teams will be able to carry emergency equipment and supplies with high priority. For midwives, the number of pregnant women evacuating to a safe building is more important than statistical data of pregnant women in the whole city.
The first couple of days after a disaster outbreak, local health care workers who are often disaster victims themselves are challenged with coping with overwhelming tasks in complex and severe situations. They have to make judgments under marginal conditions and take actions. Authors believe advanced knowledge about population data of a small community will mitigate burdens of the workers.
Hattori et al. Reference Hattori, Miyagawa and Hattori18 applied data of this study to estimate pregnant women possibly left behind in tsunami predicted areas of Nagoya City. The estimated data of pregnant women were combined with road centerline data Reference Hattori, Hattori and Taneichi19 in simulating evacuation and rescue plans of the women.
Developed multiple operation plans based on simulation in ordinary times are expected to improve preparedness of health care workers who participate rescue operations. At the least, the workers do not start their mission from confusion of disaster with zero information.
Machine Learning as Simulation
A half century had passed since the first artificial intelligence (AI) boom was exemplified by the first 1969 edition of Perceptrons. Reference Minsky and Papert20 The second boom came around the mid-80s. Parallel distribution processing and backpropagation algorithm are the key terms representing this boom. Reference Sakurai and Ootake21 From the second boom, prices of computers and software began to decrease rapidly. Use of AI spread among non-engineering researchers who had no prior access to high spec computers.
Today is the middle of the third boom. Combined techniques of big data and machine learning are used routinely in many fields. As known from this article, the combination produces very high research performance. The correlation coefficient between machine learning estimation and actual data is near perfect: 0.99.
Machine Learning in Disaster Management
Although AI approaches, including machine learning, are overlooked in the disaster medicine field, the machine learning has already been a reliable tool in the disaster management field. Castro developed rescue agent simulation by machine learning. 22 Hashemeipour et al. combined agent-based simulation, GIS, machine learning, optimization algorithms, and developed a decision-support system for disaster coordination. Reference Hashemeipour, Studan and Dever23 Nabian and Meidani carried out simulation of transportation network after earthquake disaster. Reference Nabian and Meidani24 Chang et al. estimated flood inundation by using a self-organizing map, which is non-supervised machine learning. Reference Chang, Amin, Yang and Chang25 These works in disaster management have been mainly performed by engineers.
Methodological Diremption
Improvement of AI methodologies has been accelerated these days. A group that communes with AI technologies introduces a new method after another. In contrast with the AI commune group, another group persists using traditional methods and does not look at outcomes of a new method. Methodological diremption between these 2 groups is expanding.
In order to carry out AI methods, basic mathematical training was necessary before. Mathematicians and engineers are pioneering new methods. Techniques are getting more and more sophisticated, but there is an effort to improve interfaces of machine learning. Current software is operated through an easy-to-use interface. If principles of data processing are understood, AI is not difficult to operate. Outcomes of AI stand out. Classical statistics is no match for AI.
Collaboration by 2 Groups
Disaster can occur anytime. A good solution is a collaboration between the 2 groups: AI methodologists and disaster medicine specialists.
Machine learning is a high technology method, but it has a very human side. Supervisory signals are provided by humans who know well about actual situations. The best supervisory machine learning model is developed in accordance with supervisory signals collected by qualified clinicians. A non-supervisory machine learning model needs data sets collected also by qualified clinicians. Even if the best mathematicians and engineers introduce a sophisticated model, it is difficult to create state-of-the-art outcomes without collaborations with clinicians. The best AI outcomes are produced by clinicians and methodologists snuggling up to each other.
We are currently developing simulation models on other diseases and disabilities. Ouchi and Hattori applied machine learning estimation of health care needs Reference Ouchi and Hattori26 : “He who moves not forward, goes backward.”
Acknowledgments
We express our sincere appreciation to Janice Springer of the American Red Cross and Karen Monsen of the University of Minnesota, School of Nursing. They encouraged us to pursue our research from the early days of research while appraising important techniques of this approach.
Last, but not least, I (Dr Kanetoshi Hattori) would like to express my heartfelt appreciation to my wife, Ritsuko Hattori. I was in the hospital when the final collaboration. She delivered the draft and other materials to the hospital. I would not be able to complete this writing without her devoted support. (Please note, coauthor Dr Ritsuko Hattori has the same name as my wife.)
Funding Statement
Japan Society for the Promotion of Science, Grants-in-Aid for Scientific Research No. 16K00400 supported the development of this manuscript.
Conflict(s) of Interest
The authors declare no potential conflicts of interest with respect to the research, authorship, and/or publication of this paper.