Implications
The study presents the trace element status of organic dairy cattle in northern Spain and their relationship with the trace element concentrations in the diets. Two main sources of trace and toxic elements were established: concentrate feed as the main source of trace elements included in the mineral supplements and ingestion of soil during grazing as the source of the rest of trace and toxic elements.
Introduction
Organic farming promotes the use of local resources and limits the application of chemicals, including inorganic mineral supplements (Council Regulation (EC), 2007). In organic farming, animal nutrition is therefore highly dependent on local geographical conditions and mineral deficiencies may occur in certain areas due to the low availability of some trace elements. For example, the distance to the sea is an important factor in the concentration of iodine (I), and in lower extent selenium (Se) (Flachowsky et al., Reference Flachowsky, Franke, Meyer, Leiterer and Schöne2014). Cattle mineral status is associated with the intensity of grazing, which involves ingestion of soil either directly or through soil-contaminated forage (López-Alonso, Reference Lopez-Alonso2012). Ingestion of soil may thus represent an important source of essential trace elements for livestock (Thornton and Abrahams, Reference Thornton and Abrahams1983), but may also represent an important source of exposure to toxic metals in long-term exposed areas to traffic, industry or agricultural practices (Miranda et al., Reference Miranda, López-Alonso, Castillo, Hernández and Benedito2005). This source is highly dependent on the local geological conditions, and the nutritional status of grazing cattle varies throughout the year. The availability of forage may be very low during some months of the year, depending on weather conditions, leading to a high dependance on preserved forage or concentrate feed. Thus, the trace element contents of forage also varies throughout the year (Kabata-Pendias, Reference Kabata-Pendias2011).
Results of previous studies in beef cattle in northern Spain (Blanco-Penedo et al., Reference Blanco-Penedo, Benedito, Shore, Miranda, García-Vaquero and López-Alonso2009b) indicate severe deficiencies of some trace elements (particularly copper (Cu) and Se) in organic farming systems relative to conventional (intensively) managed systems. This is due to a low level of concentrate supplementation and a high level of grazing in the organic systems. Dairy cattle require high levels of trace elements for milk production, and deficiencies in these elements are therefore more prevalent in organic dairy farming (Blair, Reference Blair2011). Moreover, the lack of trace element supply will affect the health of the cattle (Blair, Reference Blair2011) and also lead to production of milk containing low levels of minerals. Human health may also be affected and for example I deficiency in humans can affect foetal development and the neurological development of children. This has led to concern about the typically low I content of organic milk in Europe (Bath and Rayman, Reference Bath and Rayman2016), including northern Spain (Rey-Crespo et al., Reference Rey-Crespo, Miranda and López-Alonso2013). Studying the mineral status of cattle as well as the sources of minerals from different types of feed, in both organic and conventional farming, is therefore of great interest because of the important health- and production-related implications.
The objective of the present study was to evaluate trace element status of organic dairy herds in northern Spain relative to that of intensively reared herds. Detailed analysis of serum and feed was conducted to know the different sources of trace elements in relation to different feeding pattern. Exposure of cattle to toxic metals was also evaluated in view of the importance of limiting such exposure through the food.
Material and methods
All experiments performed followed Spanish standards for the protection of animals used for scientific purposes. The procedures applied were supervised and approved by the Bioethics Committee of the University of Santiago de Compostela (Spain).
Sample collection and processing
The data used in this study were obtained as part of a research project (Spanish Government Ref. AGL 2010-21026) to compare the nutritional status of organically and conventionally reared dairy cattle. For this study, samples were collected from 22 organic and 10 conventional dairy farms. At least two visits (winter/summer) were made to each farm between November 2011 and June 2012 to obtain blood and feed samples for trace element analysis. Blood samples were collected (10 ml from the coccygeal vein) after the morning milking from all cows in the peripartum period (from 2 weeks before the expected calving date until the peak lactation expected at 90 days). A total of 522 blood samples were collected, 341 from organic cattle (145 in winter and 196 in summer) and 181 from conventional cattle (77 in winter and 104 in summer).
Serum was obtained by centrifuging the blood samples at 3000 g for 15 min. Triplicate subsamples were stored at −20°C. For trace mineral analysis (except I), serum samples were mineralized by a wet acid heat-assisted digestion procedure. Briefly, 2 ml of serum were added to 2.5 ml of 69% nitric acid for cold digestion (during 1 h). After this, 0.5 ml of hydrogen peroxide 33% w/v was added and sample solutions were placed in a thermostatic block at 120°C for 60 min to complete the digestion. The digested samples were diluted to 10 ml with Milli-Q ultrapure water. For determination of total I, samples were processed by a high temperature alkaline extraction procedure (EN, 2007) with a mixture of tetramethylammonium hydroxide 25% (w/v) in water.
In addition, exhaustive dietary information was obtained from each of the farms, including the types and quantities of the different feedstuffs consumed (Supplementary Material Table S1). Feed samples (duplicate samples of each type of feed, including alfalfa, pasture, hay, concentrate, grass silage and corn silage) from organic (128) and conventional (36) farms were analysed. The feed samples were oven-dried (60°C, 24 h), ground and sieved (0.5 mm diameter). For trace mineral analysis (except I), 0.5 g subsamples were acid digested in 8 ml of 69% nitric acid and 2 ml of 33% w/v hydrogen peroxide in a microwave digestion system (Ethos Plus; Milestone, Sorisole, Italy). Digested samples were diluted to 15 ml with Milli-Q ultrapure water. For determination of total I, the same high temperature alkaline extraction procedure (EN, 2007) used for the serum samples was applied.
Analytical methods
Fourteen elements were determined by inductively coupled plasma mass spectrometry analysis of serum and feed samples: arsenic (As), cadmium (Cd), cobalt (Co), chromium (Cr), Cu, I, iron (Fe), lead (Pb), manganese (Mn), mercury (Hg), molybdenum (Mo), nickel (Ni), Se and zinc (Zn). All samples were analysed in duplicate. Analytical quality control was applied throughout the study (Supplementary Material Table S2). Blank samples were processed along with the other samples, and the readings obtained were subtracted from the sample readings to produce the final values. The limits of quantification (LQ) were calculated as three times the standard deviation of the reagent blanks and were based on the mean sample volume/weight analysed and the final dilution. All trace elements were above LQ in serum and feed samples, with the exception of Hg in all feed materials. Analytical recovery of the certified reference materials (CRMs) was determined at the same time as the samples were processed. The level of consistency between the measured and certified values was acceptable. The CRMs were not certified for I and Pb (serum), and analytical recoveries were therefore determined using spiked samples (n=10): mean recoveries were 94% and 87%, respectively.
Statistical and chemometric analysis
The normality of data was checked using the Kolmogorov–Smirnov test. The data were not normally distributed and were therefore log-transformed before analysis. The results are presented as geometric means.
Dietary trace element intakes were calculated for each farm and season (winter/summer) considering the trace element concentrations and the proportion of each individual feed material in the diet (Supplementary Material Table S1). Pasture intake was estimated as the amount required to complete the dry matter intake (DMI). Dry matter intake was estimated using our own calculations derived from analysis of the Spanish organic (n=22) (Milk (l)=1.709×DMI (kg)−10.391; R 2=0.939, P<0.001) and conventional (n=115) (Milk (l)=1.722×DMI (kg)−10.743; R 2=0.951, P<0.001) dairy cattle population.
Differences in trace elements status and toxic metal exposure in organic and conventional dairy cattle were established using mixed models, in which the variable ‘herd’ was included as a random factor and ‘type of farming’ and ‘season’ were considered fixed factors. Differences in dietary trace element concentration in organic dairy herds were evaluated by ANOVA, with ‘type of farm’ and ‘season’ as fixed main factors. Associations between trace element concentrations in the total diet and serum (using the mean serum value for each farm in each season, n=64) were calculated using the Pearson correlation coefficient. Statistical analyses were performed with IBM SPSS for Windows v.21.
Multivariate unsupervised display chemometric techniques, that is principal component analysis (PCA) (Jolliffe, Reference Jolliffe1986) and hierarchical cluster analysis (HCA) (Massart and Kaufman, Reference Massart and Kaufman1983), were used to explore the relationships between samples and variables and to reveal the latent structure of the information contained in the feed data matrix (X164×13). In order to overcome the influence of the different sizes of variables, the original variables were autoscaled by subtracting the mean value of the variable and dividing the result by the standard deviation to produce new variables with zero mean and unit variance. All chemometric techniques were implemented using Statgraphics Centurion XVI V.16.1.15.
Results and discussion
Trace element concentrations in feed
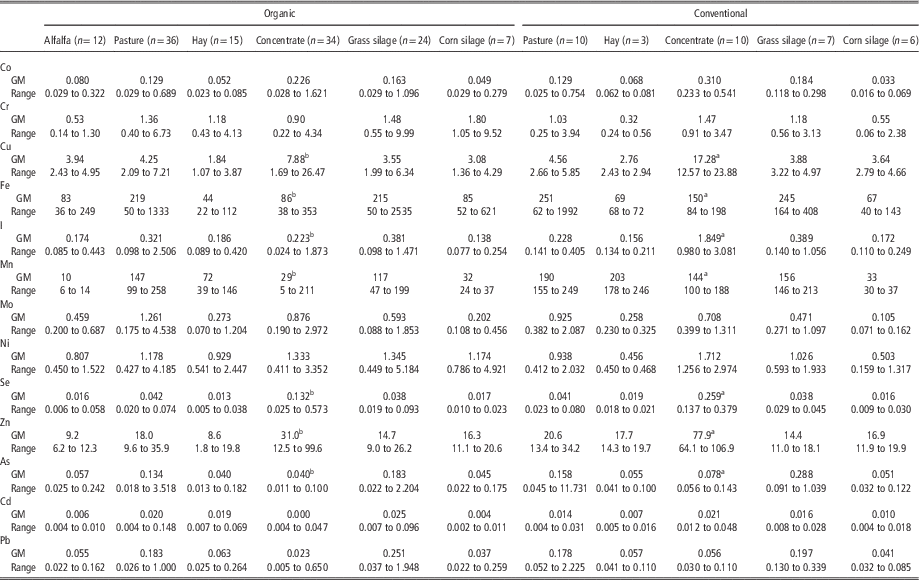
Essential and toxic trace element concentrations in the different feed materials are summarized in Table 1. Although for practical feeding the requirements for trace elements are oriented to the total intake of trace elements in the ration, the evaluation of trace element concentration of each feed material is essential to understand the sources of trace elements in organic dairy cattle. Overall, and considering the mean values, concentrate feed contained the highest concentrations (up to one order of magnitude higher than the other feeds) of the essential trace elements routinely added to the mineral supplement and that are present at very low levels in forage (Co, Cu, I, Se and Zn). For the other essential trace elements added to the mineral supplement that are present at high concentrations in forage (Fe and Mn), the non-supplemented essential trace elements (Cr, Ni, Mo) and the toxic elements (As, Cd and Pb), the mineral content of the concentrate feed was similar or lower than in the other feedstuffs. Trace element concentrations were lower in pasture and silage, and the concentrations of Cu, Se and I in alfalfa, hay and corn silage were usually below the nutritional requirements (I: 0.5 mg/kg dry matter (DM); Cu: 10 mg/kg DM; Se: 0.10 mg/kg DM; National Research Council (NRC), 2001). No significant differences between feed materials produced in organic and conventional systems were analysed, except in concentrate feed for the trace element added as mineral supplements, which were always lower in the organic systems (Table 1). Moreover, there were no seasonal variations in any feed material (P>0.05, data not shown), except pasture. This was expected as all of these types of feed (hay, silage, corn silage, concentrate and alfalfa) are produced at a particular time of the year and are preserved and stored. Regarding pasture, lower concentrations of all trace elements (except Mo) were observed in the winter samples, although differences were only significant for Cd (0.0174 v. 0.0693 mg/kg DM), Cr (1.15 v. 5.88 mg/kg DM), Cu (4.13 v. 5.71 mg/kg DM), Ni (1.03 v. 3.71 mg/kg DM) and Se (0.0391 v. 0.0632 mg/kg DM for winter and summer sampling, respectively). Seasonal variations in forage trace element concentrations largely depend on the geographical and climate conditions. For example, the Se content of plants is lower in areas with high rainfall and its uptake by plants is largely determined by the temperature (higher rate at temperatures >20°C), whereas Fe concentration in pasture shows seasonal fluctuations, with peaks in spring and autumn (Kabata-Pendias, Reference Kabata-Pendias2011). Trace element concentrations are also influenced by the stage of plant development: higher contents of Fe, Zn and Cu were detected in alfalfa leaves in the first stage of plant development (Markovic et al., Reference Markovic, Štrbanovi, Cvetkovi, Andjelkovic and Živkovi2009), and concentrations of Mo and Zn are also known to vary with plant development stage (Kabata-Pendias, Reference Kabata-Pendias2011). Preservation of forage also affects the trace element content, and for example the process of fermentation of silage appears to increase the Fe bioavailability (Hansen and Spears, Reference Hansen and Spears2009). In addition to the variation in the trace element content of plants, the degree to which the plants are contaminated with soil can also affect the trace element concentrations, particularly in elements present at much higher concentrations in soil than in plants. Fresh forage and silage are more likely to be contaminated with soil than hay. These factors make that the bioavailability of trace minerals in the plants is can be veru variable, and consequently nutritional requeriments difficult to calculate.
Essential trace and toxic element concentrations in feed materials (mg/kg DM) of organic (n=22) and conventional (n=10) farms in North Spain

Different superscript letters (a>b) within the same feed material indicate statistically significant differences between organic and conventional.
Detailed analysis of these data (Table 1, Supplementary Material Figure S1) also shows large variations in the trace element concentrations within each type of feed, particularly (1) in organic concentrate feed for elements added as mineral supplements (coefficient of variation up to 110% for I) and (2) in forage and silage samples for the elements present at higher concentrations in soil than in forage (coefficients of variation up to 150% and 180% for Fe and Pb, respectively). The trace element concentrations of organic concentrates that do not contain mineral supplements are similar to those of other feed materials. For pasture and grass-silage, most trace element concentrations are rather variable: lower values are usually reported in the literature (Kabata-Pendias, Reference Kabata-Pendias2011) and higher values possibly indicate soil contamination. The relative contribution of soil contamination seems to be higher for trace elements such as Fe and I, which were present in soil at concentrations 2 and 3 orders of magnitude higher than in the feed materials, and very low for elements such as Se, which are present at concentrations of the same order of magnitude (Healy, Reference Healy1973). The distribution of the other trace elements analysed within the different types of feed followed the same pattern: (1) for those elements added to the mineral supplement, the concentrations in concentrate feed are higher than in the other types of feed, and (2) differences in trace element concentration in pasture and silage (more likely to be contaminated with soil) and hay, corn silage and alfalfa (less likely to be contaminated with soil) are higher at higher ratios of soil concentration/feed concentration.
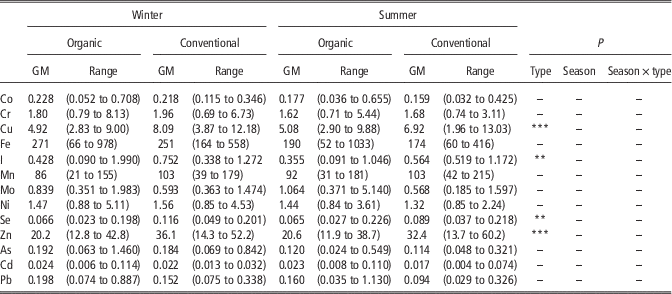
Estimated trace element concentrations in the total diet are shown in Table 2. Dietary concentrations of I, Cu, Se and Zn were significantly higher on conventional farms than on organic farms. In conventional farming systems, these elements are usually supplemented in concentrate feed at concentrations well above those found in any of the ingredients (Table 1, Supplementary Material Figure S1). Although the total dietary concentrations of I, Cu, Se and Zn tended to be higher during the winter (particularly on the conventional farms), the seasonal differences were not statistically significant (note that a higher level of concentrate feed is given in the winter; Supplementary Material Table S1). Overall, dietary trace element concentrations were within the adequate range in cattle diets (Co: 0.1 mg/kg DM; Fe: 50 mg/kg DM; Mn 0.4 mg/kg DM and Zn: 30 mg/kg DM; NRC, 2001), except for I, Cu and Se (see above), particularly in the organic systems throughout the year and in the conventional systems during summer.
Essential trace and toxic element concentrations in the total diet (mg/kg DM) of organic (n=22) and conventional (n=10) farms in North Spain.

***P<0.001; **P<0.01;*P<0.05.
Considering the toxic elements, there were no statistically significant differences in the total dietary concentrations in both farming systems (Table 2). These findings are consistent with previous findings in beef-cattle (Blanco-Penedo et al., Reference Blanco-Penedo, Shore, Miranda, Benedito and López-Alonso2009a), indicating that at least under the conditions of the study areas (agricultural region with low levels of pollution) the organic production system does not determine per se a higher/lower dietary toxic metal concentration, with residues in cattle (liver and kidney) being directly related to the grazing intensity (by soil consumption) in low input systems.
Trace element concentrations in blood serum
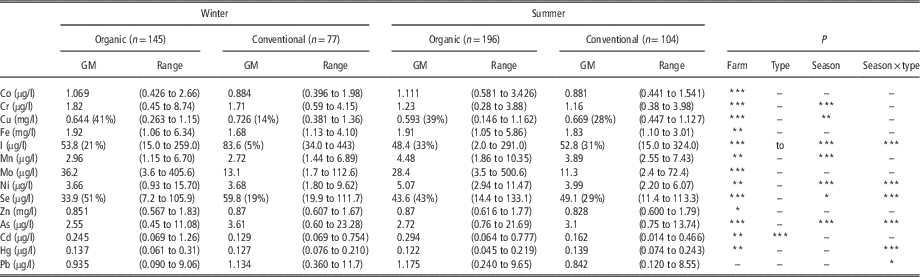
The essential and toxic trace element concentrations in serum from organic and conventional dairy cows are summarized in Table 3. Overall, there was a high level of variation in the concentrations of elements (P<0.05) (except for Pb) between farms, explaining between 15.4% (Fe) and 71.8% (As) of the total variation, although this was not associated with the type of farm (organic or conventional). Statistically significant differences between organic and conventional farms were only detected for serum Cd concentrations, which were higher in the organic farms. As no statistically significant differences were observed in the Cd concentrations in the diet (Table 2) between organic and conventional farms, it is possibly that the lower Cd load in the conventionally reared animals is related to metabolic interactions between Cd and Zn in the gut absorption (Lopez-Alonso et al., Reference Lopez-Alonso, Benedito, Miranda, Castillo, Hernandez and Shore2002). As previously stated, Zn is routinely supplemented in the conventional concentrate at concentrations three to five times those found in feed materials. With this exception, our results indicates that the organic production system does not per se determine a higher or lower trace mineral status or a toxic metal exposure of the animals, as it is generally the particular conditions on each farm (i.e. geographical or management practices) that explain the variation. Similar findings have been reported after analysis of other nutritional or sanitary endpoints, with somatic cell counts in milk (marker of udder health) being one of the best studied examples (Orjales et al., Reference Orjales, López-Alonso, Rodríguez-Bermúdez, Rey-Crespo, Villar and Miranda2016).
Essential trace and toxic element concentrations in serum of organic and conventional dairy cattle in North Spain

Percentage of samples below threshold values.
***P<0.001; **P<0.01;*P<0.05.
For most trace elements, season was a significant factor (Table 3), although significant interactions between season and type of farm were also observed. With the exception of Mn (higher concentrations in summer both in organic and conventional farms) and Ni (higher concentrations in summer only on organic farms), the concentrations of Cr and Cu (both farming systems) and of I, Se and As (only on the conventional farms) were significantly higher in winter than in summer. Seasonal variations in trace elements status in cattle have been reported for both farming systems (Blanco-Penedo et al., Reference Blanco-Penedo, Benedito, Shore, Miranda, García-Vaquero and López-Alonso2009b) and are attributed to a higher consumption of concentrate feed during the winter when availability of pasture is low. Seasonal differences in the animal trace element status are more important in conventional systems as high levels of trace elements are routinely added to concentrate feed. Moreover, seasonal differences were more important for elements with a renal pattern of excretion (mainly I and Se) and which can be absorbed in the gut at concentrations proportion to those in the diet (and even in excess when dietary concentrations are well above requirements) (Ceballos et al., Reference Ceballos, Sanchez, Stryhn, Montgomery, Barkema and Wichtel2009; Schöne et al., Reference Schöne, Leiterer, Lebzien, Bemmann, Spolders and Flachowsky2009). However, there were no seasonal differences in other trace elements supplied at high concentrations in the concentrate feed (Fe and Zn) and that undergo strict homeostatic control in the gut once requirements are covered (Suttle, Reference Suttle2010).
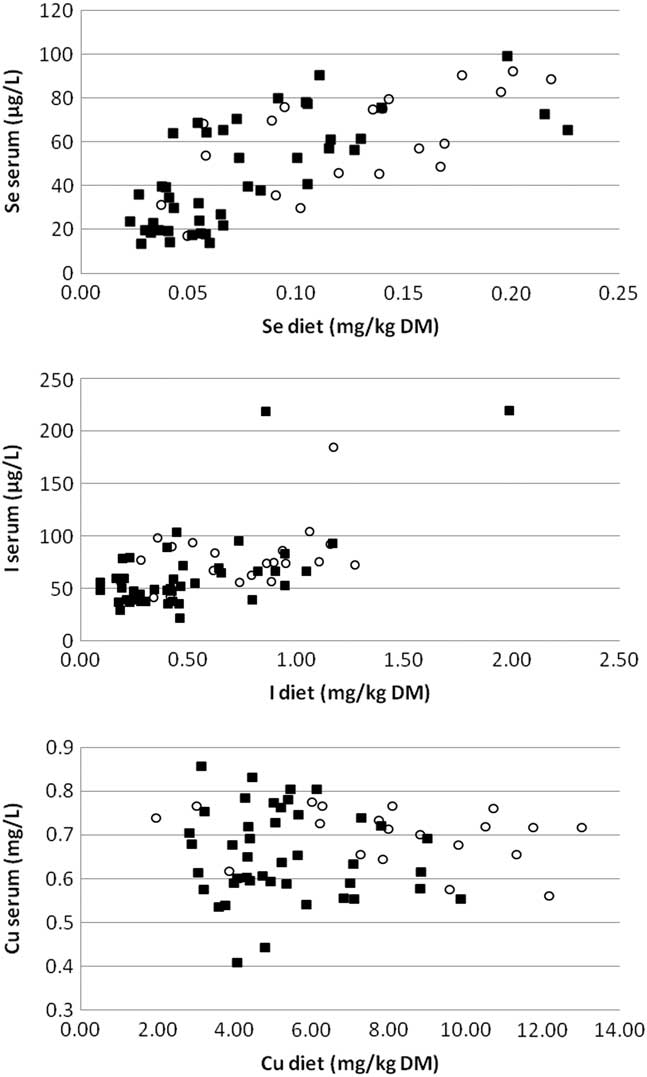
Essential trace element concentrations in serum were within the adequate or physiological ranges for cattle (Puls, Reference Puls1994; Suttle, Reference Suttle2010) except for I, Cu and Se (I, 40 µg/l, Alderman and Stranks, Reference Alderman and Stranks1967; Cu, 0.6 mg/l, Puls, Reference Puls1994; Se, 40 µg/l, Gerloff, Reference Gerloff1992). All farms with cattle (>10%) below the threshold normal level of Se and I in serum, had diets below the adequate nutritional requirement. Serum status of cattle was generally closely associated with the dietary concentrations of I (R=0.489, P<0.001) and Se (R=0.650, P<0.001) (Figure 1). By contrast, for Cu, as well as most trace elements that have a close gut regulation, there was no association (P>0.05) between serum and dietary intake; in fact, it is well established that serum concentrations are not good indicators of trace element status, which should be preferably evaluated in the liver (Lopez-Alonso, Reference Lopez-Alonso2012). Considering the trace elements that were within adequate levels in the diet, significant associations between dietary intake and serum concentration were only found for Co (R=0.472; P<0.001) and Mo (R=0.643; P<0.001). This was expected, as these elements have a renal excretion pattern, as I and Se. For the other essential trace elements that are regulated via intestinal homeostasis, serum concentrations do not increase significantly once requirements are covered.
Scatter plots showing the relationship between trace element concentrations in serum samples and diet in organic (▪) and conventional (○) systems. Only elements with statistically significant associations and/or farms within the deficient range are shown.

Toxic element concentrations were very low in all serum samples and did not pose any risk to cattle health (Puls, Reference Puls1994). Cadmium concentrations, although very low and indicative of a background environmental exposure in an agricultural (unpolluted) region, were significantly higher in the organic reared cattle. Similar results were observed in a comparison of beef cattle in different production systems in the study region, and cadmium concentrations in tissues (liver and kidney) were directly related to grazing intensity and soil consumption, higher in organic and low input systems (Blanco-Penedo et al., Reference Blanco-Penedo, Shore, Miranda, Benedito and López-Alonso2009a).
Chemometric analysis
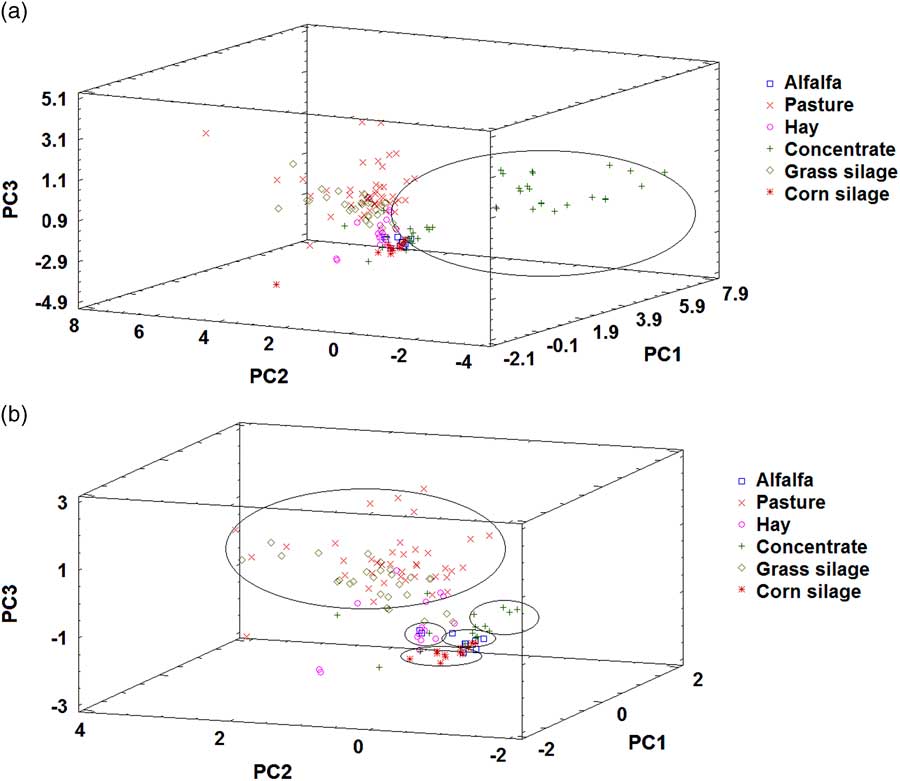
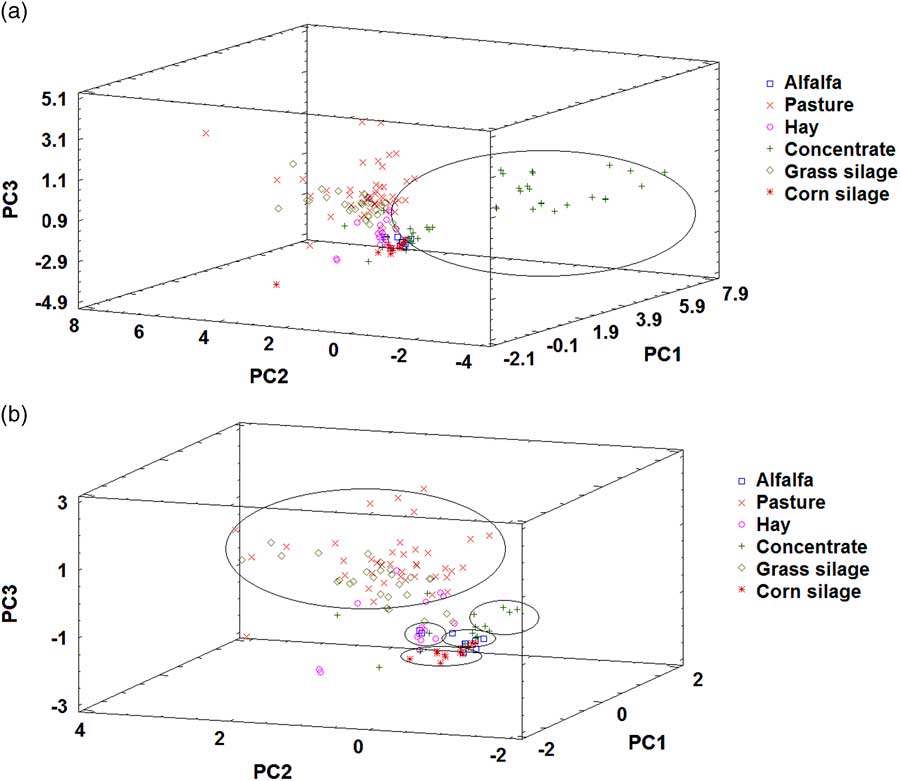
In the present study, the 13-dimension space obtained after principal component analysis (PCA) can be visualized as the score plot of the samples in the 3-dimension space of the first three principal components, thus maintaining almost 70% of the total variance in the data (Figure 2a). The concentrations of the trace elements in the concentrate feed were different from those in the other feed analysed and were identified as a different group on the left-hand side of the score plot. An enlargement of the central part of the score-plot, in which the remaining types of feed are located, is shown in Figure 2b. On the one hand, alfalfa, corn silage and hay comprised homogeneous groups that overlapped to some degree. This shows the presence of a group with a similar elemental profile (all samples in each feeding group display the same elemental fingerprint); and the slight overlap between groups also shows that these three types of feed contribute similar amounts of trace elements to the diet. A small group of concentrate feed, with similar levels of trace elements was also identified. This small group comprises the concentrates with low trace element content (low or non-mineral supplemented) used in organic systems. On the other hand, pasture and grass silage also overlapped, forming another less homogeneous group. This shows that pasture and grass silage have similar trace elementprofiles (which is logical), with similar contribution to trace element intake. The lower homogeneity of this group can be explained by the higher and more variable soil content than those of the other forage samples.
(a) Principal component analysis (PCA) score plot of the feed samples according to their type on the space defined for the first three principal components representing 68.83% of the total variance. (b) Enlargement of the central area of the score plot.
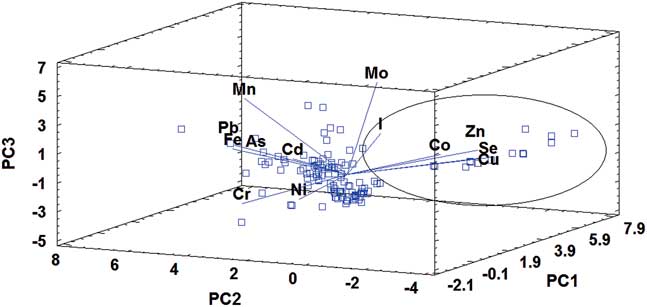
The samples and variables are presented in the same space in the bi-plot (Figure 3), to enable evaluation of the associations between them. Concentrate samples are mainly associated with Co, Cu, I, Se and Zn, which are the trace elements added to this type of feed. On the other hand, pasture and grass silage are mainly associated with trace elements derived from soil such as As, Cr, Fe and Pb The intake of these trace elements is therefore closely associated with the intake of soil by cattle during grazing.
Principal component analysis (PCA) biplot (feed samples and metal variables) for the first three principal components representing 68.83% of the total variance.

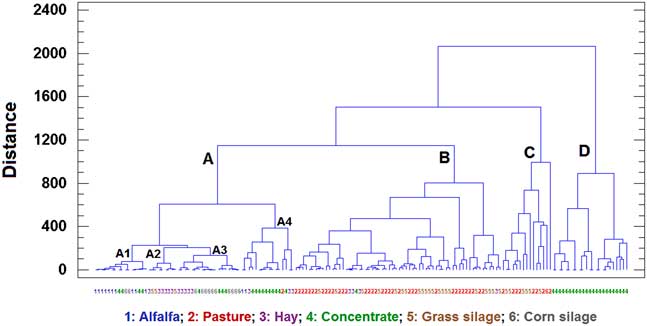
For validation of the PCA findings, HCA was applied to the same data matrix after autoscaling. Hierarchical cluster analysis builds clusters of samples on the basis of their separation in the 13-dimensional space measured as the squared Euclidean distance. The Ward method was used as an agglomeration procedure (Massart and Kaufman, Reference Massart and Kaufman1983). The clusters of samples obtained are represented as a tree-plot or dendrogram (Figure 4). The samples were clustered on the basis of the type of feed, in a similar way as in the PCA. At a distance of 1000, four main clusters were identified (A, B, C, and D). From right to left, Cluster D, which represents the group that is most different from the other feed studied (bound distance around 1200), comprises concentrate samples. This indicates that the trace element profile of the concentrate samples is very different from those in the other feed. Clusters B and C are formed by pasture and grass silage, demonstrating the similar contribution of these types of feed to the trace element intake. Cluster A can be explained on the basis of its four sub-clusters (A1, A2, A3 and A4). Sub-cluster A1 includes most of the alfalfa samples, sub-cluster A2 comprises hay samples, and sub-cluster A3 comprises corn silage samples. The close similarity between these three sub-clusters indicates that these three types of feed provide comparable trace element levels for animal nutrition. Finally, sub-cluster A4 comprises the concentrate samples with low or non-mineral supplementation used on organic farms. This indicates that these concentrates have a similar mineral fingerprint to alfalfa, hay and corn silage, and their use in organic systems did not supply trace elements at levels high enough to prevent deficiencies. These results are consistent with those obtained by PCA. The agreement between the results of both display techniques confirms the reliability of the conclusions reached.
Hierarchical cluster analysis dendrogram of the feed samples according to their type, based on Euclidean squared distance and Ward method.

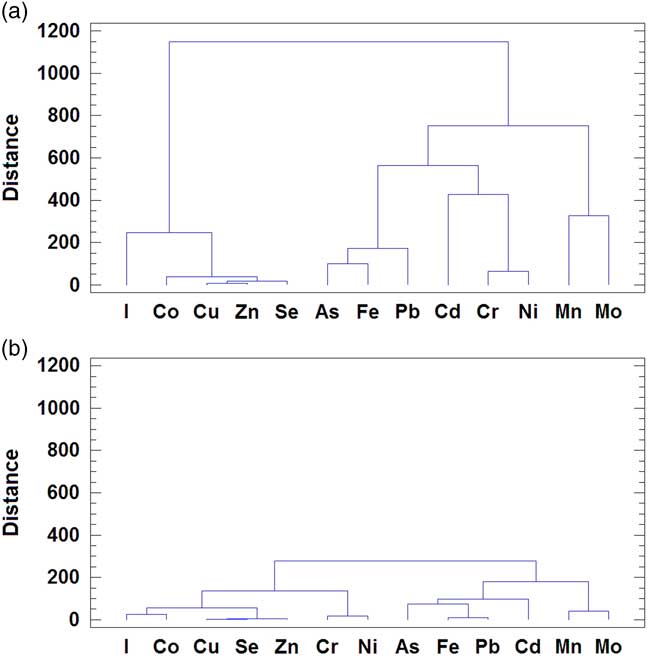
The HCA based of the squared Euclidean distance and using the Ward method as agglomeration procedure was applied separately to organic and conventional samples to further study the relationship between variables. The results are presented in Figure 5. Similar clusters were obtained for both types of samples. A cluster comprising Co, Cu, I, Se and Zn can be observed on the left-hand side of both dendrograms, possibly associated with the intake of concentrate feeds (supplemented with these particular elements). On the other hand, trace elements mainly derived from soil and associated with grazing practices appeared in a separate cluster, confirming the different origin of these elements. Moreover, two clear differences between both dendrograms (Figure 5a and b) can be observed. First, the distance between the clusters is much greater for the organic than for the conventional samples. This is due to the heterogeneity of the diets used in organic systems (including different proportions of pasture, hay, grass, corn silages and alfalfa, as well as low or non-mineral supplemented concentrate). In contrast, in conventional dairy farming the diets are much more standardized, usually as total mixed rations that include a high proportion of mineral supplemented concentrate feed. Second, the other main difference is the different location of Cr and Ni. In the organic samples, the cluster comprising these two trace elements is closely associated with the soil variables, confirming that these two trace elements are also derived from soil during grazing. Both Cr and Ni are strongly associated in nature (and related to soil) and are present in all rock types at levels ranging from trace amounts to high concentrations, relative to other trace elements (Gonnelli and Renella, Reference Gonnelli and Renella2012). However, in the case of conventional samples, the Cr–Ni cluster is related to elements in the concentrate. The concentrations of Cr, Ni and other toxic elements (mainly As, Cd and Pb) are relatively high in mineral supplements and must be monitored when used in animal nutrition (EFSA Panel on Additives and Products or Substances used in Animal Feed (EFSA), 2016). This may indicate that in the conventional samples, intake of Cr and Ni was mainly associated with concentrate feed because of the lower levels of grazing in conventional cattle and the low intake of soil via this route.
Hierarchical cluster analysis dendrograms of the variables based on Euclidean squared distance and Ward method: (a) Organic samples and (b) conventional samples.

Conclusions
The study identified no significant differences in trace element concentrations in blood serum between organic and conventional dairy cattle in northern Spain. However, trace element concentrations in the locally produced forage and the used concentrate feed in the organic farms is low. The trace element concentrations were also low in conventional forage, but the trace element status in conventionally-managed cows is generally adequate as mineral supplements are routinely added. The chemometric analysis of feed data allowed to identified two main sources of trace elements: (i) concentrate feed as the main source of trace elements included in the mineral supplements at concentrations higher than in the other feedstuffs (mainly, Co, Cu, I, Se and Zn), thus preventing mineral deficiencies, and (ii) ingestion of soil (during grazing or consumption of soil contaminated forage) as the main source of trace elements that are not supplemented (Cr, Mo and Ni), trace elements supplemented but present at higher concentrations in soil/forage than in mineral supplements (Fe, Mn), and toxic elements (As, Cd and Pb).
Acknowledgements
This study was supported by the Spanish Government (project code AGL2010-21026). Inmaculada Orjales is in receipt of a FPU fellowship (Ref. FPU14/01473) from the Spanish Ministry of Education, Culture and Sports. The authors thank all farmers who participated in the study and the staff of Rede de Infraestruturas de Apoio á Investigación e Desenvolvemento Tecnolóxico (RIAIDT) for analysing the samples.
Supplementary material
To view supplementary material for this article, please visit https://doi.org/10.1017/S1751731117002890