1. Introduction
It is fundamental to understand how active matter interacts with other active matter as well as passive matter in systems such as nature, living bodies, and some microfluidic devices. Bacteria (such as Escherichia coli, Bacillus subtilis, Serratia marcescens) are one of the most common forms of active matter, and have been extensively demonstrated to exhibit rich dynamics and collective behaviours in connection to the mutual interactions of these pushing-type microorganisms (termed as pushers) suspended in temperature aqueous environments (Lauga & Powers Reference Lauga and Powers2009; Koch & Subramanian Reference Koch and Subramanian2011; Aranson Reference Aranson2022), such as their enhanced diffusivity (Wu et al. Reference Wu, Roberts, Kim, Koch and DeLisa2006), spiral vortical motion (Dombrowski et al. Reference Dombrowski, Cisneros, Chatkaew, Goldstein and Kessler2004; Lushi, Wioland & Goldstein Reference Lushi, Wioland and Goldstein2014), decreased viscosity (Sokolov & Aranson Reference Sokolov and Aranson2009; Subramanian & Koch Reference Subramanian and Koch2009; Subramanian, Koch & Fitzgibbon Reference Subramanian, Koch and Fitzgibbon2011), ban formation (Spormann Reference Spormann1987) and chemical signalling (Soni et al. Reference Soni, Ali, Hatwalne and Shivashankar2003). Similarly, collective behaviour has been reported for suspensions of other microorganisms, including spermatozoa, microalgae and marine plankton (Koch & Subramanian Reference Koch and Subramanian2011; Elgeti, Winkler & Gompper Reference Elgeti, Winkler and Gompper2015), which plays key roles in recycling nutrients in ecosystems, food chains and various engineering applications (Duval & Gaboriaud Reference Duval and Gaboriaud2010). The more we learn about how they communicate and interact with each other, the more we can minimise their harm and exploit their benefits. To achieve this goal, considerable efforts have been devoted to the study of the interactions between microorganisms, including an early review article (Pedley & Kessler Reference Pedley and Kessler1992).
Ishikawa & Hota (Reference Ishikawa and Hota2006) performed an experimental study on the interaction between two swimming Paramecium caudatum. This study showed that the two microorganisms may avoid or escape from each other according to their initial displacement and orientation, which is essentially hydrodynamic (Ishikawa & Hota Reference Ishikawa and Hota2006). In particular, the authors confirmed that a rigid sphere with an appropriate surface velocity, known as a ‘squirmer’ (Lighthill Reference Lighthill1952; Blake Reference Blake1971; Pak & Lauga Reference Pak and Lauga2014), is suitable to describe the locomotion of a Paramecium or other cilia-/flagella-driven microorganisms. Notably, the spherical squirmer was later extended to a spheroidal one (Ishimoto & Gaffney Reference Ishimoto and Gaffney2013; Theers et al. Reference Theers, Westphal, Gompper and Winkler2016). Ishikawa et al. (Reference Ishikawa, Sekiya, Imai and Yamaguchi2007) used a bacterial model with a spherical cell body and single helical flagellum to study two interacting bacteria at negligible fluid inertia. As indicated by both studies (Ishikawa & Hota Reference Ishikawa and Hota2006; Ishikawa et al. Reference Ishikawa, Sekiya, Imai and Yamaguchi2007), the near-field interactions lead to a dramatic change in the orientation of the microorganisms, and this change is related to the noticeable diffusivity of active suspensions. Note that Hu et al. (Reference Hu, Yang, Gompper and Winkler2015) developed another bacterial model, which is composed of a spherocylindrical body with attached helical flagella. From a theoretical perspective, Ishikawa, Simmonds & Pedley (Reference Ishikawa, Simmonds and Pedley2006) solved the interaction between two squirming spheres at negligible fluid inertia for the limits of small and large separations based on lubrication theory. As indicated, two squirmers first attract each other and come into close contact. Then the squirmers change their orientation dramatically and eventually separate from each other (Ishikawa et al. Reference Ishikawa, Simmonds and Pedley2006). Similarly, Pooley, Alexander & Yeomans (Reference Pooley, Alexander and Yeomans2012) used an Oseen tensor of hydrodynamics to analytically solve the motion of two swimmers at low Reynolds numbers, and revealed that their interaction was dominated by an active term resulting from the simultaneous swimming action of both swimmers (Pooley et al. Reference Pooley, Alexander and Yeomans2012). Using a particle-based mesoscale hydrodynamic simulation scheme, Götze & Gompper (Reference Götze and Gompper2010) revealed the significance of thermal fluctuations in determining the interactions between squimers. Papavassiliou & Alexander (Reference Papavassiliou and Alexander2017) considered the wall effect, and obtained solutions for a squirmer in proximity to a planar or spherical surface as well as for two interacting squirmers based on the Lorentz reciprocal theorem at the Stokes flow limit. Considering the inertial effect, Li, Ostace & Ardekani (Reference Li, Ostace and Ardekani2016) numerically studied the hydrodynamic interaction of two spherical squirmers for Reynolds numbers varying from 0.1 to 100, and reported that fluid inertia both reduced the contact time of a pair of pushers and induced hydrodynamic attraction between the two pullers. A later study indicated that the inertial effect could suppress the collective behaviour of both pushing- and pulling-type swimmers (Lin & Gao Reference Lin and Gao2019). Based on the Stokes equation, Théry et al. (Reference Théry, Maaß and Lauga2023) examined the gravity-driven motion of two symmetrical squirmers above a solid wall, and revealed various interaction patterns between the two swimmers. Significantly, hydrodynamic interactions primarily govern how squirmers change their orientations, as indicated by Théry et al. (Reference Théry, Maaß and Lauga2023). The authors also analysed the role of gravity in the stability of a circle of pullers or pushers on a wall. Nie et al. (Reference Nie, Ying, Guan, Lin and Ouyang2023) studied the settling and interaction of two squirmers under gravity in a two-dimensional channel, and showed that the interacting pullers exhibit a variety of dynamics in terms of attraction or repulsion before they run separately. At finite Reynolds numbers, the pullers were observed to rise or fall adjacent to the channel wall with an inclined orientation. In contrast, the pushers always repelled each other because of the high pressure at the front and rear ends. In addition, this study indicated that the manner in which a puller interacts with a pusher depends greatly on its initial position (Nie et al. Reference Nie, Ying, Guan, Lin and Ouyang2023).
On the other hand, significant efforts have been devoted to the interactions between two squirmers that are bonded in a dumbbell and linked by a harmonic potential, e.g. the puller–puller, pusher–pusher (Clopés et al. Reference Clopés, Gompper and Winkler2020) and puller–pusher dumbbells (Clopés et al. Reference Clopés, Gompper and Winkler2022). The orientation, swimming efficiency and behaviour of different dumbbells were revealed, shedding new light on the guidance of controlling microswimmer assemblies for future microrobot applications (Clopés et al. Reference Clopés, Gompper and Winkler2020, Reference Clopés, Gompper and Winkler2022). In particular, Goh, Winkler & Gompper (Reference Goh, Winkler and Gompper2023) explored the self-steering strategy and hydrodynamics of a pursuer–target system. Both pursuer and target are modelled as spherical squirmers. This study is of practical help in the design of synthetic information processing microrobots at low Reynolds numbers (Goh et al. Reference Goh, Winkler and Gompper2023). A recent numerical study explored the interactions between two chiral squirmers (Xu et al. Reference Xu, Ouyang, Lin and Nie2024). The effects of chirality, which have not been extensively studied by researchers, were shown to considerably enhance the attraction of both pullers and pushers in a finite inertial flow regime. In general, we have learned much about the dynamics of interacting active matter (such as microorganisms or microswimmers) because of the extensive efforts made thus far. However, our knowledge is far from a comprehensive understanding of the collective dynamics or social patterns of microorganisms or microswimmers, especially when inertial effects cannot be ignored. Hence more work is needed in the future.
The complexity of active matter dynamics can be interpreted from another perspective, as active matter interacts with passive matter. For instance, stirred by the motion of active swimmers, passive Brownian tracers may attain a much larger hydrodynamic diffusivity, compared with Brownian diffusivity (Wu & Libchaber Reference Wu and Libchaber2000; Kim & Breuer Reference Kim and Breuer2004; Leptos et al. Reference Leptos, Guasto, Gollub, Pesci and Goldstein2009; Burkholder & Brady Reference Burkholder and Brady2017). Algae, such as Chlamydomonas reinhardtii and Euglena gracilis, propel themselves through two flagella, and gain thrust from the front (pullers). Owing to their small size, good motility, strong adaptability, ideal biocompatibility, and biodegradability, algae can be functionalised or fabricated and turned into bio-microrobots that are capable of performing various tasks, such as targeted drug/cell delivery, the selective removal of diseased cells, and non-invasive surgery in small and complicated spaces (Yasa et al. Reference Yasa, Erkoc, Alapan and Sitti2018; Yan et al. Reference Yan, Xu, Zhou, Jin, Vong, Feng, Ng, Bian and Zhang2019; Pan et al. Reference Pan, Shi, Zhao, Xiong, Xiao, Xin and Li2022; Xiong et al. Reference Xiong, Li, He, Shi, Pan, Zhu, Lu and Xin2024; Zhang et al. Reference Zhang2024). Algae-based microrobots were also proven to be capable of offering effective, ‘on the fly’ removal of targeted viruses in wastewater (Zhang et al. Reference Zhang2021). When these microrobots (also termed microswimmers) carry cargo (e.g. drugs, cells and viruses) in different bioenvironmental media, it is important to understand how active matter interacts with passive matter. The mobility and steerability of cargo carriers are basic requirements for fulfilling the task of drug/cell transport in clinical and engineering applications (Lin, Jiang & Shang Reference Lin, Jiang and Shang2022; Xu, Wu & Zhang Reference Xu, Wu and Zhang2023; Zarepour et al. Reference Zarepour, Khosravi, Iravani and Zarrabi2024). To accomplish efficient cargo transport operations, significant attempts have been made in studies of sperm-based (Xu et al. Reference Xu, Medina-Sánchez, Maitz, Werner and Schmidt2020; Magdanz et al. Reference Magdanz, Vivaldi, Mohanty, Klingner, Vendittelli, Simmchen, Misra and Khalil2021) and bacteria-based (Singh et al. Reference Singh, Hosseinidoust, Park, Yasa and Sitti2017; Alapan et al. Reference Alapan, Yasa, Schauer, Giltinan, Tabak, Sourjik and Sitti2018; Akolpoglu et al. Reference Akolpoglu, Alapan, Dogan, Baltaci, Yasa, Aybar Tural and Sitti2022) biohybrid microrobots in recent years. In particular, Pan et al. (Reference Pan, Shi, Zhao, Xiong, Xiao, Xin and Li2022) used two optically trapped C. reinhardtii cells as a bio-micromotor tweezer to trap and drive cargo along the prescribed paths in a non-contact manner. The key mechanism of their application relies on hydrodynamic interactions between motile cells and cargo. Specifically, the cargo is captured and dragged by the flow field resulting from the rotating movement of the cells (Pan et al. Reference Pan, Shi, Zhao, Xiong, Xiao, Xin and Li2022). Therefore, cargo loading and unloading procedures can be realised by adjusting the rotation rates of both cells, which avoids the potential biological damage that usually arises for these cargo–micromotor contact schemes. However, problems stemming from multiple cargo operations require further research (Pan et al. Reference Pan, Shi, Zhao, Xiong, Xiao, Xin and Li2022). Accordingly, researchers carried out multiple studies (Raz & Leshansky Reference Raz and Leshansky2008; Gao et al. Reference Gao2012; Debnath & Ghosh Reference Debnath and Ghosh2018; Muzzeddu et al. Reference Muzzeddu, Roldán, Gambassi and Sharma2023; Ouyang et al. Reference Ouyang, Lin, Lin, Yu and Phan-Thien2023) on the dynamics of an active microswimmer towing a passive load, focusing on the mobility of the cargo-carrier system. Recently, a numerical study was performed to evaluate the performance of a cargo-towing squirmer in a zigzag flow (Sankaewtong, Molina & Yamamoto Reference Sankaewtong, Molina and Yamamoto2024). The results of the study showed that pushers swim faster along the shear gradient direction than do pullers. The opposite is observed when squirmers carry cargo.
Despite the great progress made in numerous studies, much is still unknown regarding the interactions between microorganisms or microswimmers and passive matter, given the different propulsion mechanisms of active swimmers, diverse bioenvironmental media, and various flow conditions in practice. Hence we performed three-dimensional direct numerical simulations of the motion and interactions of swimming squirmers and passive spheres suspended in a Newtonian fluid under unbounded conditions for Reynolds numbers ranging from 0.01 to 1, covering regimes of both negligible and finite fluid inertias. To provide a comprehensive study, we considered an in-line arrangement for all particles (squirmers and spheres), and we focused on two issues: how squirmers interact with each other (i.e. puller–puller, puller–pusher and pusher–puller), and how squirmers interact with a sphere (i.e. puller–sphere, pusher–sphere, pusher–puller–sphere and pusher–sphere–puller). The in-line configuration is simple, but it allows us to concentrate on the axial interactions of active and passive matter, which have not been addressed before. We also shed light on the dynamic behaviour and mobility of squirmer cargo transport in our exploration of the second issue. As mentioned above, the use of hydrodynamic forces to capture and drive cargo in fluidic environments confers unrivalled advantages. This finding is consistent with the second hypothesis. Finally, we analyse the grouping behaviours of multiple squares and spheres to reflect the interacting nature of active and passive matter from a different perspective.
The remainder of this paper is organised as follows. In § 2, we briefly introduce the lattice Boltzmann method, the spherical squirmer model, and the problem with which we are concerned. Two numerical tests were performed to validate our methods and the choices of the computational domain and grid resolution, and § 3 presents comparisons between our results and previous solutions. Simulation results are provided in § 4, which includes four subsections: a puller leading another puller (§ 4.1), a puller leading a pusher and vice versa (§ 4.2), a sphere driven by squirmers (§ 4.3), and the grouping behaviours of squirmers and spheres (§ 4.4). Section 5 presents a summary of our study.
2. Method and problem description
2.1. Lattice Boltzmann method and boundary conditions
The fluid motion was solved using the three-dimensional lattice Boltzmann method. The discrete lattice Boltzmann equations of the single-relaxation-time model are expressed as (Qian, d’Humières & Lallemand Reference Qian, d’Humières and Lallemand1992)
 \begin{equation}f_{i} (\boldsymbol{x}+\boldsymbol{e}_{i}\,\Delta t, t+\Delta t)-f_{i} (\boldsymbol{x}, t)=-\frac{1}{\tau }\big(f_{i}(\boldsymbol{x},t)-{f_{i}}^{({eq})}(\boldsymbol{x},t)\big),\end{equation}
where f
i
(
x
, t) is the distribution function for the microscopic velocity
e
i
in the ith direction, f
i
(eq)(
x
, t) is the equilibrium distribution function,
 $\Delta$
t is the time step of the simulation,
 $ \tau$
is the relaxation time, and w
i
are weights related to the lattice model. The fluid density
 $ \rho $
and velocity
u
are determined using the distribution function
 \begin{equation}\rho =\sum _{i}f_{i},\quad \rho \boldsymbol{u}=\sum _{i}f_{i} \boldsymbol{e}_{i}.\end{equation}
Notably, we use u, v and w to represent the three components of the fluid velocity, i.e. u = (u, v, w). For the D3Q19 (19 speeds in three dimensions) lattice model used in this study, the discrete velocity vectors are given by
 \begin{equation}\boldsymbol{e}_{i}=\begin{cases} (0,0,0)\,c, & i=0,\\(\pm 1,0,0)\,c,\ (0,\pm 1,0)\,c,\ (0,0,\pm 1)\,c, & i=1{-}6,\\(\pm 1,\pm 1,0)\,c,\ (\pm 1,0,\pm 1)\,c,\ (0,\pm 1,\pm 1)\,c, & i=7{-}18, \end{cases}\end{equation}
where c
 $=\Delta x/\Delta t$
, and
 $\Delta$
x is the lattice spacing. Thus the speed of sound (c
s
) was determined to be
 $c_{s}=c/\sqrt{3}$
.
Following Qian et al. (Reference Qian, d’Humières and Lallemand1992), the following equilibrium distribution functions were chosen:
 \begin{equation}f^{({eq})}(\boldsymbol{x},t)=\rho w_{i}\left[1+\frac{3(\boldsymbol{e}_{i}\boldsymbol{\cdot }\boldsymbol{u})}{c^{2}}+\frac{9(\boldsymbol{e}_{i}\boldsymbol{\cdot }\boldsymbol{u})^{2}}{2c^{4}}-\frac{3(\boldsymbol{u}\boldsymbol{\cdot }\boldsymbol{u})}{c^{2}}\right]\!,\end{equation}
where the weights are set to be
 $ w_{0} = 1/3,\ w_{1-6} = 1/18,\ \text{and}\ w_{7-18} = 1/36 $
.
By performing Taylor and Chapman–Enskog expansions, the macroscopic mass and momentum equations in the low-Mach-number limit can be recovered from (2.1) as follows:
 \begin{align}&\qquad\qquad\qquad\quad \frac{\partial \rho }{\partial t}+\boldsymbol{\nabla }\boldsymbol{\cdot}(\rho \boldsymbol{u})=0, \end{align}
 \begin{align}& \frac{\partial (\rho \boldsymbol{u})}{\partial t}+\boldsymbol{\nabla }\boldsymbol{\cdot }\left(\rho \boldsymbol{uu}\right)=-\boldsymbol{\nabla }p+\boldsymbol{\nabla }\boldsymbol{\cdot }\left[\rho \nu \left(\boldsymbol{\nabla }\boldsymbol{u}+ (\boldsymbol{\nabla }\boldsymbol{u})^{\rm T}\right)\right]\!. \end{align}
Moreover, a linear relation is achieved between the fluid kinematic viscosity and relaxation time, i.e.
 $\nu = {c_{s}^2}\Delta t(\tau - 0.5)$
. Lattice units are commonly used instead of physical units in lattice Boltzmann simulations. For example, Δx and Δt represent one
 $\textit{lu}$
(lattice unit) and one
 $\textit{ts}$
(time step), respectively, resulting in c = 1 and c
s
=
 $1/\sqrt{3}$
, both in units of
 $\textit{lu}/\textit{ts}$
. Using these lattice units, the lattice Boltzmann method code can be developed in a simple manner.
The improved bounceback scheme proposed by Lallemand & Luo (Reference Lallemand and Luo2003) was used to impose no-slip conditions on the curved surface of a moving object. By scanning every fluid–solid boundary link that crosses the surface of an object, both the force and torque exerted on the object can be computed via a momentum exchange scheme (Lallemand & Luo Reference Lallemand and Luo2003). In addition, the method proposed by Aidun, Lu & Ding (Reference Aidun, Lu and Ding1998) was used to calculate the extra force and torque to account for the effects of the covered or uncovered fluid nodes as the object moved. Accordingly, the motion of the object is determined by solving Newton’s equations using the net force and torque. Note that the lattice Boltzmann method combined with the same boundary schemes was used in our recent studies (Ying et al. Reference Ying, Jiang, Nie and Lin2022; Nie et al. Reference Nie, Ying, Guan, Lin and Ouyang2023; Li & Nie Reference Li and Nie2024; Nie, Zhang & Lin Reference Nie, Zhang and Lin2024).
Schematics of (a) a spherical squirmer, and (b) two types of squirmers (fluid flows generated by a puller (
 $\beta$
= 5) and a pusher (
 $\beta$
= −5) at Re
s
= 0.01).

2.2. Problem definition
A spherical squirmer model (Lighthill Reference Lighthill1952; Blake Reference Blake1971) was adopted to describe the self-propelling microswimmers. For a squirmer, a prescribed slip velocity is enforced on its surface as an infinite series expansion of the radial (neglected for a purely tangential squirming motion), polar and azimuthal components (Pak & Lauga Reference Pak and Lauga2014):
 \begin{equation}\boldsymbol{u}^{s}(\hat{\boldsymbol{r}})=\sum _{n=1}^{\infty }\frac{2}{n(n+2)}B_{n} P_{n}^{1}(\cos \theta)\sin \theta\, \hat{\boldsymbol{\theta }}+\sum _{n=1}^{\infty }C_{n} P_{n}^{1}(\cos \theta)\sin \theta\, \hat{\boldsymbol{\phi }},\end{equation}
where
 $\hat{\boldsymbol{r}}$
,
 $\hat{\boldsymbol{\theta }}$
and
 $\hat{\boldsymbol{\phi }}$
refer to radial, polar and azimuthal unit vectors for a given point on the surface of a squirmer (see figure 1
a),
 $P_{n}^{m}(\cos \theta )$
are the associated Legendre polynomials of order m and degree n, and B
n
and C
n
are the corresponding time-dependent amplitudes, respectively. Because the higher-order terms (
 $n \gt 2$
) decay faster than do the leading terms (n = 1 and 2) as r increases, researchers usually use a second-order truncated formulation of
 $\boldsymbol{u}^{s}(\hat{\boldsymbol{r}})$
for simplicity. This formulation ignores the azimuthal components (which relate to the chiral nature of swimmers), as follows:
 \begin{equation}\boldsymbol{u}^{s}(\theta)=\frac{3}{2}U_{s}(\sin\theta +\beta \sin \theta \cos\theta)\hat{\boldsymbol{\theta }},\end{equation}
where U
s
= 2B
1/3 represents the steady-state swimming speed of a spherical squirmer at the Stokes flow limit. Accordingly, in this study, the Reynolds number was defined as
 $\textit{Re}_{s} = U_s a/\nu$
, where a is the radius of the squirmer. Another parameter, namely
 $\beta$
=
 $B_{2}/B_{1}$
, was introduced to represent the polarity strength of the squirmers. As shown in figure 1(b),
 $\beta$
> 0 represents pulling-type swimmers (which gain thrust from the front), whereas
 $\beta$
< 0 represents pushing-type swimmers (which gain thrust from the rear).
Figure 2(a) shows a schematic of one of the situations with which we are concerned. Two squirmers and one sphere of the same size (a = 12), distributed with equal spacing S, were initially placed along the central line of the domain (length × width × height = L × H × H), which was filled with a fluid of density
 $ \rho $
and viscosity ν. Periodic boundary conditions were imposed on all the sides. To explore how swimmers interact with each other, we considered three situations: a puller leading another puller, a puller leading a pusher, and a pusher leading a puller (figure 2
b). As for the interaction between swimmer(s) and a sphere, four situations were considered: a puller ‘pushing’ a sphere, a pusher ‘pushing’ a sphere, a sphere ‘pulled’ by a puller and ‘pushed’ by a pusher (figure 2
c), and a sphere ‘pushed’ by both a puller and a pusher (figure 2
a). For simplicity, the initial centre-to-centre distance between neighbouring particles was fixed at S = 3a for all the situations studied. All swimmers were assumed to swim rightwards (i.e. towards the positive direction of the x-axis), as indicated by the arrows. The swimming Reynolds number was 0.01 ≤ Re
s
≤ 1, covering regimes of both negligible and finite inertia. To eliminate boundary effects, we set H = 20a and L = 40a for no more than three particles, or L = 60a otherwise.
Schematics of (a) the computational domain (length × width × height = L × H × H) with periodic boundary conditions on all sides. Cases of (b) interactions between swimmers, and (c) interactions between swimmer(s) and a sphere. All swimmers were assumed to swim rightwards (as reflected by the arrows on them). The radii of the squirmers and sphere are identical (a = 12). Both width and height of the domain are fixed at H = 20a. The length is 40a for no more than three particles, or 60a otherwise.

2.3. Repulsive force model
When two particles approach each other, collisions may occur. To address this issue, the popular repulsive model proposed by Glowinski et al. (Reference Glowinski, Pan, Hesla, Joseph and Periaux2001) was introduced as follows:
 \begin{equation}F_{\textit{ij}}= \left\{\begin{array}{@{\!}c@{\quad}l} 0 & {\rm if}\ S_{\textit{ij}}\gt a_{i}+a_{\!j}+\xi, \\ \dfrac{c_{\textit{ij}}}{\varepsilon }\left(\dfrac{a_{i}+a_{\!j}+\xi -S_{\textit{ij}}}{\xi }\right)^{\! 2}\dfrac{X_{i}-X_{\!j}}{S_{\textit{ij}}} & {\rm if}\ S_{\textit{ij}}\leq a_{i}+a_{\!j}+\xi. \end{array} \right.\end{equation}
Here, a
i
and a
j
denote the radii of particles with mass centres at positions
X
i
and
X
j
, respectively, S
ij
is the distance between the mass centres, i.e.
 $S_{\textit{ij}} = |\boldsymbol{X}_{i} - \boldsymbol{X}_{j}|$
,
 $ \xi $
represents the cut-off distance below which the repulsive force takes effect,
 $ \epsilon $
is a positive stiffness factor chosen to separate the two particles, and c
ij
, as noted by Glowinski et al. (Reference Glowinski, Pan, Hesla, Joseph and Periaux2001), serves as a force-scaling factor that is fixed at 1 for simplicity. The influences of both
 $ \xi $
and
 $ \epsilon $
are assessed in § 3.3.
3. Validation
Two tests were considered here to validate our method and settings, i.e. the free swimming of a single puller or pusher (§ 3.1), and the hydrodynamic interaction between a swimmer and a sphere (§ 3.2). We examine the repulsive strategy (2.9) by varying either the stiffness factor or cut-off distance in § 3.3.
3.1. Free swimming of a single squirmer
As mentioned in § 2.2, a single squirmer has a steady-state swimming speed (
 $ U_{s} = 2B_{1}/3 $
) at negligible inertia, regardless of its strength
 $\beta$
. This result was confirmed by our results for Re
s
= 0.01 in figure 3(a); however, this differs for inertial squirmers (Wang & Ardekani Reference Wang and Ardekani2012). That is, the speeds of the pullers and pushers deviated from U
s
as Re
s
increased. For instance, our simulations indicate that the steady speed of the pusher (
 $\beta$
= −5) increases to approximately 1.8U
s
, whereas that of the puller (
 $\beta$
= 5) decreases to approximately 0.7U
s
at Re
s
= 1 (figure 3
a). The redistribution of vorticity induced by the fluid inertia is responsible for the opposite deviations (Chisholm et al. Reference Chisholm, Legendre, Lauga and Khair2016).
Simulation results of a freely swimming single squirmer in an unbounded domain. (a) Time history (
 $t^* = 0.5t U_{s}/a$
) of the swimming speeds (
 $U^* = U/U_{s}$
) of both a pusher (
 $\beta$
= −5) and a puller (
 $\beta$
= 5) at Re
s
= 0.01 and 1. (b) Steady speeds (
 $U_a^* = U_{a}/U_{s}$
) of both squirmers as functions of Re
s
.

Figure 3(b) shows the normalised speeds (
 $U_a^*$
=
 $ U_{a}/U_{s} $
) of both the puller and pusher as functions of Re
s
. The
 $U_a^*$
term increases monotonically as Re
s
increases from 0.01 to 1 for the pusher. The opposite trend is observed for the puller. More importantly, our simulation results agree with the numerical values from the literature (Chisholm et al. Reference Chisholm, Legendre, Lauga and Khair2016) and the solution of a formulation based on the method of matched asymptotic expansions (Khair & Chisholm Reference Khair and Chisholm2014):
 \begin{equation}U_{a}^{*}=\frac{1+\left(\dfrac{5}{6}+\dfrac{1403}{70\,560}\beta \right){\textit{Re}}_{s}}{1+\left(\dfrac{5}{6}+\dfrac{11\,987}{70\,560}\beta \right){\textit{Re}}_{s}}.\end{equation}
Wang & Ardekani (Reference Wang and Ardekani2012) developed a simple method to predict
 $U_a^*$
, which is given by
 \begin{equation}U_{a}^{*}=1-\dfrac{3}{20}\beta\, {\textit{Re}}_{s}.\end{equation}
However, this prediction increasingly deviated from our puller results at Re
s
> 0.1. Note that the coefficient of O(Re
s
) in (3.2) was originally −0.11
 $\beta$
, which was an erroneous result that was confirmed and rectified by Professor Ardekani (Khair & Chisholm Reference Khair and Chisholm2014).
Figure 4 shows the iso-surfaces of x-component fluid velocity (upper row
 $ u^{*} = u/U_{s} $
) and the pressure (lower row
 $p^{*}$
) around the same pusher (figure 4
a,b) and puller (figure 4
c,d) at Re
s
= 0.01 (figure 4
a,c) and Re
s
= 1 (figure 4
b,d). Note that the pressure was normalised through
 $ p^{*} = (p-p_{a})/p_{m} $
, where p
a
and p
m
are the averaged and maximum pressures, respectively. The area of the positive flow (
 $ u^{*} \gt 0 $
) behind the puller decreases with Re
s
(upper row of figure 4
a,b), consistent with the reduced speed of the puller. In contrast, the backward flow (
 $ u^{*} \lt 0 $
) behind the pusher becomes sharp, and shrink as Re
s
increases from 0.01 to 1 (upper row of figure 4
c,d), reflecting the increasing speed of the pusher. Accordingly, the pressures, which play a critical role in the axial interactions of the squirmers and spheres, show a distinct difference between the puller and pusher. For the whole range of Re
s
studied, high-pressure (
 $ p^{*} \gt 0 $
) areas were observed at both the front and rear sides of the pusher (lower row of figure 4
c,d). The opposite trend (
 $ p^{*} \lt 0 $
) was observed for the puller (lower row of figure 4
a,b).
Iso-surfaces of the streamwise fluid velocity (upper row
 $ u^{*} = u/U_{s} $
) and pressure (lower row
 $ p^{*} $
) around (a,b) the puller (
 $\beta$
= 5) and (c,d) the pusher (
 $\beta$
= −5) at two values of Re
s
: (a,c) Re
s
= 0.01, (b,d) Re
s
= 1. Note that the pressure was normalised through
 $ p^{*} = (p-p_{a})/p_{m} $
, where p
a
and p
m
are the averaged and maximum pressures, respectively.

3.2. Hydrodynamic interaction between a puller and a sphere
We simulated the motion of a sphere induced by a neighbouring puller to further validate our code (figure 5 a). This case was analytically studied by Ishikawa et al. (Reference Ishikawa, Simmonds and Pedley2006) at the Stokes flow limit. This study revealed that as the distance (S) between the two objects increases, the radial speed (U r ) of the sphere decays at S −2, whereas the rotational speed (Ω) decays at S −3 (Ishikawa et al. Reference Ishikawa, Simmonds and Pedley2006).
Benchmark test for the interaction between a puller (
 $\beta$
= 1) and a sphere at Re
s
= 0.01. (a) Schematic diagram of the physical model and notation used. (b) Translational (radial component) and rotational speeds of the sphere as functions of the distance (
 $ S^{*} = S/a $
). Note that
 $ \theta =1.25\pi $
,
 $ U_{r}^{*} = U_{r} / U_{s} $
and
 $ \Omega^{*} = \Omega a/U_{s} $
.

We let the puller face downwards, which results in θ = 1.25π. Note that θ denotes the angle between the swimming direction of the puller and the centre-to-centre line (figure 5
a). Figure 5(b) shows that our simulations (at Re
s
= 0.01) reproduce the theoretical prediction as
 $ S^{*} = (S/a) $
increases from 2.4 to 7. In figure 6(a,b), we show flow fields of the two interacting objects at S
* = 2.4 and 5, respectively. It appears that the puller had a very weak effect on the sphere (in terms of the surrounding fluid velocity) when the distance between them was as large as 5 (figure 6
b). However, both
 $ U^{*}_{r} $
and
 $ \Omega^{*} $
for the sphere could be accurately calculated through our simulations (figure 5
b).
Flow features (vector fields and z-component velocity contours, i.e.
 $ w^{*} = w/U_{s} $
) of a sphere near a puller swimming downwards (θ = 1.25π) at (a) S
* = 2.4 and (b) S
* = 5. Note that only the results at the central plane (y = 0) where both objects were placed are shown.

3.3. Examination of the repulsive model
The repulsive model used in this study is examined in this subsection. Two adjusting parameters appear in (2.9): the stiffness factor
 $ \epsilon $
, and the cut-off distance
 $ \xi $
. Figure 7 shows the effects of both parameters on the close contact of two identical pullers (
 $\beta$
1 =
 $\beta$
2 = 5) at Re
s
= 1. Owing to the low-pressure areas between the two pullers (see figure 4), the pullers became closer while swimming rightwards (figure 7
a). The cut-off distance, which usually spans 1–2 grid spaces, has limited influence on the final gap between the two objects. By contrast, the stiffness factor shows no visible effect on the distance between the pullers (figure 7
a). On the other hand, either of the parameters (
 $ \epsilon $
and
 $ \xi $
) may affect the instantaneous speed of the pullers during transience (e.g.
 $ U_{2}^{*} $
at 0.5 < t
* < 0.6 in figure 7
b). However, the terminal speed was not sensitive to either condition. Therefore, we set
 $ \xi = 1.5\ \Delta x $
and
 $ \epsilon = 0.001 $
for all simulations.
Effects of the stiffness factor
 $ \epsilon $
and cut-off distance
 $ \xi $
from (2.9) on the close contact of two pullers (
 $\beta$
1 =
 $\beta$
2 = 5) at Re
s
= 1: (a) distance between the pullers; (b) swimming speed of the leading puller (
 $U_2^* = U_{2}/U_{s}$
).

Time histories of the speeds of two identical pullers (
 $\beta$
1 =
 $\beta$
2 = 5) at different values of Re
s
: (a) Re
s
= 0.01, (b) Re
s
= 0.1, (c) Re
s
= 1. See also supplementary movies 1(a–c).

4. Results
Here, we study the motion and dynamics of two interacting pullers (§ 4.1), and a puller interacting with a pusher (§§ 4.2 and 4.3). To shed light on microswimmer-driven cargo transport, we considered the interactions between a single puller/pusher and a sphere (§ 4.4). The motion of a sphere driven by two squirmers is also considered to achieve high speeds for the sphere (§ 4.4). The grouping behaviours of multiple particles (squirmers and spheres) are provided in § 4.5 to further demonstrate the interacting nature of these active and passive objects from a different perspective.
4.1. A puller leading another puller
When one puller leads another puller, it will eventually come into contact if the initial distance is as large as S
*(0) = 3. Figure 8 shows the time evolution of the speeds of the two identical pullers (
 $\beta$
1 =
 $\beta$
2 = 5) at various Reynolds numbers (see also supplementary movie 1
a–c are available at https://doi.org/10.1017/jfm.2025.10679). The speed of a single puller was also included for each Re
s
. The general features were similar for all cases considered (figure 8). Both pullers were seen to swim at the same speed at t
* ≤ t
s
, during which neither puller ‘feels’ the existence of the other. Subsequently, the trailing puller speeds up significantly owing to the attraction of the leading puller. In contrast, the speed of the leading puller increased slightly for some time, then decreased sharply because it was attracted by the trailing puller. At t
* = t
c
, both pullers come into contact when the speed of the leading/trailing puller abruptly increases or decreases to a value that is slightly higher than that of a single puller at the same Re
s
(figure 8). The reason will be given later in this section. At
 $t^{*} \gt t_{c}$
, the two pullers formed a stable doublet and swam. Moreover, both times (t
s
and t
c
) are larger for a higher Re
s
. This is reasonable because the speed of a single puller decreased with Re
s
. Another possible reason is that the negative pressure regions of the puller become smaller as Re
s
increases (figure 4). Therefore, it takes longer for the pullers to hydrodynamically interact with each other before they touch and form a doublet at a higher Re
s
.
Pullers with different strengths (
 $\beta$
) exhibit similar behaviours. To demonstrate this, we varied
 $\beta$
2 (
 $\beta$
2 = 1, 5, 9) while keeping
 $\beta$
1 unchanged (
 $\beta$
1 = 5). Our simulations indicate that the pullers always touch each other and form a doublet that swims at a speed dependent on Re
s
and
 $\beta$
2. Notably, for each
 $\beta$
2 studied, the speed of the doublet decreased with Re
s
and fit well with the solution of a power-law formulation that exhibited a shape similar to that of a single puller of strength
 $\beta$
2 (Khair & Chisholm Reference Khair and Chisholm2014), as shown in figure 9.
Steady speeds (
 $U_g^* = U_{g}/U_{s}$
) of a doublet consisting of two pullers with
 $\beta$
1 = 5 and (a)
 $\beta$
2 = 1, (b)
 $\beta$
2 = 5, (c)
 $\beta$
2 = 9. Note that we used U
g
to represent the steady speed of a group of particles (squirmers and spheres). The dashed lines are the least squares fitting curves. The dash-dot-dotted, solid and dash-dotted lines denote the speeds of a single puller (
 $U_a^*$
) with
 $\beta$
= 1, 5, 9 (see (3.1)).

According to Khair & Chisholm (Reference Khair and Chisholm2014), the stronger the puller, the slower it swims (figure 3
b). In contrast, a doublet consisting of a stronger puller may exhibit a higher speed (figure 9
c). This tendency is significant at low values of Re
s
. For instance, the steady speed (
 $U_g^* = U_{g}/U_{s}$
) of a doublet with
 $\beta$
1 = 5 and
 $\beta$
2 = 1 is approximately 0.74U
s
at Re
s
= 0.1 (figure 9
a), i.e.
 $U_g^*$
≈ 0.74. We use U
g
to represent the steady speed of a group of particles (squirmers and spheres), to distinguish it from that of a single particle (U
a
). The value of
 $U_g^*$
increases to approximately 1.25 when
 $\beta$
2 = 9 (figure 9
c). Figure 10 illustrates the primary reason for this by showing the instantaneous flow fields of the same doublets as those shown in figure 9 at Re
s
= 0.1. The most significant differences were observed in the pressure distributions. For
 $\beta$
2 = 1 (figure 10
a), the negative pressure is much more noticeable at the rear of the doublet than at the front. The opposite trend was observed for
 $\beta$
2 = 9 (figure 10
c). Consequently, an additional force originating from the (negative) pressure differences hindered the doublet with
 $\beta$
2 = 1 (figure 10
a) while propelling the other (figure 10
c). This is why a single puller (
 $\beta$
= 5) swims faster than the doublet with
 $\beta$
2 = 1 but slower than that with
 $\beta$
2 = 9 for the entire range of Re
s
considered.
Flow fields of the same doublets as those shown in figure 9(a–c) at Re s = 0.1.

To provide a quantitative analysis, we show the differences in swimming speed between the doublet and single puller (
 $\beta$
= 5) in figure 11(a), i.e. ΔU =
 $U_g^*$
– U
a
*. The speed of two identical pullers (
 $\beta$
2 = 5) is always slightly higher than that of a single puller. One possible mechanism is as follows. Squirmers have macroscopic speeds because of the prescribed slip velocity imposed on their surfaces. The surface area of the doublet was twice that of the single puller, indicating that more slip velocity sources contributed to the macroscopic speed of the doublet. Therefore, the doublet was expected to swim much faster than a single puller. However, when the pullers come into contact, the trailing puller faces the rear end of the leading puller, and the puller gains thrust from the front. Consequently, the self-propulsion dynamics of the trailing puller are significantly suppressed (figure 10). These results are further confirmed in § 4.5, which describes a string of multiple pullers that exhibits a slowly increasing speed as the number of pullers increases. This mechanism also applies to doublets with different pullers (figure 9
a,c), for which the fore and aft pressure differences dominate the locomotion of the doublets. Figure 11(a) also shows that the speed of the doublets converges to that of a single puller as Re
s
increases. As expected from figure 8, the contact time (t
c
) increases with Re
s
, and this finding is further confirmed by figure 11(b). Moreover, it took longer for the trailing puller to chase the stronger puller (figure 11
b). This is rational because a stronger puller runs slower.
Summarisation for a doublet consisting of two pullers with
 $\beta$
1 = 5 and a varying
 $\beta$
2. (a) Differences in swimming speed (
 $ \Delta U = U_{g}^{\ast}$
–
 $ U_{a}^{\ast} $
) between the doublets and single puller (
 $\beta$
= 5). (b) Contact times of the pullers (i.e. t
c
, as indicated in figure 8). Note that the speed of single puller (
 $U_a^*$
) is obtained according to (3.1).

4.2. A puller leading a pusher
The situation is quite different when a puller leads a pusher because the pullers are attractive, whereas the pushers are repulsive, in terms of the fore and aft pressures of the squirmers (figure 4). For instance, figure 12(a) shows that the squirmers do not come into contact at all when Re
s
= 0.01, at which point a single pusher (
 $\beta$
= −5)/puller (
 $\beta$
= 5) swims at the same speed (U
s
= 2B
1/3). Interestingly, the speeds of both squirmers remained the same at all times, and finally reached a value that was substantially larger than U
s
(figure 12
a), i.e.
 $U_g^*$
≈ 1.55. At a higher value of Re
s
, the squirmers may contact and form a stable doublet that swims faster than does a single pusher (
 $\beta$
= −5), as seen in figure 12(b,c). Note that supplementary movies 2
a–c accompany figure 12(a–c). Compared with the case of two pullers (figure 8
b,c), it took a much longer time for the puller and pusher to swim because the attractive puller is competing with the repulsion of the pusher all the time before they finally touch. The results in figure 12(b,c) correspond to the initial distances between the squirmers of S
*(0) = 3. However, similar behaviours would be observed for other initial distances because the trailing pusher (
 $\beta$
1 = −5) always swims faster than the leading puller (
 $\beta$
2 = 5) at a non-zero value of Re
s
.
Time histories of the speeds of a leading puller (
 $\beta$
2 = 5) and trailing pusher (
 $\beta$
1 = −5) at (a) Re
s
= 0.01, (b) Re
s
= 0.1, (c) Re
s
= 1. See also supplementary movies 2(a–c).

Terminal speeds of a doublet consisting of a trailing pusher (
 $\beta$
2 = −5) and leading puller with different strengths: (a)
 $\beta$
1 = 1, (b)
 $\beta$
1 = 5, (c)
 $\beta$
1 = 9. The dashed lines are the least squares fitting curves. The solid line represents the solution for a single pusher with
 $\beta$
= −5 (Khair & Chisholm Reference Khair and Chisholm2014).

The pressure distributions (figure 4) provide a direct view of how the two squirmers attain an enhanced speed. Generally, the pressure difference force resulting from the negative and positive pressures at the front and rear ends of the squirmers, respectively, acts as an additional thrust on the squirmers for all values of Re
s
studied. Note that the trailing pusher gains thrust from the rear. In contrast to the case of two pullers (§ 4.1), it does not matter whether the two squirmers come into close contact or not. Consequently, the doublet can swim as fast as approximately 2U
s
at Re
s
= 1 (figure 12
c), i.e.
 $U_g^*$
≈ 2.
Similar to figure 9, figure 13 summarises the terminal speeds of a structure consisting of a trailing pusher (
 $\beta$
2 = −5) and leading puller with different strengths (
 $\beta$
1 = 1, 5, 9). The solution of single pusher with
 $\beta$
= −5 (Khair & Chisholm Reference Khair and Chisholm2014) was also included. We reveal that the pusher never comes into contact with the weak puller (
 $\beta$
1 = 1) because the repulsive pusher dominates how the two interact (see figure 15(a) below). For the range of Re
s
studied, the speed of the structure with
 $\beta$
1 = 1 increased linearly with Re
s
and was slightly higher than that of the single pusher (figure 13
a). In contrast, the pusher always touched the strong puller (figure 14). That is,
 $\beta$
1 = 9, and a remarkably enhanced speed was eventually achieved for all Re
s
values (figure 13
c). For instance, a doublet with
 $\beta$
1 = 9 swims more than 100 % faster than a single pusher at Re
s
= 0.01. Certainly, a strong puller not only dominates the attraction of the squirmers, but also contributes to the increase in speed. Figure 14 shows that most surfaces of the trailing pusher bear the negative pressure generated by the strong puller that takes the lead, which produces a larger thrust on the doublet. In figure 13(c), a linear relationship between
 $U_g^*$
and Re
s
is also attained for Re
s
≥ 0.4. However, for the intermediate puller (
 $\beta$
1 = 5), the squirmers maintained an initial distance at all times when Re
s
< 0.05 (figure 13
b). We observed an abrupt increase in speed when the pusher caught up with the puller at Re
s
= 0.05. Similarly, another linear formulation between
 $U_g^*$
and Re
s
(Re
s
≥ 0.05) was attained for the doublet with
 $\beta$
1 = 5.
Iso-surfaces of the pressure for a doublet consisting of a leading puller (
 $\beta$
2 = 9) and trailing pusher (
 $\beta$
1 = −5) at (a) Re
s
= 0.01, (b) Re
s
= 0.1, (c) Re
s
= 0.5, (d) Re
s
= 1.

Simulation results for the interaction between a leading puller (
 $\beta$
2 = 1) and trailing pusher (
 $\beta$
1 = −5). (a) Distances between the squirmers at various values of Re
s
. (b) Speeds of both squirmers at two values of Re
s
. The inset in (b) shows the iso-surface of the pressure (levels ±0.02) for the squirmers at Re
s
= 0.2.

Figure 15(a) shows the time history of the distances between the pusher and weak puller (
 $\beta$
1 = 1) at various Re
s
values. Note that the distances for the strong puller (
 $\beta$
1 = 9) exhibit similar variations that resemble those shown in figure 7(a) for all values of Re
s
studied (not shown here). In contrast, Re
s
plays a significant role in the interaction between the weak puller and pusher. The distance between the two increases instantly from an initial value when Re
s
is low (Re
s
= 0.01, 0.05, 0.2), suggesting that the puller is ‘repelled’ by the trailing pusher (figure 15
a). This is further illustrated in figure 15(b), which shows the time history of the speeds of both squirmers at Re
s
= 0.2 and 1. The weak puller attains a speed that is considerably higher than that of the pusher at Re
s
= 0.2 before the squirmers swim as a whole. This is in contrast to the case of an intermediate puller (
 $\beta$
1 = 5) interacting with the same pusher (figure 12
b,c). Ultimately, the weak puller maintains a large distance from the pusher (inset of figure 15
b). However, as Re
s
increased, the speed of the pushers increased, whereas that of the pullers decreased (figure 3
b). Therefore, the pusher tends to approach the weak puller at higher Re
s
values (figure 15
a). In particular, figure 15(b) shows that the puller swims faster than the pusher for t
* < 0.5 at Re
s
= 1, which leads to an increasing distance. Subsequently, the pusher became faster, and the distance between the two decreased to a constant value (figure 15
a). The repulsive pusher keeps the weak pullers apart from each other.
4.3. A pusher leading a puller
Compared with § 4.2, the situation becomes nearly opposite when a pusher leads a puller. Figure 16(a–c) show the speeds of a leading pusher (
 $\beta$
2 = −5) and trailing puller (
 $\beta$
1 = 5) at the same values of Re
s
as those shown in figure 12(a–c), representing three types of interacting behaviours. At low values of Re
s
(Re
s
= 0.01, figure 16
a), the squirmers moved at the same speed, which was approximately one-third of that of the opposite case (figure 12
a), i.e.
 $U_g^*$
≈ 0.52. As Re
s
increased, the pusher moved faster than the puller. However, at an intermediate value of Re
s
(e.g. Re
s
= 0.1 in figure 16
b), the leading pusher may swim slowly along with the puller at all times, or at least for a substantial amount of time. The pusher could quickly remove the puller only when Re
s
was sufficiently high (figure 16
c).
Time histories of the speeds of a leading pusher (
 $\beta$
2 = −5) and trailing puller (
 $\beta$
1 = 5) at (a) Re
s
= 0.01, (b) Re
s
= 0.1, (c) Re
s
= 1.

The primary reason for the observation in figure 16 is simple: the attractive trailing puller attempted to prevent the leading pusher from leaving. This may succeed at a low value of Re s . As illustrated in figure 17(a), the positive/negative pressure at the front and rear ends of the squirmers resulted in an additional force that held the doublet back at Re s = 0.01. The visible expansion of the negative flow between the squirmers (figure 17 b) may reflect the slow speed of the doublet, compared with that of a single puller or pusher at the same Re s value (figure 4). Figure 17(c) shows the fluid streamlines around the structure in the (x,z) plane. Two circulating regions are known to exist at the front and rear ends of a squirmer. Therefore, four circulating regions exist between the leading and trailing squirmers. When the squirmers approach each other, these four circulating regions incorporate into two larger regions (figure 17 c).
Simulation results for a doublet consisting of a leading pusher (
 $\beta$
2 = −5) and trailing puller (
 $\beta$
1 = 5) at Re
s
= 0.01: (a) fluid pressure, (b) streamwise fluid velocity, and (c) the streamlines in the (x,z) plane.

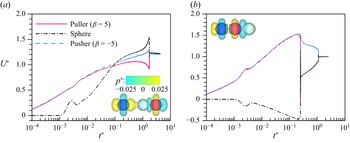
Time histories of the speeds of a leading sphere and (a) trailing pusher (
 $\beta$
= −5) or (b) trailing puller (
 $\beta$
= 5) at Re
s
= 1. See also supplementary movies 3(a,b).

4.4. Interactions between microswimmers and a sphere
Microswimmer-driven cargo transport in biomedical applications has received considerable attention in recent years because of its numerous advantages. Here, we studied how a sphere was driven by squirmers to reveal the dynamic features of active particles interacting with passive particles. The results of this study shed light on the performance of squirmer-driven cargo transport.
As illustrated in figure 18, a sphere can be ‘pushed’ to run by either a pusher (
 $\beta$
= −5, figure 18
a) or a puller (
 $\beta$
= 5, figure 18
b). However, significant differences were observed between the two cases. Driven by the pusher, the sphere eventually attained a speed (1.37U
s
) that was significantly higher than that of the same sphere (0.17U
s
) driven by the puller. Typically, the sphere exhibited a backward speed owing to the attraction of the puller before it ran as a whole (figure 18
b). In contrast, the sphere accelerated quickly when it interacted with the pusher (figure 18
a). More importantly, it took considerably longer for the pusher and sphere to reach a steady state (figure 18
a). However, once the sphere contacts the puller, the two form a stable doublet and run at a constant speed, similar to the case of two pullers (§ 4.1). Supplementary movie 3 shows the two cases.
From figure 4, it is expected that the sphere eventually contacts the puller while keeping a distance from the pusher (see figures 19 and 20), suggesting that the sphere is directly ‘pushed’ by the puller while being hydrodynamically ‘pushed’ by the pusher. As a result, the thrust from the front of the puller was largely suppressed, whereas the self-propulsion dynamics of the pusher was not affected. These factors are primarily responsible for the remarkable difference in the terminal speed of the sphere ‘pushed’ by a pusher (figure 18 a) and puller (figure 18 b). Another reason for this difference is that the speed of a single pusher is higher than that of a single puller at a non-zero value of Re s . Hydrodynamic pushing was also responsible for the substantial amount of time required for the sphere to run with the pusher as a whole (figure 18 a).
Time histories of the distances between a leading sphere and (a) trailing pusher (
 $\beta$
= −5) or (b) trailing puller (
 $\beta$
= 5) at various values of Re
s
.

Streamlines for a leading sphere and (a) trailing pusher (upper,
 $\beta$
= −5) or (b) trailing puller (lower,
 $\beta$
= 5) at (a) Re
s
= 0.01, (b) Re
s
= 0.1, (c) Re
s
= 1.

Figure 19 shows the distances between the sphere and pusher as well as the puller at various Re s values. For the range of Re s values studied, the pusher never touched the sphere (figure 19 a), suggesting that the sphere experienced hydrodynamic pushing at all values of Re s . The opposite was observed for the puller (figure 19 b). Moreover, the lower the Reynolds number, the larger the distance that the pusher maintains from the sphere (figure 19 a). These results are consistent with those of the same pusher and weak puller, as shown in figure 15(a). However, we did not observe an increase in S * – even at Re s = 0.01 – in figure 19(a) because the sphere was passive, unlike the active puller (figure 15 a). As Re s increases, the speed of the single puller decreases, which leads to the puller requiring more time to catch up with the sphere at a higher value of Re s (figure 19 b).
To provide more insight into this issue, figure 20 shows the streamlines for the sphere interacting with the pusher (upper row) and puller (lower row). At Re s = 0.01, similar streamline structures were observed in both cases (figure 20 a). Each squirmer was surrounded by four circulating regions. This was true for the pusher for all Re s values studied. At Re s = 1, the circulating regions shift backwards with a sweepback-like structure owing to the significantly increased speeds of the pusher and sphere (figure 20 c). For the sphere ‘pushed’ by the puller, two additional circulating regions appear on the upper and lower sides of the sphere with increasing Re s (figure 20 b,c). However, the most significant feature was that most of the streamlines flowing towards the puller were blocked by the leading sphere. This causes a considerable loss in puller propulsion.
To achieve a higher speed for the sphere, we considered another two situations, as illustrated in figure 21 (see also supplementary movie 4). Figure 21(a) shows the sphere between a puller (
 $\beta$
= 5) and a pusher (
 $\beta$
= −5), and figure 21(b) shows the sphere leading both a puller (
 $\beta$
= 5) and a pusher (
 $\beta$
= −5). The Reynolds number is 0.1. The steady speeds of the sphere are approximately 1.2U
s
(figure 21
a) and approximately 0.99U
s
(figure 21
b), both of which are higher than that of the sphere ‘pushed’ by a pusher (approximately 0.88U
s
, as shown in figure 22
a). Interestingly, the sphere attains the highest speed when it is ‘pulled’ by a puller and ‘pushed’ by a pusher simultaneously.
Time histories of the speeds of a triplet consisting of a sphere and two squirmers at Re
s
= 0.1: (a) sphere between a puller (
 $\beta$
= 5) and a pusher (
 $\beta$
= -5); (b) sphere leading a puller (
 $\beta$
= 5) and a pusher (
 $\beta$
= −5). The insets show the pressure distribution when the motion of the squirmers and sphere is steady. See also supplementary movies 4(a,b).

Terminal speeds of a sphere driven by different mechanisms. (a) Sphere ‘pushed’ by a pusher (
 $\beta$
= −5), ‘pushed’ by a doublet or ‘pulled’ by a puller (
 $\beta$
= 5), and ‘pushed’ by a pusher (
 $\beta$
= −5). (b) Sphere ‘pushed’ by a puller (
 $\beta$
= 5).

The pressure distributions are also shown in the insets of figure 21(a,b) when the motion of the squirmers and sphere is steady. The sphere approaches the (attractive) puller first, regardless of whether it is leading or trailing the puller. Subsequently, the pusher quickly approaches the puller, and a stable triplet forms when the sphere is at the forefront (figure 21
b). In contrast, the pusher never contacts the sphere because of the positive pressure at its front end when the (attractive) puller takes the lead (figure 21
a). Moreover, it takes a much longer time for the sphere to reach the highest speed (figure 21
a). The reasons for this high speed are similar to those described in § 4.2. When the sphere led both squirmers, the self-propulsion dynamics of the puller were significantly suppressed by the sphere (figure 21
b). This is primarily why their speeds were always lower than those of the other situations for all values of Re
s
considered. Figure 22 confirms these findings by summarising the speeds of the sphere driven by different mechanisms. The speed of the sphere increased with Re
s
for all situations indicated in figure 22(a). Moreover, the sphere moves faster when ‘pushed’ by a doublet (consisting of a pusher with
 $\beta$
= −5 and puller with
 $\beta$
= 5) than when ‘pushed’ by a pusher (
 $\beta$
= −5) for a wide range of Re
s
values (figure 22
a). In particular, when the sphere is between the puller and pusher, it may move faster than the pusher alone for
 $ \textit{Re}_{s} \lt 0.5 $
. However, a low speed (approximately 0.17U
s
) is achieved by the sphere when ‘pushed’ by a puller at 0.01 ≤ Re
s
≤ 1 (figure 22
b). The reason for this is the same as that mentioned previously.
4.5. Grouping behaviours of microswimmers and spheres
The grouping behaviours of the squirmers and spheres may reflect the interacting nature and dynamics of these active and passive particles from different aspects. For simplicity, we only considered a situation in which the squirmers and spheres were initially placed in a line with equal centre-to-centre distances S
*(0) = 3. All squirmers (pullers with
 $\beta$
= 5 and pushers with
 $\beta$
= −5) are assumed to swim towards the positive x-axis direction once they are released from rest (figure 2
a). Moreover, simulations were performed at two Reynolds numbers, i.e. Re
s
= 0.1 and 1, for all cases.
Figure 23 shows the instantaneous iso-surfaces of the streamwise fluid velocity for a group of pullers at steady state for Re
s
= 1. The number of pullers varied from one to eight. The pullers are always attractive and eventually form a stable string, regardless of the number of pulses (figure 23). In addition, our simulations reveal that
 $U_a^*$
≈ 0.7 (single puller),
 $U_g^*$
≈ 0.76 (two pullers),
 $U_g^*$
≈ 0.84 (four pullers), and
 $U_g^*$
≈ 0.92 (eight pullers). These results confirm that the speed of the group increases at a slow rate as the number of pullers increases, as mentioned in § 4.1. Similar behaviours for the pullers were observed at Re
s
= 0.1.
Instantaneous iso-surfaces of the streamwise fluid velocity (levels ±0.5, note that the following iso-surfaces maintain the same levels) for a uniform array of pullers (
 $\beta$
= 5) at Re
s
= 1: (a) one puller, (b) three pullers, (c) five pullers, (d) six pullers, (e) eight pullers. For (c) and (d), see also supplementary movies 5(a,b), respectively.

In particular, the time evolution of the speed of each puller (figure 24) reflects the grouping dynamics for a large array of pullers. For instance, the rightmost two pullers always come to contact first and form a forefront doublet, followed by the leftmost two pullers (figure 24). Then the two doublets attract each other, and eventually form a string if there is no other puller (figure 24 a). Otherwise, the puller (if any) next to the forefront doublet will join the doublet, leading to a triplet (figure 24 b). This corresponds to a string of five pullers (figure 23 c). Similarly, the rearmost doublet and nearby puller (if any) will form another triplet. This, of course, leads to a longer string (figure 23 d). The grouping process is repeated in this way if there are more pullers.
Time histories of the speed of each puller at Re s = 1: (a) four pullers, (b) five pullers.

Figure 25 illustrates the different grouping patterns for staggered arrays of pushers and pullers. When the number of squirmers is even, the pusher always comes close to the puller next to it and quickly forms a doublet. These doublets swim separately after a long period and have the same speed (
 $U_g^*$
≈ 2, figure 13
b). Therefore, the squirmers swim in pairs (figure 25
a,d,e). However, for an odd number of squirmers, the leading pusher first leaves the trailing squirmers when they form doublets (figure 25
b,c). Interestingly, the pusher does not move far away, and maintains a distance from its trailing doublet at a steady state. This is unusual because a doublet swims faster than a single pusher, as discussed in § 4.2. However, our analysis suggests that the mobility of the doublet is suppressed as a result of the interaction with the leading pusher, which is repulsive. Similarly, each doublet remained stable while maintaining its distance from the neighbouring doublets. Therefore, all squirmers move as a whole at speed
 $U_g^*$
≈ 1.8 (see figure 27
b below), which is lower than that observed under other conditions (figure 25
a,d,e). Note that this pattern holds true for Re
s
= 1.
Instantaneous iso-surfaces of the streamwise fluid velocity for a staggered array of pushers (
 $\beta$
= −5) and pullers (
 $\beta$
= 5) at Re
s
= 1: (a) two squirmers, (b) three squirmers, (c) five squirmers, (d) six squirmers, (e) eight squirmers. For (d), see also supplementary movie 6.

Instantaneous iso-surfaces of the streamwise fluid velocity for a staggered array of pushers (
 $\beta$
= −5) and pullers (
 $\beta$
= 5) at Re
s
= 0.1: (a) two squirmers, (b) three squirmers, (c) four squirmers, (d) five squirmers, (e) six squirmers, (f) seven squirmers. For (d), see also supplementary movie 7.

Time histories of the speed of each squirmer for a group of five squirmers at (a) Re s = 0.1 and (b) Re s = 1, corresponding to figures 25(c) and 26(d), respectively.

At Re
s
= 0.1, we observed different grouping behaviours (figure 26) compared with those shown in figure 25. For an odd number of squirmers, the leading pusher, which runs the most slowly during the early period (see figure 27
a), will be caught by its trailing doublet. As the leading part of the doublet, the puller dominates the interaction of the doublet with the leading pusher, which differs from the case where Re
s
= 1, and the leading pusher runs much faster (figure 25
b,c). Then the three squirmers form a triplet (see figure 27
a). This triplet swims more slowly than the other trailing doublets (if any). Subsequently, the immediate trailing doublet approaches the triplet. The process is repeated, leading to a large string that consists of all squirmers swimming at speed
 $U_g^*$
= 1.1–1.2 (figure 26
b,d,f), which is much lower than that of a doublet (figure 26
a), i.e.
 $U_g^*$
≈ 1.8. However, when a puller is leading, which corresponds to cases in which the number of squirmers is even, the puller will eventually maintain a distance from the string, which is made up of all trailing squirmers (figure 26
c,e).
As shown in figure 28, the grouping behaviours of the staggered array of pushers and spheres were similar to those shown in figure 25. Each pusher catches up with its leading sphere, and the two move together. For example, four pairs moved separately for a total of eight pushers and spheres (figure 28 b). When the number of particles was odd, the leading pusher always ran fast and left the others behind (not shown). The situation changes if the pushers are replaced by pullers, as shown in figure 29. A string of pullers and spheres is eventually formed owing to the attraction of the pullers when they run in pairs (figure 29 a,d,e,f). However, if a puller is leading, as shown in figure 29(b,c), then it will move far away from the others because a string of pullers and spheres swims very slowly (see also figure 22 b). Similar patterns were obtained in both cases for Re s = 0.1.
Instantaneous iso-surfaces of the streamwise fluid velocity for a staggered array of pushers (
 $\beta$
= −5) and spheres at Re
s
= 1: (a) four particles, (b) eight particles. For (a), see also supplementary movie 8.

Instantaneous iso-surfaces of the streamwise fluid velocity for a staggered array of pullers (
 $\beta$
= 5) and spheres at Re
s
= 1: (a) two particles, (b) three particles, (c) five particles, (d) four particles, (e) six particles, (f) eight particles. For (d), see also supplementary movie 9.

The difference in the grouping dynamics between the puller–sphere (figure 29) and pusher–sphere (figure 28) arrangements could be largely reflected by figure 30(a,b), which show the time evolution of the speeds of four particles corresponding to figures 28(a) and 29(d), respectively. The formation of a puller–sphere doublet (t * ≈ 0.5) is much faster than that of a pusher-sphere (t * ≈ 1). More importantly, the leading puller–sphere doublet always runs slower than the trailing one (figure 30 a). The opposite is seen for the pusher–sphere doublets (figure 30 b).
Time histories of the speed of each particle for a group of four particles at Re s = 1: (a) the puller–sphere arrangement, and (b) the pusher–sphere arrangement, corresponding to figures 28(a) and 29(d), respectively.

5. Summary
In this numerical study, we primarily focused on how a microswimmer interacted with another microswimmer as well as with a sphere for Reynolds numbers 0.01 ≤ Re s ≤ 1 via three-dimensional lattice Boltzmann simulations. For simplicity, we only considered situations in which all microswimmers and spheres were axially aligned. A spherical squirmer model (pullers and pushers) was adopted to simulate the self-propelled motion of the microswimmers. We also focused on the grouping behaviours of multiple microswimmers and spheres to reflect the interaction features between active and passive particles from a different perspective. The results are summarised as follows.
-
(i) Pullers are always attracted to each other, regardless of Re s or
 $\beta$
(the strength of the microswimmers), which leads to a stable doublet that swims as a whole. The speed of the doublet decreased as Re
s
increased, similar to the case of a single puller. In particular, we observed a substantial decrease or increase in the speed of the puller when it was joined to another weaker or stronger puller. The pressure difference between the front and rear ends of the doublet is responsible for the change in speed. A doublet consisting of two identical pullers swims at a slightly higher speed than does a single puller, for all Re
s
values considered. The primary reason for these results is that the self-propelling dynamics of the trailing puller (which gains thrust from the front) was significantly suppressed by the leading puller when they were in close contact as a doublet.
-
(ii) The interactions between the puller and pusher become complicated because the pushers are repulsive, whereas the pullers are attractive. When the puller (
$\beta$
2) leads the pusher (
$\beta$
1), whether or not the two touch largely depends on the relative magnitudes of their strengths, i.e. |
$\beta$
1| and |
$\beta$
2|. For |
$\beta$
2| > |
$\beta$
1|, where the puller dominates, the pusher quickly comes close to the puller and forms a doublet, irrespective of Re
s
. The doublet swims significantly faster than does a single pusher owing to the positive pressure difference force. For |
$\beta$
2| < |
$\beta$
1|, the pusher dominates how it interacts with the puller. That is, the two never touch, despite the trailing squirmer swimming much faster than the leading squirmer at a high Re
s
value (
$ \textit{Re}_{s} = 1 $
). In addition, the terminal speeds depend significantly on Re
s
. For |
$\beta$
2| = |
$\beta$
1|, the pusher maintains a distance from the puller at a low Re
s
(Re
s
< 0.05), but contacts the puller at a high Re
s
. In particular, the squirmers never touch when they exchange initial positions. Because of the negative pressure difference force, the two swim slowly, especially at a low Re
s
. The pusher can eliminate the attractive puller, and each swims individually when Re
s
is sufficiently high (Re
s
= 1). -
(iii) A sphere is always directly ‘pushed’ to run by a puller. The two exhibited low speeds for all Re s values studied because the self-propelling dynamics of the puller were suppressed by the sphere once they touched. In contrast, the sphere is hydrodynamically ‘pushed’ by a pusher, and the two swim faster as Re s increases. We also examined other mechanisms that drive the sphere to run. Notably, the sphere attains the highest speed when it is ‘pulled’ by a leading puller and simultaneously ‘pushed’ by a trailing pusher. Thus the sphere ran faster than a single pusher at
$ \textit{Re}_{s} \lt 0.5 $
. -
(iv) A large string of pullers was eventually formed for multiple axially aligned pullers. However, when the pushers and pullers are initially placed in a staggered manner, the squirmers appear to swim in pairs at high Re s values (Re s = 1) or as a string at low Re s values (Re s = 0.1), similar to the case of a staggered array of pushers and spheres, and that of pullers and spheres, respectively.


This study provides a good understanding of the interactions between microswimmers in flow regimes with negligible and finite fluid inertia. The findings of this study may also shed light on the design of microcargo transport via flagella- or cilia-like microswimmers.
Supplementary movies
Supplementary movies are available at https://doi.org/10.1017/jfm.2025.10679.
Funding
This study was supported by the National Natural Science Foundation of China (grant nos 12132015, 12372251 and 12332015).
Declaration of interests
The authors report no conflict of interest.